Zip Codes with the Highest Percentage of Population Employed in Legal Services & Support in Flint, MI
RELATED REPORTS & OPTIONS
Legal Services & Support
Flint
Compare Zip Codes
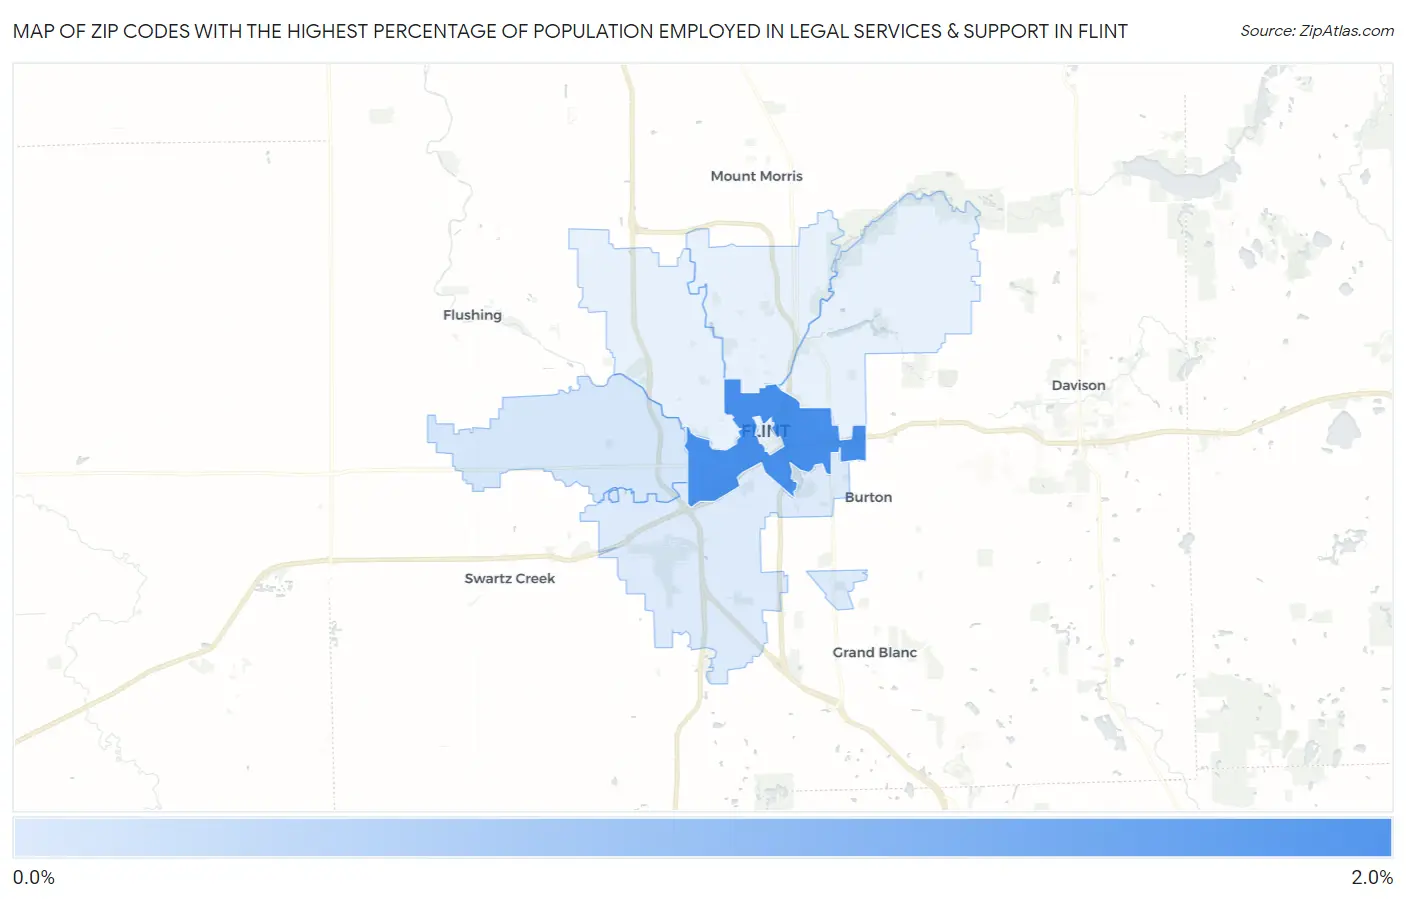
Map of Zip Codes with the Highest Percentage of Population Employed in Legal Services & Support in Flint
0.37%
1.6%
Zip Codes with the Highest Percentage of Population Employed in Legal Services & Support in Flint, MI
| Zip Code | % Employed | vs State | vs National | |
| 1. | 48503 | 1.6% | 0.89%(+0.696)#99 | 1.2%(+0.397)#4,745 |
| 2. | 48532 | 0.42% | 0.89%(-0.468)#420 | 1.2%(-0.767)#13,640 |
| 3. | 48507 | 0.37% | 0.89%(-0.516)#447 | 1.2%(-0.815)#14,214 |
1
Common Questions
What are the Top 5 Zip Codes with the Highest Percentage of Population Employed in Legal Services & Support in Flint, MI?
Top 5 Zip Codes with the Highest Percentage of Population Employed in Legal Services & Support in Flint, MI are:
What zip code has the Highest Percentage of Population Employed in Legal Services & Support in Flint, MI?
48503 has the Highest Percentage of Population Employed in Legal Services & Support in Flint, MI with 1.6%.
What is the Percentage of Population Employed in Legal Services & Support in Flint, MI?
Percentage of Population Employed in Legal Services & Support in Flint is 0.47%.
What is the Percentage of Population Employed in Legal Services & Support in Michigan?
Percentage of Population Employed in Legal Services & Support in Michigan is 0.89%.
What is the Percentage of Population Employed in Legal Services & Support in the United States?
Percentage of Population Employed in Legal Services & Support in the United States is 1.2%.