Zip Codes with the Highest Percentage of Population with a Degree in Arts and Humanities in Kansas
RELATED REPORTS & OPTIONS
Arts and Humanities
Kansas
Compare Zip Codes
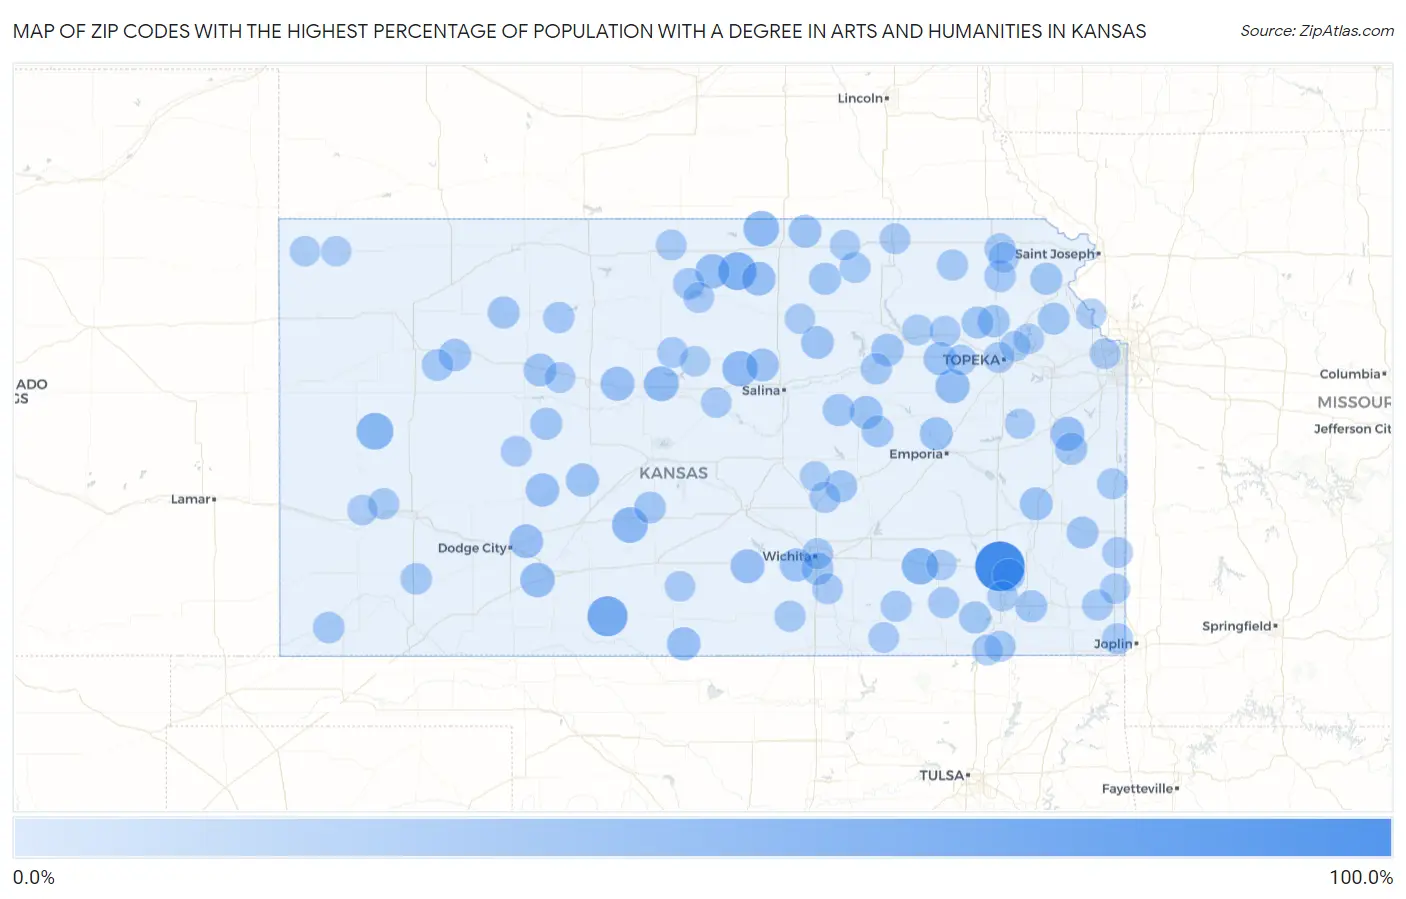
Map of Zip Codes with the Highest Percentage of Population with a Degree in Arts and Humanities in Kansas
0.0%
100.0%
Zip Codes with the Highest Percentage of Population with a Degree in Arts and Humanities in Kansas
| Zip Code | % Graduates | vs State | vs National | |
| 1. | 66714 | 100.0% | 6.6%(+93.4)#1 | 6.0%(+94.0)#56 |
| 2. | 67155 | 56.2% | 6.6%(+49.7)#2 | 6.0%(+50.3)#171 |
| 3. | 66963 | 46.2% | 6.6%(+39.6)#3 | 6.0%(+40.2)#265 |
| 4. | 67863 | 40.6% | 6.6%(+34.1)#4 | 6.0%(+34.6)#337 |
| 5. | 67122 | 39.3% | 6.6%(+32.7)#5 | 6.0%(+33.3)#364 |
| 6. | 67557 | 35.7% | 6.6%(+29.1)#6 | 6.0%(+29.7)#454 |
| 7. | 66964 | 35.3% | 6.6%(+28.7)#7 | 6.0%(+29.3)#467 |
| 8. | 67423 | 34.0% | 6.6%(+27.4)#8 | 6.0%(+28.0)#497 |
| 9. | 67626 | 32.3% | 6.6%(+25.7)#9 | 6.0%(+26.3)#569 |
| 10. | 67842 | 30.3% | 6.6%(+23.7)#10 | 6.0%(+24.3)#646 |
| 11. | 66949 | 29.5% | 6.6%(+22.9)#11 | 6.0%(+23.5)#682 |
| 12. | 66423 | 29.1% | 6.6%(+22.5)#12 | 6.0%(+23.1)#704 |
| 13. | 67640 | 28.0% | 6.6%(+21.4)#13 | 6.0%(+22.0)#759 |
| 14. | 66079 | 27.6% | 6.6%(+21.1)#14 | 6.0%(+21.6)#786 |
| 15. | 67882 | 27.3% | 6.6%(+20.7)#15 | 6.0%(+21.3)#804 |
| 16. | 67111 | 27.3% | 6.6%(+20.7)#16 | 6.0%(+21.3)#805 |
| 17. | 66948 | 27.2% | 6.6%(+20.6)#17 | 6.0%(+21.2)#809 |
| 18. | 67849 | 25.4% | 6.6%(+18.9)#18 | 6.0%(+19.4)#923 |
| 19. | 67070 | 25.3% | 6.6%(+18.8)#19 | 6.0%(+19.3)#929 |
| 20. | 67574 | 25.0% | 6.6%(+18.4)#20 | 6.0%(+19.0)#974 |
| 21. | 67227 | 24.5% | 6.6%(+17.9)#21 | 6.0%(+18.5)#1,002 |
| 22. | 66501 | 24.2% | 6.6%(+17.7)#22 | 6.0%(+18.2)#1,017 |
| 23. | 66835 | 23.9% | 6.6%(+17.3)#23 | 6.0%(+17.9)#1,044 |
| 24. | 66015 | 23.5% | 6.6%(+16.9)#24 | 6.0%(+17.5)#1,074 |
| 25. | 67449 | 23.4% | 6.6%(+16.8)#25 | 6.0%(+17.4)#1,081 |
| 26. | 67484 | 23.3% | 6.6%(+16.7)#26 | 6.0%(+17.3)#1,087 |
| 27. | 67458 | 22.9% | 6.6%(+16.3)#27 | 6.0%(+16.9)#1,128 |
| 28. | 66960 | 22.7% | 6.6%(+16.2)#28 | 6.0%(+16.7)#1,143 |
| 29. | 67656 | 22.5% | 6.6%(+15.9)#29 | 6.0%(+16.5)#1,166 |
| 30. | 66517 | 21.6% | 6.6%(+15.0)#30 | 6.0%(+15.6)#1,281 |
| 31. | 66710 | 21.3% | 6.6%(+14.8)#31 | 6.0%(+15.3)#1,310 |
| 32. | 67737 | 21.3% | 6.6%(+14.7)#32 | 6.0%(+15.3)#1,318 |
| 33. | 66042 | 20.6% | 6.6%(+14.0)#33 | 6.0%(+14.6)#1,409 |
| 34. | 67216 | 20.1% | 6.6%(+13.5)#34 | 6.0%(+14.1)#1,466 |
| 35. | 67650 | 20.0% | 6.6%(+13.4)#35 | 6.0%(+14.0)#1,493 |
| 36. | 67521 | 20.0% | 6.6%(+13.4)#36 | 6.0%(+14.0)#1,504 |
| 37. | 67451 | 19.9% | 6.6%(+13.3)#37 | 6.0%(+13.9)#1,517 |
| 38. | 66509 | 19.6% | 6.6%(+13.1)#38 | 6.0%(+13.7)#1,546 |
| 39. | 66937 | 19.6% | 6.6%(+13.0)#39 | 6.0%(+13.6)#1,552 |
| 40. | 66041 | 19.6% | 6.6%(+13.0)#40 | 6.0%(+13.6)#1,557 |
| 41. | 67341 | 19.4% | 6.6%(+12.8)#41 | 6.0%(+13.4)#1,596 |
| 42. | 67344 | 19.0% | 6.6%(+12.5)#42 | 6.0%(+13.1)#1,643 |
| 43. | 66866 | 18.9% | 6.6%(+12.4)#43 | 6.0%(+12.9)#1,660 |
| 44. | 66779 | 18.9% | 6.6%(+12.3)#44 | 6.0%(+12.9)#1,665 |
| 45. | 67576 | 18.2% | 6.6%(+11.7)#45 | 6.0%(+12.2)#1,791 |
| 46. | 66418 | 18.2% | 6.6%(+11.6)#46 | 6.0%(+12.2)#1,804 |
| 47. | 66838 | 18.2% | 6.6%(+11.6)#47 | 6.0%(+12.2)#1,814 |
| 48. | 66097 | 18.1% | 6.6%(+11.5)#48 | 6.0%(+12.1)#1,828 |
| 49. | 67877 | 17.8% | 6.6%(+11.2)#49 | 6.0%(+11.8)#1,898 |
| 50. | 67738 | 17.7% | 6.6%(+11.1)#50 | 6.0%(+11.7)#1,912 |
| 51. | 66516 | 17.6% | 6.6%(+11.1)#51 | 6.0%(+11.7)#1,928 |
| 52. | 67954 | 17.2% | 6.6%(+10.6)#52 | 6.0%(+11.2)#2,046 |
| 53. | 67430 | 17.0% | 6.6%(+10.5)#53 | 6.0%(+11.0)#2,067 |
| 54. | 66441 | 16.7% | 6.6%(+10.1)#54 | 6.0%(+10.7)#2,137 |
| 55. | 67632 | 16.3% | 6.6%(+9.76)#55 | 6.0%(+10.3)#2,260 |
| 56. | 67345 | 16.2% | 6.6%(+9.65)#56 | 6.0%(+10.2)#2,287 |
| 57. | 67103 | 16.1% | 6.6%(+9.56)#57 | 6.0%(+10.1)#2,313 |
| 58. | 67838 | 16.1% | 6.6%(+9.50)#58 | 6.0%(+10.1)#2,324 |
| 59. | 67023 | 15.6% | 6.6%(+9.05)#59 | 6.0%(+9.63)#2,451 |
| 60. | 66415 | 15.5% | 6.6%(+8.97)#60 | 6.0%(+9.54)#2,478 |
| 61. | 66724 | 15.3% | 6.6%(+8.70)#61 | 6.0%(+9.28)#2,568 |
| 62. | 67340 | 15.0% | 6.6%(+8.43)#62 | 6.0%(+9.00)#2,675 |
| 63. | 66739 | 15.0% | 6.6%(+8.40)#63 | 6.0%(+8.98)#2,686 |
| 64. | 67214 | 14.9% | 6.6%(+8.33)#64 | 6.0%(+8.91)#2,713 |
| 65. | 67114 | 14.8% | 6.6%(+8.22)#65 | 6.0%(+8.79)#2,764 |
| 66. | 66075 | 14.7% | 6.6%(+8.13)#66 | 6.0%(+8.70)#2,798 |
| 67. | 66425 | 14.6% | 6.6%(+8.06)#67 | 6.0%(+8.64)#2,823 |
| 68. | 66943 | 14.6% | 6.6%(+7.99)#68 | 6.0%(+8.57)#2,848 |
| 69. | 66535 | 14.4% | 6.6%(+7.85)#69 | 6.0%(+8.42)#2,918 |
| 70. | 67648 | 14.3% | 6.6%(+7.71)#70 | 6.0%(+8.29)#2,977 |
| 71. | 67364 | 14.3% | 6.6%(+7.71)#71 | 6.0%(+8.29)#2,997 |
| 72. | 67446 | 14.1% | 6.6%(+7.55)#72 | 6.0%(+8.12)#3,065 |
| 73. | 66508 | 14.1% | 6.6%(+7.54)#73 | 6.0%(+8.12)#3,066 |
| 74. | 66606 | 14.1% | 6.6%(+7.53)#74 | 6.0%(+8.11)#3,071 |
| 75. | 67560 | 14.0% | 6.6%(+7.44)#75 | 6.0%(+8.02)#3,121 |
| 76. | 66741 | 14.0% | 6.6%(+7.38)#76 | 6.0%(+7.96)#3,157 |
| 77. | 66111 | 13.9% | 6.6%(+7.37)#77 | 6.0%(+7.94)#3,162 |
| 78. | 67110 | 13.9% | 6.6%(+7.33)#78 | 6.0%(+7.91)#3,169 |
| 79. | 66527 | 13.9% | 6.6%(+7.32)#79 | 6.0%(+7.89)#3,181 |
| 80. | 66407 | 13.8% | 6.6%(+7.28)#80 | 6.0%(+7.85)#3,199 |
| 81. | 67637 | 13.8% | 6.6%(+7.27)#81 | 6.0%(+7.85)#3,202 |
| 82. | 66952 | 13.8% | 6.6%(+7.22)#82 | 6.0%(+7.80)#3,226 |
| 83. | 67038 | 13.7% | 6.6%(+7.13)#83 | 6.0%(+7.70)#3,264 |
| 84. | 67065 | 13.3% | 6.6%(+6.68)#84 | 6.0%(+7.26)#3,496 |
| 85. | 67439 | 13.0% | 6.6%(+6.42)#85 | 6.0%(+7.00)#3,643 |
| 86. | 66507 | 12.9% | 6.6%(+6.31)#86 | 6.0%(+6.88)#3,725 |
| 87. | 66757 | 12.8% | 6.6%(+6.24)#87 | 6.0%(+6.82)#3,765 |
| 88. | 66027 | 12.7% | 6.6%(+6.14)#88 | 6.0%(+6.72)#3,827 |
| 89. | 67481 | 12.7% | 6.6%(+6.12)#89 | 6.0%(+6.69)#3,841 |
| 90. | 67756 | 12.6% | 6.6%(+6.02)#90 | 6.0%(+6.59)#3,896 |
| 91. | 67860 | 12.5% | 6.6%(+5.98)#91 | 6.0%(+6.55)#3,919 |
| 92. | 66968 | 12.5% | 6.6%(+5.93)#92 | 6.0%(+6.50)#3,955 |
| 93. | 67466 | 12.5% | 6.6%(+5.93)#93 | 6.0%(+6.50)#3,967 |
| 94. | 66070 | 12.4% | 6.6%(+5.86)#94 | 6.0%(+6.44)#4,025 |
| 95. | 66763 | 12.4% | 6.6%(+5.82)#95 | 6.0%(+6.39)#4,056 |
| 96. | 66617 | 12.3% | 6.6%(+5.75)#96 | 6.0%(+6.33)#4,098 |
| 97. | 67137 | 12.1% | 6.6%(+5.55)#97 | 6.0%(+6.13)#4,228 |
| 98. | 67053 | 11.9% | 6.6%(+5.36)#98 | 6.0%(+5.93)#4,366 |
| 99. | 66528 | 11.9% | 6.6%(+5.35)#99 | 6.0%(+5.92)#4,368 |
| 100. | 67731 | 11.9% | 6.6%(+5.33)#100 | 6.0%(+5.91)#4,381 |
Common Questions
What are the Top 10 Zip Codes with the Highest Percentage of Population with a Degree in Arts and Humanities in Kansas?
Top 10 Zip Codes with the Highest Percentage of Population with a Degree in Arts and Humanities in Kansas are:
What zip code has the Highest Percentage of Population with a Degree in Arts and Humanities in Kansas?
66714 has the Highest Percentage of Population with a Degree in Arts and Humanities in Kansas with 100.0%.
What is the Percentage of Population with a Degree in Arts and Humanities in the State of Kansas?
Percentage of Population with a Degree in Arts and Humanities in Kansas is 6.6%.
What is the Percentage of Population with a Degree in Arts and Humanities in the United States?
Percentage of Population with a Degree in Arts and Humanities in the United States is 6.0%.