Zip Codes with the Highest Percentage of Scotch-Irish Population in Kansas
RELATED REPORTS & OPTIONS
Scotch-Irish
Kansas
Compare Zip Codes
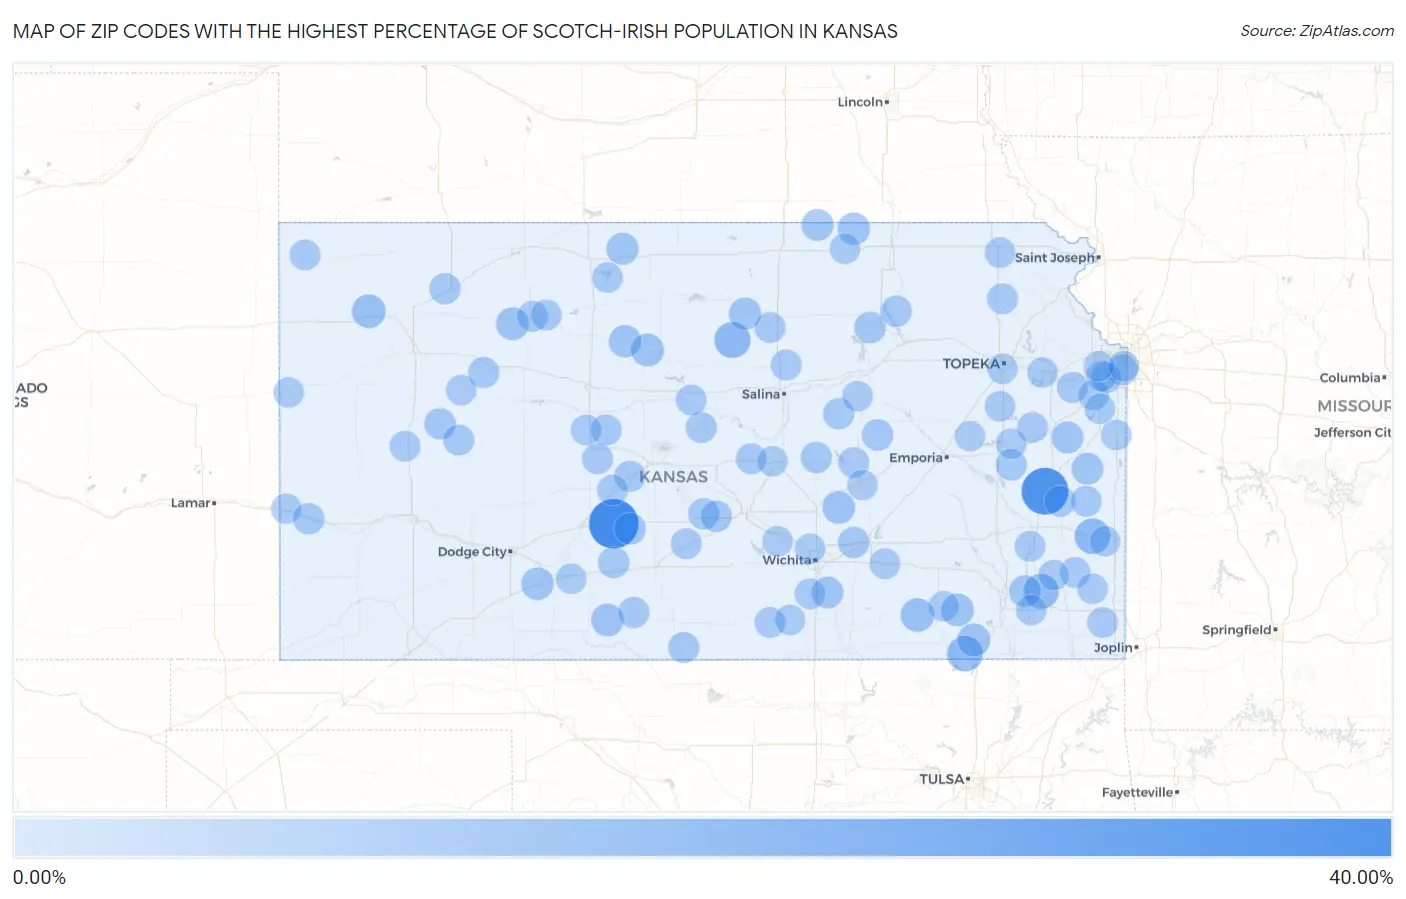
Map of Zip Codes with the Highest Percentage of Scotch-Irish Population in Kansas
0.00%
40.00%
Zip Codes with the Highest Percentage of Scotch-Irish Population in Kansas
| Zip Code | Scotch-Irish | vs State | vs National | |
| 1. | 67519 | 35.46% | 0.90%(+34.6)#1 | 0.82%(+34.6)#22 |
| 2. | 66091 | 30.57% | 0.90%(+29.7)#2 | 0.82%(+29.8)#26 |
| 3. | 67418 | 11.48% | 0.90%(+10.6)#3 | 0.82%(+10.7)#164 |
| 4. | 66769 | 10.66% | 0.90%(+9.76)#4 | 0.82%(+9.84)#191 |
| 5. | 67355 | 10.57% | 0.90%(+9.67)#5 | 0.82%(+9.75)#194 |
| 6. | 66740 | 9.90% | 0.90%(+9.00)#6 | 0.82%(+9.08)#227 |
| 7. | 67743 | 7.21% | 0.90%(+6.31)#7 | 0.82%(+6.39)#418 |
| 8. | 67346 | 7.16% | 0.90%(+6.26)#8 | 0.82%(+6.34)#424 |
| 9. | 67347 | 6.09% | 0.90%(+5.19)#9 | 0.82%(+5.27)#541 |
| 10. | 67673 | 5.88% | 0.90%(+4.98)#10 | 0.82%(+5.06)#568 |
| 11. | 67659 | 5.80% | 0.90%(+4.90)#11 | 0.82%(+4.98)#587 |
| 12. | 67352 | 5.66% | 0.90%(+4.76)#12 | 0.82%(+4.84)#618 |
| 13. | 67041 | 5.54% | 0.90%(+4.64)#13 | 0.82%(+4.72)#639 |
| 14. | 67155 | 5.50% | 0.90%(+4.61)#14 | 0.82%(+4.69)#649 |
| 15. | 67651 | 5.25% | 0.90%(+4.35)#15 | 0.82%(+4.44)#698 |
| 16. | 67842 | 5.20% | 0.90%(+4.30)#16 | 0.82%(+4.38)#712 |
| 17. | 66946 | 5.00% | 0.90%(+4.10)#17 | 0.82%(+4.18)#762 |
| 18. | 67478 | 5.00% | 0.90%(+4.10)#18 | 0.82%(+4.18)#763 |
| 19. | 66951 | 4.63% | 0.90%(+3.73)#19 | 0.82%(+3.82)#869 |
| 20. | 66776 | 4.41% | 0.90%(+3.51)#20 | 0.82%(+3.59)#949 |
| 21. | 66079 | 4.31% | 0.90%(+3.41)#21 | 0.82%(+3.50)#996 |
| 22. | 66072 | 4.25% | 0.90%(+3.35)#22 | 0.82%(+3.43)#1,021 |
| 23. | 66955 | 4.08% | 0.90%(+3.18)#23 | 0.82%(+3.26)#1,091 |
| 24. | 67110 | 4.06% | 0.90%(+3.16)#24 | 0.82%(+3.24)#1,101 |
| 25. | 67557 | 3.87% | 0.90%(+2.97)#25 | 0.82%(+3.05)#1,202 |
| 26. | 66531 | 3.72% | 0.90%(+2.82)#26 | 0.82%(+2.90)#1,292 |
| 27. | 66838 | 3.67% | 0.90%(+2.77)#27 | 0.82%(+2.85)#1,330 |
| 28. | 67850 | 3.65% | 0.90%(+2.75)#28 | 0.82%(+2.83)#1,339 |
| 29. | 67144 | 3.41% | 0.90%(+2.51)#29 | 0.82%(+2.59)#1,513 |
| 30. | 67073 | 3.41% | 0.90%(+2.51)#30 | 0.82%(+2.59)#1,517 |
| 31. | 67568 | 3.36% | 0.90%(+2.46)#31 | 0.82%(+2.54)#1,568 |
| 32. | 67757 | 3.35% | 0.90%(+2.46)#32 | 0.82%(+2.54)#1,570 |
| 33. | 66520 | 3.35% | 0.90%(+2.45)#33 | 0.82%(+2.53)#1,579 |
| 34. | 67059 | 3.30% | 0.90%(+2.40)#34 | 0.82%(+2.48)#1,620 |
| 35. | 67510 | 3.27% | 0.90%(+2.37)#35 | 0.82%(+2.45)#1,642 |
| 36. | 67878 | 3.27% | 0.90%(+2.37)#36 | 0.82%(+2.45)#1,650 |
| 37. | 67567 | 3.23% | 0.90%(+2.34)#37 | 0.82%(+2.42)#1,694 |
| 38. | 66025 | 3.18% | 0.90%(+2.28)#38 | 0.82%(+2.36)#1,750 |
| 39. | 66871 | 3.13% | 0.90%(+2.23)#39 | 0.82%(+2.31)#1,805 |
| 40. | 67451 | 3.11% | 0.90%(+2.21)#40 | 0.82%(+2.30)#1,826 |
| 41. | 67752 | 3.09% | 0.90%(+2.19)#41 | 0.82%(+2.27)#1,846 |
| 42. | 67143 | 2.99% | 0.90%(+2.09)#42 | 0.82%(+2.17)#1,977 |
| 43. | 67070 | 2.97% | 0.90%(+2.07)#43 | 0.82%(+2.15)#1,984 |
| 44. | 67459 | 2.81% | 0.90%(+1.91)#44 | 0.82%(+2.00)#2,188 |
| 45. | 67520 | 2.78% | 0.90%(+1.88)#45 | 0.82%(+1.96)#2,231 |
| 46. | 67839 | 2.76% | 0.90%(+1.86)#46 | 0.82%(+1.94)#2,257 |
| 47. | 67756 | 2.69% | 0.90%(+1.79)#47 | 0.82%(+1.87)#2,349 |
| 48. | 67436 | 2.69% | 0.90%(+1.79)#48 | 0.82%(+1.87)#2,355 |
| 49. | 66436 | 2.68% | 0.90%(+1.78)#49 | 0.82%(+1.86)#2,370 |
| 50. | 66039 | 2.67% | 0.90%(+1.77)#50 | 0.82%(+1.85)#2,378 |
| 51. | 66010 | 2.62% | 0.90%(+1.72)#51 | 0.82%(+1.80)#2,462 |
| 52. | 67642 | 2.61% | 0.90%(+1.72)#52 | 0.82%(+1.80)#2,465 |
| 53. | 67583 | 2.56% | 0.90%(+1.66)#53 | 0.82%(+1.74)#2,576 |
| 54. | 67422 | 2.55% | 0.90%(+1.65)#54 | 0.82%(+1.73)#2,594 |
| 55. | 67871 | 2.54% | 0.90%(+1.64)#55 | 0.82%(+1.72)#2,605 |
| 56. | 67491 | 2.53% | 0.90%(+1.63)#56 | 0.82%(+1.71)#2,630 |
| 57. | 67625 | 2.52% | 0.90%(+1.62)#57 | 0.82%(+1.70)#2,647 |
| 58. | 67490 | 2.49% | 0.90%(+1.59)#58 | 0.82%(+1.67)#2,697 |
| 59. | 66076 | 2.43% | 0.90%(+1.53)#59 | 0.82%(+1.61)#2,786 |
| 60. | 66748 | 2.39% | 0.90%(+1.49)#60 | 0.82%(+1.58)#2,841 |
| 61. | 66780 | 2.39% | 0.90%(+1.49)#61 | 0.82%(+1.57)#2,862 |
| 62. | 67550 | 2.38% | 0.90%(+1.48)#62 | 0.82%(+1.56)#2,879 |
| 63. | 67548 | 2.38% | 0.90%(+1.48)#63 | 0.82%(+1.56)#2,882 |
| 64. | 67004 | 2.38% | 0.90%(+1.48)#64 | 0.82%(+1.56)#2,884 |
| 65. | 67575 | 2.36% | 0.90%(+1.46)#65 | 0.82%(+1.54)#2,908 |
| 66. | 66773 | 2.33% | 0.90%(+1.44)#66 | 0.82%(+1.52)#2,961 |
| 67. | 66861 | 2.28% | 0.90%(+1.38)#67 | 0.82%(+1.46)#3,073 |
| 68. | 67120 | 2.22% | 0.90%(+1.32)#68 | 0.82%(+1.40)#3,232 |
| 69. | 66425 | 2.19% | 0.90%(+1.29)#69 | 0.82%(+1.38)#3,288 |
| 70. | 67644 | 2.17% | 0.90%(+1.27)#70 | 0.82%(+1.36)#3,337 |
| 71. | 67074 | 2.17% | 0.90%(+1.27)#71 | 0.82%(+1.35)#3,359 |
| 72. | 67109 | 2.14% | 0.90%(+1.25)#72 | 0.82%(+1.33)#3,400 |
| 73. | 66208 | 2.13% | 0.90%(+1.23)#73 | 0.82%(+1.32)#3,431 |
| 74. | 66031 | 2.13% | 0.90%(+1.23)#74 | 0.82%(+1.31)#3,439 |
| 75. | 66219 | 2.10% | 0.90%(+1.20)#75 | 0.82%(+1.28)#3,520 |
| 76. | 66743 | 2.07% | 0.90%(+1.17)#76 | 0.82%(+1.25)#3,616 |
| 77. | 66537 | 2.05% | 0.90%(+1.15)#77 | 0.82%(+1.23)#3,676 |
| 78. | 67341 | 2.02% | 0.90%(+1.12)#78 | 0.82%(+1.21)#3,737 |
| 79. | 66968 | 1.99% | 0.90%(+1.09)#79 | 0.82%(+1.17)#3,874 |
| 80. | 67492 | 1.98% | 0.90%(+1.08)#80 | 0.82%(+1.16)#3,904 |
| 81. | 67736 | 1.97% | 0.90%(+1.07)#81 | 0.82%(+1.16)#3,932 |
| 82. | 66701 | 1.96% | 0.90%(+1.06)#82 | 0.82%(+1.15)#3,960 |
| 83. | 66220 | 1.95% | 0.90%(+1.06)#83 | 0.82%(+1.14)#3,988 |
| 84. | 66851 | 1.94% | 0.90%(+1.05)#84 | 0.82%(+1.13)#4,009 |
| 85. | 67460 | 1.91% | 0.90%(+1.01)#85 | 0.82%(+1.09)#4,130 |
| 86. | 67345 | 1.89% | 0.90%(+0.988)#86 | 0.82%(+1.07)#4,211 |
| 87. | 66226 | 1.86% | 0.90%(+0.957)#87 | 0.82%(+1.04)#4,314 |
| 88. | 67762 | 1.83% | 0.90%(+0.927)#88 | 0.82%(+1.01)#4,417 |
| 89. | 66205 | 1.81% | 0.90%(+0.908)#89 | 0.82%(+0.990)#4,479 |
| 90. | 66733 | 1.79% | 0.90%(+0.895)#90 | 0.82%(+0.976)#4,526 |
| 91. | 66868 | 1.77% | 0.90%(+0.871)#91 | 0.82%(+0.952)#4,618 |
| 92. | 67108 | 1.77% | 0.90%(+0.869)#92 | 0.82%(+0.950)#4,626 |
| 93. | 66510 | 1.76% | 0.90%(+0.858)#93 | 0.82%(+0.939)#4,679 |
| 94. | 66049 | 1.76% | 0.90%(+0.857)#94 | 0.82%(+0.938)#4,684 |
| 95. | 66611 | 1.75% | 0.90%(+0.853)#95 | 0.82%(+0.935)#4,697 |
| 96. | 66083 | 1.73% | 0.90%(+0.830)#96 | 0.82%(+0.912)#4,786 |
| 97. | 67103 | 1.72% | 0.90%(+0.825)#97 | 0.82%(+0.906)#4,803 |
| 98. | 67204 | 1.72% | 0.90%(+0.820)#98 | 0.82%(+0.901)#4,824 |
| 99. | 66053 | 1.71% | 0.90%(+0.816)#99 | 0.82%(+0.897)#4,851 |
| 100. | 67836 | 1.69% | 0.90%(+0.796)#100 | 0.82%(+0.877)#4,938 |
Common Questions
What are the Top 10 Zip Codes with the Highest Percentage of Scotch-Irish Population in Kansas?
Top 10 Zip Codes with the Highest Percentage of Scotch-Irish Population in Kansas are:
What zip code has the Highest Percentage of Scotch-Irish Population in Kansas?
67519 has the Highest Percentage of Scotch-Irish Population in Kansas with 35.46%.
What is the Percentage of Scotch-Irish Population in the State of Kansas?
Percentage of Scotch-Irish Population in Kansas is 0.90%.
What is the Percentage of Scotch-Irish Population in the United States?
Percentage of Scotch-Irish Population in the United States is 0.82%.