Zip Codes with the Highest Percentage of Not-for-profit Organizations in Kansas
RELATED REPORTS & OPTIONS
Not-for-profit Organizations
Kansas
Compare Zip Codes
Map of Zip Codes with the Highest Percentage of Not-for-profit Organizations in Kansas
0.0%
100.0%
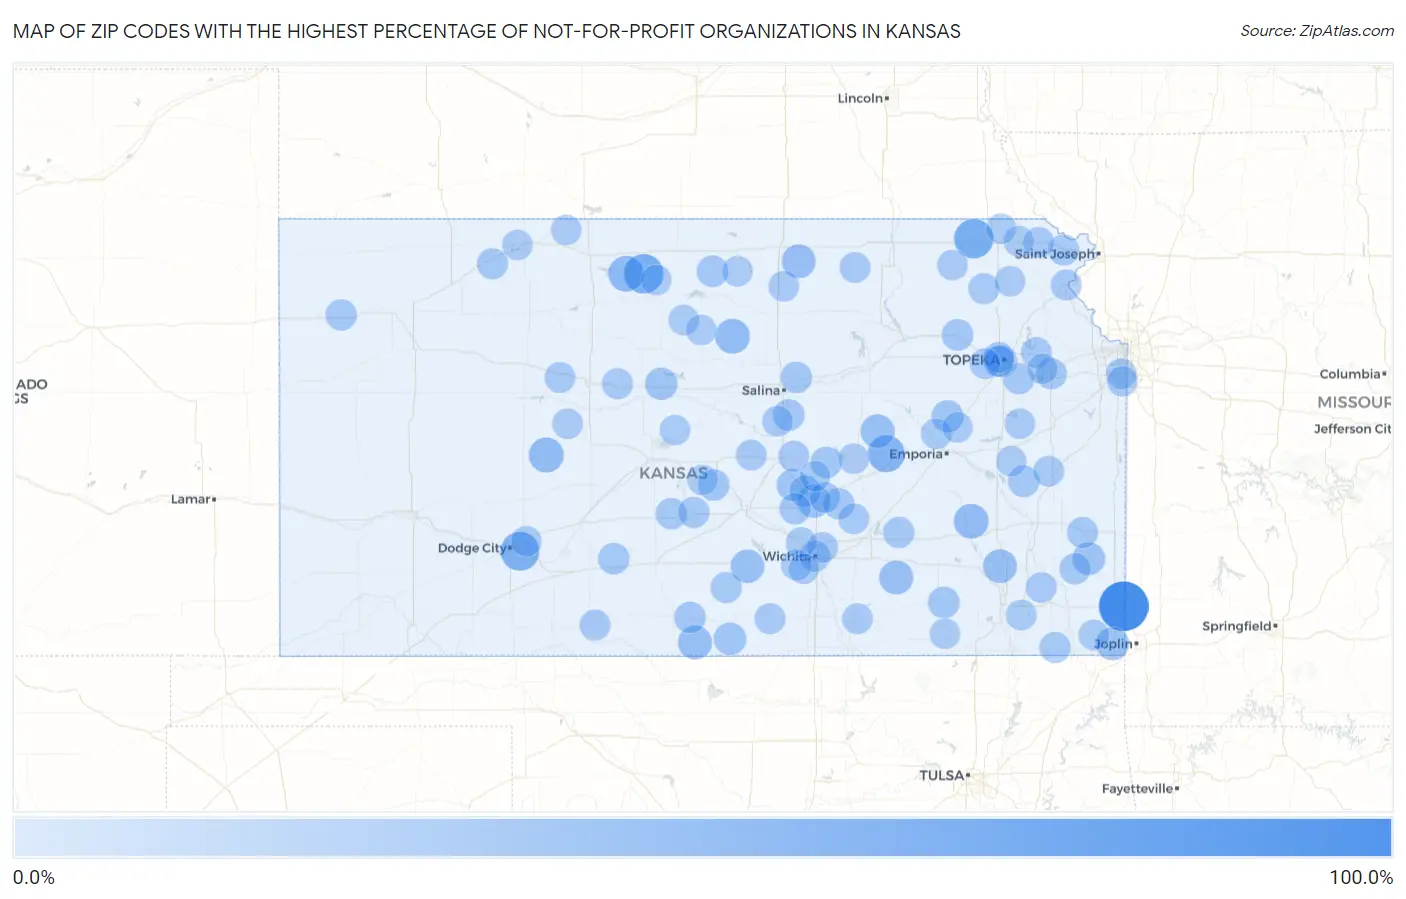
Zip Codes with the Highest Percentage of Not-for-profit Organizations in Kansas
| Zip Code | % Employed in Not-for-profit | vs State | vs National | |
| 1. | 66760 | 100.0% | 8.1% (+91.9)#1 | 8.4% (+91.6)#36 |
| 2. | 67638 | 52.8% | 8.1% (+44.6)#2 | 8.4% (+44.3)#113 |
| 3. | 66522 | 52.4% | 8.1% (+44.3)#3 | 8.4% (+44.0)#116 |
| 4. | 67843 | 50.0% | 8.1% (+41.9)#4 | 8.4% (+41.6)#135 |
| 5. | 66850 | 42.3% | 8.1% (+34.1)#5 | 8.4% (+33.8)#210 |
| 6. | 67628 | 36.5% | 8.1% (+28.3)#6 | 8.4% (+28.0)#293 |
| 7. | 67516 | 32.8% | 8.1% (+24.7)#7 | 8.4% (+24.4)#365 |
| 8. | 66870 | 31.7% | 8.1% (+23.5)#8 | 8.4% (+23.2)#392 |
| 9. | 67418 | 31.6% | 8.1% (+23.4)#9 | 8.4% (+23.1)#394 |
| 10. | 67061 | 28.1% | 8.1% (+20.0)#10 | 8.4% (+19.7)#514 |
| 11. | 66714 | 28.1% | 8.1% (+19.9)#11 | 8.4% (+19.6)#519 |
| 12. | 67072 | 28.0% | 8.1% (+19.9)#12 | 8.4% (+19.6)#520 |
| 13. | 66930 | 27.5% | 8.1% (+19.4)#13 | 8.4% (+19.1)#547 |
| 14. | 66838 | 27.2% | 8.1% (+19.0)#14 | 8.4% (+18.7)#569 |
| 15. | 67111 | 26.4% | 8.1% (+18.3)#15 | 8.4% (+18.0)#604 |
| 16. | 67117 | 24.6% | 8.1% (+16.5)#16 | 8.4% (+16.2)#723 |
| 17. | 66770 | 23.7% | 8.1% (+15.5)#17 | 8.4% (+15.2)#815 |
| 18. | 66746 | 22.6% | 8.1% (+14.4)#18 | 8.4% (+14.1)#939 |
| 19. | 67003 | 21.5% | 8.1% (+13.4)#19 | 8.4% (+13.1)#1,076 |
| 20. | 67626 | 20.9% | 8.1% (+12.8)#20 | 8.4% (+12.5)#1,164 |
| 21. | 66833 | 20.1% | 8.1% (+11.9)#21 | 8.4% (+11.6)#1,273 |
| 22. | 66621 | 19.0% | 8.1% (+10.9)#22 | 8.4% (+10.6)#1,489 |
| 23. | 67107 | 18.6% | 8.1% (+10.4)#23 | 8.4% (+10.1)#1,573 |
| 24. | 67345 | 18.2% | 8.1% (+10.0)#24 | 8.4% (+9.74)#1,666 |
| 25. | 66949 | 17.7% | 8.1% (+9.56)#25 | 8.4% (+9.26)#1,792 |
| 26. | 66536 | 17.7% | 8.1% (+9.53)#26 | 8.4% (+9.23)#1,805 |
| 27. | 66093 | 17.7% | 8.1% (+9.53)#27 | 8.4% (+9.23)#1,806 |
| 28. | 67416 | 17.6% | 8.1% (+9.49)#28 | 8.4% (+9.19)#1,817 |
| 29. | 67059 | 17.2% | 8.1% (+9.02)#29 | 8.4% (+8.72)#1,972 |
| 30. | 67138 | 17.1% | 8.1% (+8.96)#30 | 8.4% (+8.66)#1,991 |
| 31. | 67062 | 17.0% | 8.1% (+8.87)#31 | 8.4% (+8.57)#2,018 |
| 32. | 67470 | 16.9% | 8.1% (+8.75)#32 | 8.4% (+8.44)#2,058 |
| 33. | 67579 | 16.8% | 8.1% (+8.70)#33 | 8.4% (+8.40)#2,079 |
| 34. | 67063 | 16.7% | 8.1% (+8.54)#34 | 8.4% (+8.24)#2,141 |
| 35. | 67056 | 16.6% | 8.1% (+8.43)#35 | 8.4% (+8.12)#2,196 |
| 36. | 67578 | 16.5% | 8.1% (+8.39)#36 | 8.4% (+8.09)#2,217 |
| 37. | 67733 | 16.4% | 8.1% (+8.28)#37 | 8.4% (+7.97)#2,271 |
| 38. | 67132 | 16.2% | 8.1% (+8.06)#38 | 8.4% (+7.76)#2,356 |
| 39. | 67581 | 16.1% | 8.1% (+7.92)#39 | 8.4% (+7.62)#2,424 |
| 40. | 66780 | 15.8% | 8.1% (+7.65)#40 | 8.4% (+7.35)#2,538 |
| 41. | 67142 | 15.6% | 8.1% (+7.43)#41 | 8.4% (+7.12)#2,642 |
| 42. | 66045 | 15.5% | 8.1% (+7.33)#42 | 8.4% (+7.03)#2,689 |
| 43. | 67041 | 15.4% | 8.1% (+7.24)#43 | 8.4% (+6.94)#2,734 |
| 44. | 66409 | 15.4% | 8.1% (+7.24)#44 | 8.4% (+6.94)#2,741 |
| 45. | 67332 | 15.3% | 8.1% (+7.13)#45 | 8.4% (+6.83)#2,788 |
| 46. | 67629 | 15.2% | 8.1% (+7.01)#46 | 8.4% (+6.71)#2,854 |
| 47. | 66779 | 15.1% | 8.1% (+6.98)#47 | 8.4% (+6.68)#2,872 |
| 48. | 66604 | 14.9% | 8.1% (+6.76)#48 | 8.4% (+6.46)#2,997 |
| 49. | 66087 | 14.9% | 8.1% (+6.75)#49 | 8.4% (+6.45)#3,006 |
| 50. | 67029 | 14.8% | 8.1% (+6.69)#50 | 8.4% (+6.39)#3,039 |
| 51. | 67004 | 14.7% | 8.1% (+6.54)#51 | 8.4% (+6.24)#3,121 |
| 52. | 66416 | 14.6% | 8.1% (+6.44)#52 | 8.4% (+6.14)#3,189 |
| 53. | 67443 | 14.5% | 8.1% (+6.41)#53 | 8.4% (+6.10)#3,202 |
| 54. | 66943 | 14.5% | 8.1% (+6.37)#54 | 8.4% (+6.07)#3,225 |
| 55. | 67674 | 14.5% | 8.1% (+6.37)#55 | 8.4% (+6.07)#3,226 |
| 56. | 66606 | 14.5% | 8.1% (+6.37)#56 | 8.4% (+6.07)#3,227 |
| 57. | 67637 | 14.5% | 8.1% (+6.36)#57 | 8.4% (+6.06)#3,237 |
| 58. | 66002 | 14.5% | 8.1% (+6.32)#58 | 8.4% (+6.01)#3,265 |
| 59. | 66073 | 14.4% | 8.1% (+6.28)#59 | 8.4% (+5.98)#3,290 |
| 60. | 67202 | 14.1% | 8.1% (+5.98)#60 | 8.4% (+5.68)#3,477 |
| 61. | 66032 | 14.1% | 8.1% (+5.95)#61 | 8.4% (+5.65)#3,508 |
| 62. | 67220 | 14.0% | 8.1% (+5.90)#62 | 8.4% (+5.60)#3,550 |
| 63. | 67156 | 14.0% | 8.1% (+5.83)#63 | 8.4% (+5.53)#3,617 |
| 64. | 66614 | 13.9% | 8.1% (+5.79)#64 | 8.4% (+5.49)#3,642 |
| 65. | 67491 | 13.8% | 8.1% (+5.63)#65 | 8.4% (+5.32)#3,788 |
| 66. | 66532 | 13.7% | 8.1% (+5.58)#66 | 8.4% (+5.27)#3,831 |
| 67. | 67123 | 13.7% | 8.1% (+5.54)#67 | 8.4% (+5.24)#3,857 |
| 68. | 66740 | 13.6% | 8.1% (+5.44)#68 | 8.4% (+5.14)#3,944 |
| 69. | 66901 | 13.5% | 8.1% (+5.34)#69 | 8.4% (+5.04)#4,023 |
| 70. | 66207 | 13.5% | 8.1% (+5.34)#70 | 8.4% (+5.04)#4,025 |
| 71. | 67456 | 13.5% | 8.1% (+5.33)#71 | 8.4% (+5.03)#4,034 |
| 72. | 67114 | 13.5% | 8.1% (+5.32)#72 | 8.4% (+5.02)#4,039 |
| 73. | 67227 | 13.5% | 8.1% (+5.32)#73 | 8.4% (+5.02)#4,051 |
| 74. | 66725 | 13.4% | 8.1% (+5.30)#74 | 8.4% (+5.00)#4,076 |
| 75. | 67335 | 13.4% | 8.1% (+5.28)#75 | 8.4% (+4.98)#4,089 |
| 76. | 67485 | 13.3% | 8.1% (+5.16)#76 | 8.4% (+4.85)#4,226 |
| 77. | 66835 | 13.2% | 8.1% (+5.06)#77 | 8.4% (+4.75)#4,312 |
| 78. | 67556 | 13.2% | 8.1% (+5.02)#78 | 8.4% (+4.71)#4,363 |
| 79. | 66963 | 13.0% | 8.1% (+4.90)#79 | 8.4% (+4.60)#4,462 |
| 80. | 67101 | 13.0% | 8.1% (+4.90)#80 | 8.4% (+4.59)#4,471 |
| 81. | 66528 | 13.0% | 8.1% (+4.87)#81 | 8.4% (+4.57)#4,490 |
| 82. | 67474 | 12.9% | 8.1% (+4.80)#82 | 8.4% (+4.50)#4,558 |
| 83. | 67361 | 12.9% | 8.1% (+4.76)#83 | 8.4% (+4.46)#4,587 |
| 84. | 67215 | 12.9% | 8.1% (+4.75)#84 | 8.4% (+4.45)#4,605 |
| 85. | 67882 | 12.9% | 8.1% (+4.73)#85 | 8.4% (+4.43)#4,625 |
| 86. | 67452 | 12.8% | 8.1% (+4.68)#86 | 8.4% (+4.38)#4,684 |
| 87. | 66861 | 12.8% | 8.1% (+4.68)#87 | 8.4% (+4.37)#4,690 |
| 88. | 66415 | 12.8% | 8.1% (+4.67)#88 | 8.4% (+4.37)#4,698 |
| 89. | 66434 | 12.8% | 8.1% (+4.64)#89 | 8.4% (+4.34)#4,730 |
| 90. | 67654 | 12.8% | 8.1% (+4.61)#90 | 8.4% (+4.31)#4,769 |
| 91. | 67525 | 12.7% | 8.1% (+4.60)#91 | 8.4% (+4.30)#4,773 |
| 92. | 67512 | 12.7% | 8.1% (+4.60)#92 | 8.4% (+4.30)#4,777 |
| 93. | 66552 | 12.7% | 8.1% (+4.57)#93 | 8.4% (+4.26)#4,827 |
| 94. | 66830 | 12.7% | 8.1% (+4.53)#94 | 8.4% (+4.23)#4,858 |
| 95. | 66515 | 12.6% | 8.1% (+4.42)#95 | 8.4% (+4.11)#4,982 |
| 96. | 66871 | 12.5% | 8.1% (+4.40)#96 | 8.4% (+4.10)#5,002 |
| 97. | 66209 | 12.5% | 8.1% (+4.35)#97 | 8.4% (+4.05)#5,058 |
| 98. | 67647 | 12.4% | 8.1% (+4.23)#98 | 8.4% (+3.93)#5,183 |
| 99. | 66049 | 12.3% | 8.1% (+4.20)#99 | 8.4% (+3.90)#5,205 |
| 100. | 67053 | 12.3% | 8.1% (+4.15)#100 | 8.4% (+3.85)#5,270 |
Common Questions
What are the Top 10 Zip Codes with the Highest Percentage of Not-for-profit Organizations in Kansas?
Top 10 Zip Codes with the Highest Percentage of Not-for-profit Organizations in Kansas are:
What zip code has the Highest Percentage of Not-for-profit Organizations in Kansas?
66760 has the Highest Percentage of Not-for-profit Organizations in Kansas with 100.0%.
What is the Percentage of Not-for-profit Organizations in the State of Kansas?
Percentage of Not-for-profit Organizations in Kansas is 8.1%.
What is the Percentage of Not-for-profit Organizations in the United States?
Percentage of Not-for-profit Organizations in the United States is 8.4%.