Morris County, KS Map & Demographics
Morris County Map
Morris County Overview
$32,462
PER CAPITA INCOME
$71,776
AVG FAMILY INCOME
$52,866
AVG HOUSEHOLD INCOME
20.9%
WAGE / INCOME GAP [ % ]
79.1¢/ $1
WAGE / INCOME GAP [ $ ]
0.45
INEQUALITY / GINI INDEX
5,385
TOTAL POPULATION
2,791
MALE POPULATION
2,594
FEMALE POPULATION
107.59
MALES / 100 FEMALES
92.94
FEMALES / 100 MALES
46.5
MEDIAN AGE
2.9
AVG FAMILY SIZE
2.3
AVG HOUSEHOLD SIZE
2,700
LABOR FORCE [ PEOPLE ]
62.2%
PERCENT IN LABOR FORCE
2.1%
UNEMPLOYMENT RATE
Income in Morris County
Income Overview in Morris County
Per Capita Income in Morris County is $32,462, while median incomes of families and households are $71,776 and $52,866 respectively.
| Characteristic | Number | Measure |
| Per Capita Income | 5,385 | $32,462 |
| Median Family Income | 1,470 | $71,776 |
| Mean Family Income | 1,470 | $88,876 |
| Median Household Income | 2,288 | $52,866 |
| Mean Household Income | 2,288 | $72,380 |
| Income Deficit | 1,470 | $0 |
| Wage / Income Gap (%) | 5,385 | 20.95% |
| Wage / Income Gap ($) | 5,385 | 79.05¢ per $1 |
| Gini / Inequality Index | 5,385 | 0.45 |
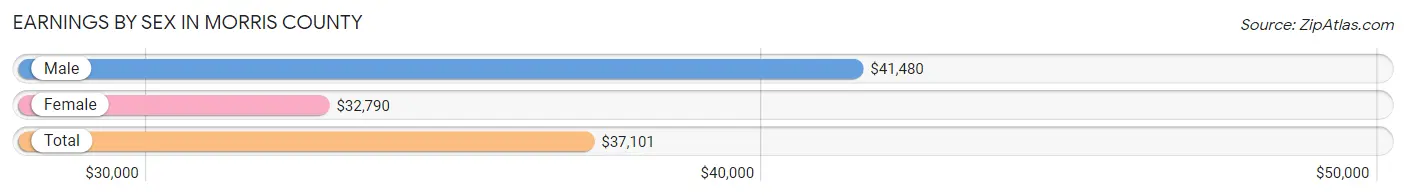
Earnings by Sex in Morris County
Average Earnings in Morris County are $37,101, $41,480 for men and $32,790 for women, a difference of 20.9%.
| Sex | Number | Average Earnings |
| Male | 1,504 (51.7%) | $41,480 |
| Female | 1,402 (48.2%) | $32,790 |
| Total | 2,906 (100.0%) | $37,101 |
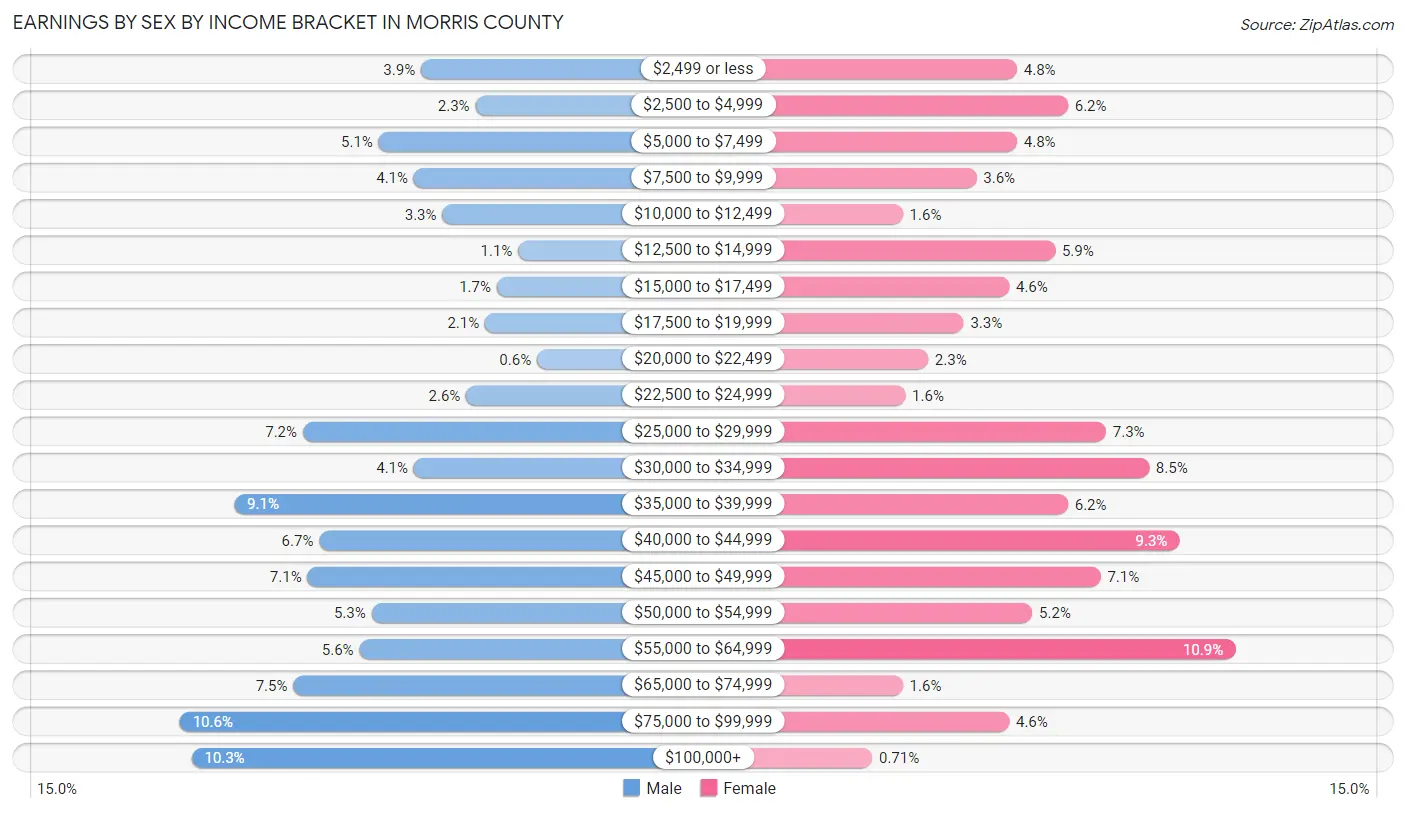
Earnings by Sex by Income Bracket in Morris County
The most common earnings brackets in Morris County are $75,000 to $99,999 for men (160 | 10.6%) and $55,000 to $64,999 for women (153 | 10.9%).
| Income | Male | Female |
| $2,499 or less | 58 (3.9%) | 67 (4.8%) |
| $2,500 to $4,999 | 35 (2.3%) | 87 (6.2%) |
| $5,000 to $7,499 | 76 (5.1%) | 67 (4.8%) |
| $7,500 to $9,999 | 61 (4.1%) | 51 (3.6%) |
| $10,000 to $12,499 | 49 (3.3%) | 22 (1.6%) |
| $12,500 to $14,999 | 17 (1.1%) | 82 (5.9%) |
| $15,000 to $17,499 | 26 (1.7%) | 64 (4.6%) |
| $17,500 to $19,999 | 31 (2.1%) | 46 (3.3%) |
| $20,000 to $22,499 | 9 (0.6%) | 32 (2.3%) |
| $22,500 to $24,999 | 39 (2.6%) | 23 (1.6%) |
| $25,000 to $29,999 | 108 (7.2%) | 102 (7.3%) |
| $30,000 to $34,999 | 61 (4.1%) | 119 (8.5%) |
| $35,000 to $39,999 | 137 (9.1%) | 87 (6.2%) |
| $40,000 to $44,999 | 101 (6.7%) | 131 (9.3%) |
| $45,000 to $49,999 | 106 (7.0%) | 100 (7.1%) |
| $50,000 to $54,999 | 79 (5.2%) | 73 (5.2%) |
| $55,000 to $64,999 | 84 (5.6%) | 153 (10.9%) |
| $65,000 to $74,999 | 112 (7.4%) | 22 (1.6%) |
| $75,000 to $99,999 | 160 (10.6%) | 64 (4.6%) |
| $100,000+ | 155 (10.3%) | 10 (0.7%) |
| Total | 1,504 (100.0%) | 1,402 (100.0%) |
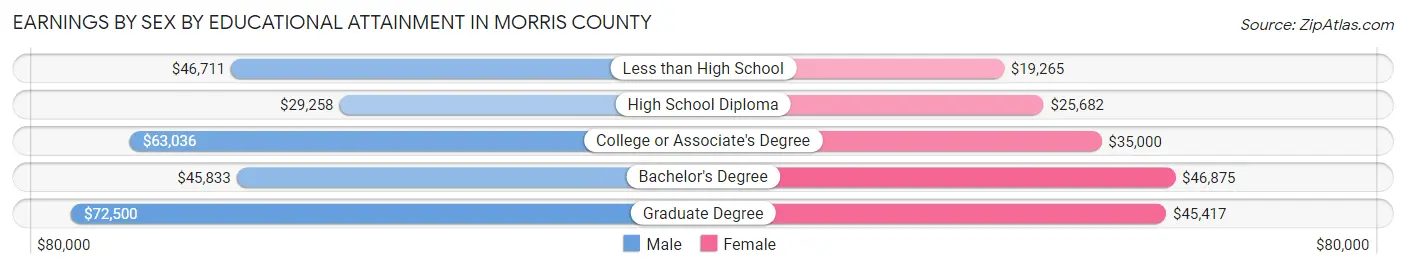
Earnings by Sex by Educational Attainment in Morris County
Average earnings in Morris County are $45,615 for men and $34,239 for women, a difference of 24.9%. Men with an educational attainment of graduate degree enjoy the highest average annual earnings of $72,500, while those with high school diploma education earn the least with $29,258. Women with an educational attainment of bachelor's degree earn the most with the average annual earnings of $46,875, while those with less than high school education have the smallest earnings of $19,265.
| Educational Attainment | Male Income | Female Income |
| Less than High School | $46,711 | $19,265 |
| High School Diploma | $29,258 | $25,682 |
| College or Associate's Degree | $63,036 | $35,000 |
| Bachelor's Degree | $45,833 | $46,875 |
| Graduate Degree | $72,500 | $45,417 |
| Total | $45,615 | $34,239 |
Family Income in Morris County
Family Income Brackets in Morris County
According to the Morris County family income data, there are 290 families falling into the $100,000 to $149,999 income range, which is the most common income bracket and makes up 19.7% of all families. Conversely, the $10,000 to $14,999 income bracket is the least frequent group with only 6 families (0.4%) belonging to this category.
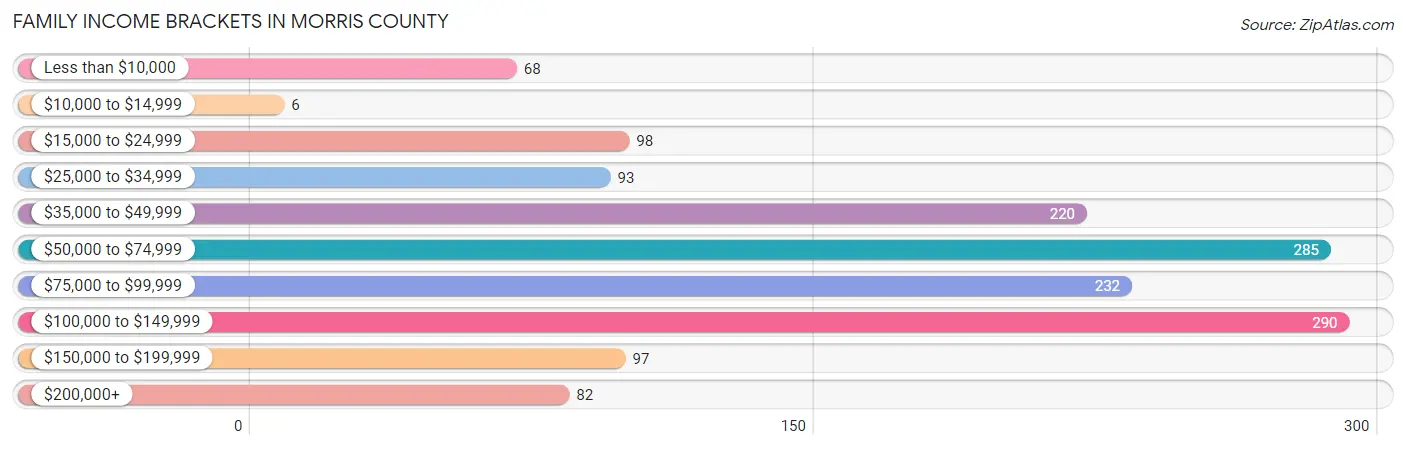
| Income Bracket | # Families | % Families |
| Less than $10,000 | 68 | 4.6% |
| $10,000 to $14,999 | 6 | 0.4% |
| $15,000 to $24,999 | 98 | 6.7% |
| $25,000 to $34,999 | 93 | 6.3% |
| $35,000 to $49,999 | 220 | 15.0% |
| $50,000 to $74,999 | 285 | 19.4% |
| $75,000 to $99,999 | 232 | 15.8% |
| $100,000 to $149,999 | 290 | 19.7% |
| $150,000 to $199,999 | 97 | 6.6% |
| $200,000+ | 82 | 5.6% |
Family Income by Famaliy Size in Morris County
5-person families (92 | 6.3%) account for the highest median family income in Morris County with $131,429 per family, while 2-person families (946 | 64.3%) have the highest median income of $32,692 per family member.
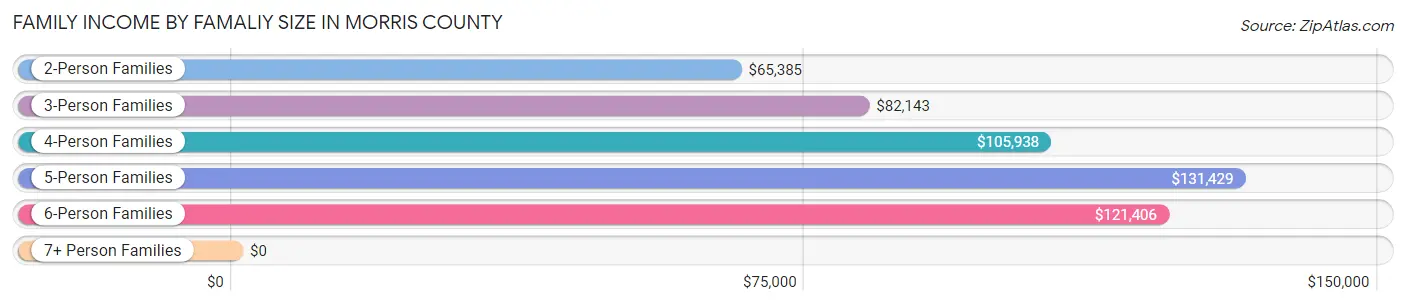
| Income Bracket | # Families | Median Income |
| 2-Person Families | 946 (64.3%) | $65,385 |
| 3-Person Families | 236 (16.1%) | $82,143 |
| 4-Person Families | 159 (10.8%) | $105,938 |
| 5-Person Families | 92 (6.3%) | $131,429 |
| 6-Person Families | 23 (1.6%) | $121,406 |
| 7+ Person Families | 14 (0.9%) | $0 |
| Total | 1,470 (100.0%) | $71,776 |
Family Income by Number of Earners in Morris County
The median family income in Morris County is $71,776, with families comprising 3+ earners (113) having the highest median family income of $124,821, while families with no earners (298) have the lowest median family income of $28,690, accounting for 7.7% and 20.3% of families, respectively.
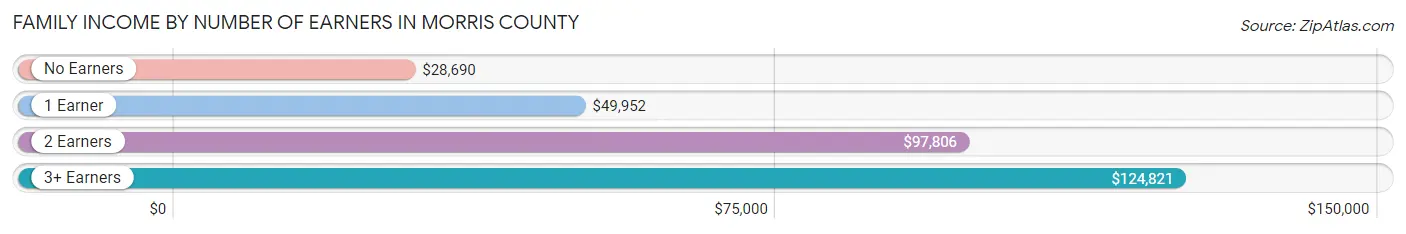
| Number of Earners | # Families | Median Income |
| No Earners | 298 (20.3%) | $28,690 |
| 1 Earner | 345 (23.5%) | $49,952 |
| 2 Earners | 714 (48.6%) | $97,806 |
| 3+ Earners | 113 (7.7%) | $124,821 |
| Total | 1,470 (100.0%) | $71,776 |
Household Income in Morris County
Household Income Brackets in Morris County
With 419 households falling in the category, the $50,000 to $74,999 income range is the most frequent in Morris County, accounting for 18.3% of all households. In contrast, only 76 households (3.3%) fall into the $10,000 to $14,999 income bracket, making it the least populous group.
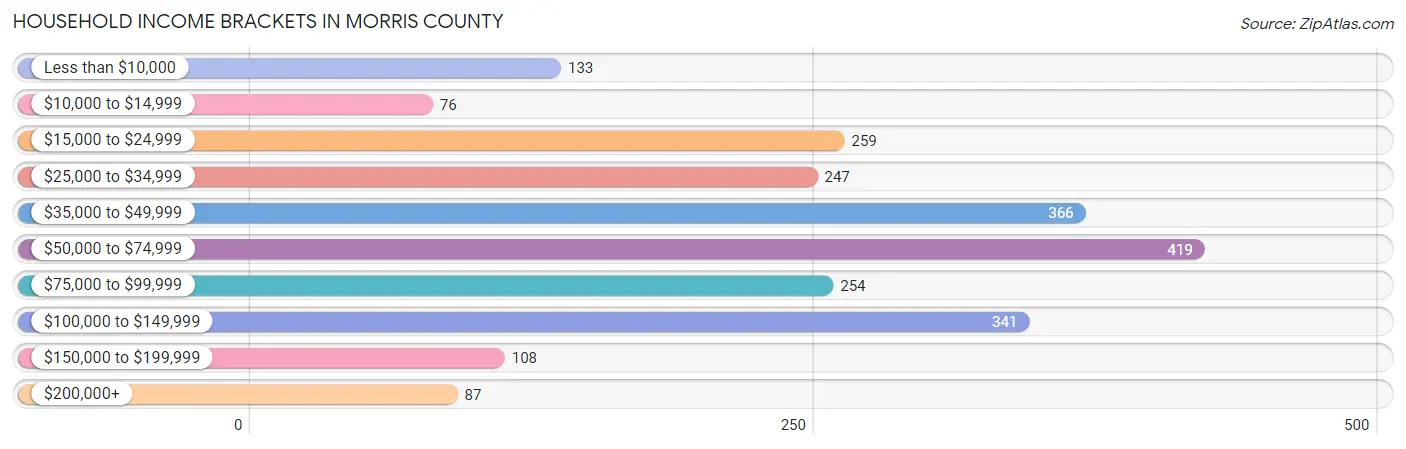
| Income Bracket | # Households | % Households |
| Less than $10,000 | 133 | 5.8% |
| $10,000 to $14,999 | 76 | 3.3% |
| $15,000 to $24,999 | 259 | 11.3% |
| $25,000 to $34,999 | 247 | 10.8% |
| $35,000 to $49,999 | 366 | 16.0% |
| $50,000 to $74,999 | 419 | 18.3% |
| $75,000 to $99,999 | 254 | 11.1% |
| $100,000 to $149,999 | 341 | 14.9% |
| $150,000 to $199,999 | 108 | 4.7% |
| $200,000+ | 87 | 3.8% |
Household Income by Householder Age in Morris County
The median household income in Morris County is $52,866, with the highest median household income of $70,685 found in the 45 to 64 years age bracket for the primary householder. A total of 831 households (36.3%) fall into this category. Meanwhile, the 15 to 24 years age bracket for the primary householder has the lowest median household income of $0, with 67 households (2.9%) in this group.
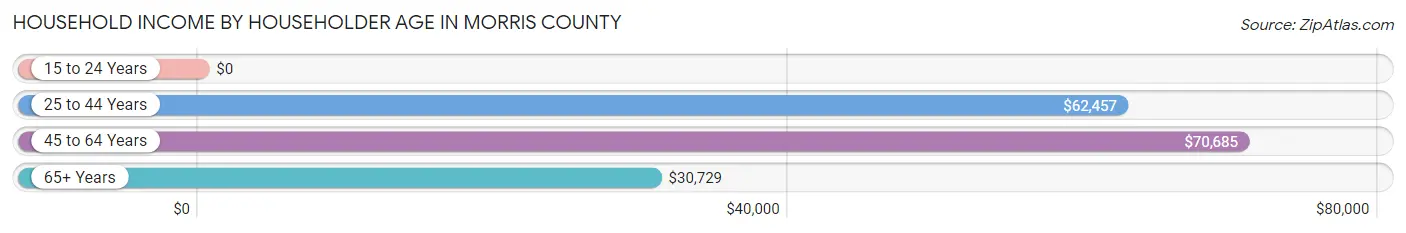
| Income Bracket | # Households | Median Income |
| 15 to 24 Years | 67 (2.9%) | $0 |
| 25 to 44 Years | 501 (21.9%) | $62,457 |
| 45 to 64 Years | 831 (36.3%) | $70,685 |
| 65+ Years | 889 (38.9%) | $30,729 |
| Total | 2,288 (100.0%) | $52,866 |
Poverty in Morris County
Income Below Poverty by Sex and Age in Morris County
With 10.5% poverty level for males and 11.5% for females among the residents of Morris County, 75 year old and over males and 5 year old females are the most vulnerable to poverty, with 70 males (28.6%) and 9 females (39.1%) in their respective age groups living below the poverty level.
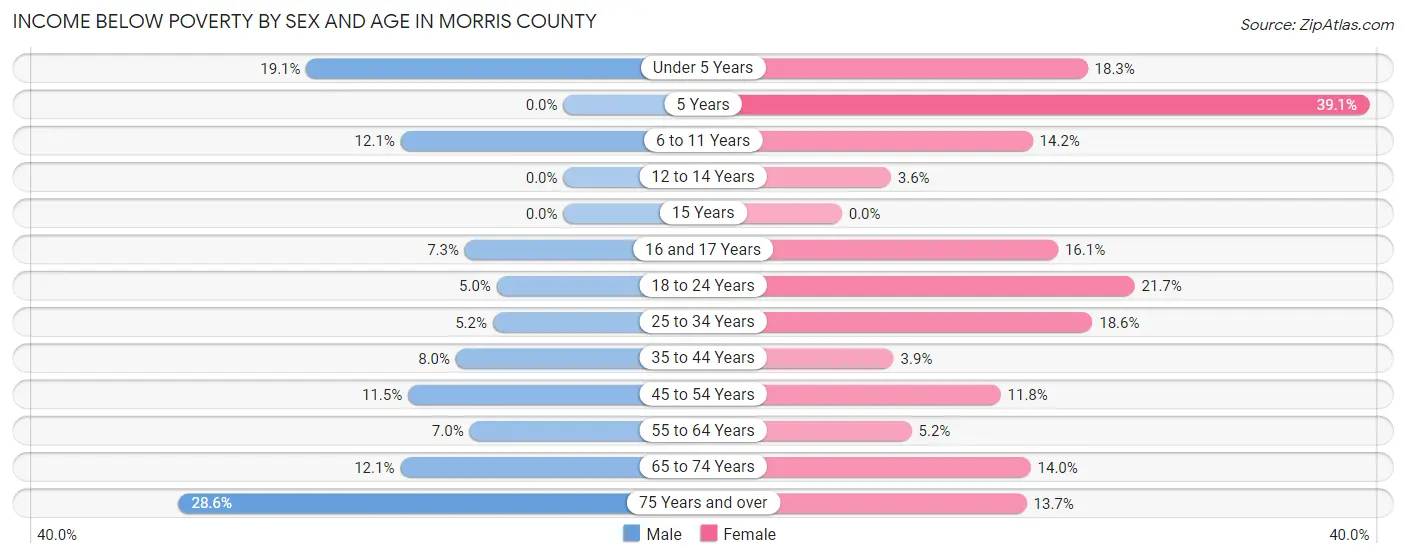
| Age Bracket | Male | Female |
| Under 5 Years | 25 (19.1%) | 23 (18.2%) |
| 5 Years | 0 (0.0%) | 9 (39.1%) |
| 6 to 11 Years | 36 (12.1%) | 18 (14.2%) |
| 12 to 14 Years | 0 (0.0%) | 4 (3.6%) |
| 15 Years | 0 (0.0%) | 0 (0.0%) |
| 16 and 17 Years | 3 (7.3%) | 13 (16.1%) |
| 18 to 24 Years | 9 (5.0%) | 30 (21.7%) |
| 25 to 34 Years | 14 (5.2%) | 32 (18.6%) |
| 35 to 44 Years | 26 (8.0%) | 13 (3.8%) |
| 45 to 54 Years | 34 (11.5%) | 31 (11.8%) |
| 55 to 64 Years | 29 (7.0%) | 23 (5.2%) |
| 65 to 74 Years | 43 (12.1%) | 52 (14.0%) |
| 75 Years and over | 70 (28.6%) | 45 (13.7%) |
| Total | 289 (10.5%) | 293 (11.5%) |
Income Above Poverty by Sex and Age in Morris County
According to the poverty statistics in Morris County, males aged 5 years and females aged 15 years are the age groups that are most secure financially, with 100.0% of males and 100.0% of females in these age groups living above the poverty line.
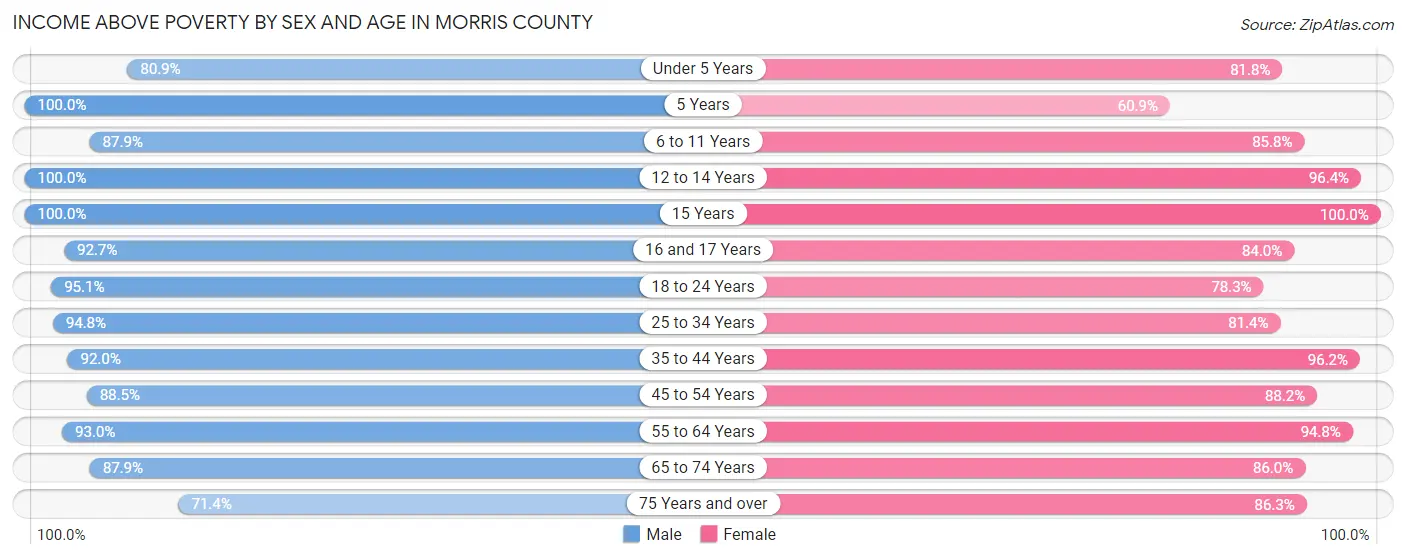
| Age Bracket | Male | Female |
| Under 5 Years | 106 (80.9%) | 103 (81.8%) |
| 5 Years | 49 (100.0%) | 14 (60.9%) |
| 6 to 11 Years | 262 (87.9%) | 109 (85.8%) |
| 12 to 14 Years | 135 (100.0%) | 106 (96.4%) |
| 15 Years | 18 (100.0%) | 23 (100.0%) |
| 16 and 17 Years | 38 (92.7%) | 68 (84.0%) |
| 18 to 24 Years | 173 (95.1%) | 108 (78.3%) |
| 25 to 34 Years | 253 (94.8%) | 140 (81.4%) |
| 35 to 44 Years | 300 (92.0%) | 325 (96.2%) |
| 45 to 54 Years | 261 (88.5%) | 232 (88.2%) |
| 55 to 64 Years | 387 (93.0%) | 421 (94.8%) |
| 65 to 74 Years | 312 (87.9%) | 319 (86.0%) |
| 75 Years and over | 175 (71.4%) | 283 (86.3%) |
| Total | 2,469 (89.5%) | 2,251 (88.5%) |
Income Below Poverty Among Married-Couple Families in Morris County
The poverty statistics for married-couple families in Morris County show that 10.4% or 128 of the total 1,236 families live below the poverty line. Families with 5 or more children have the highest poverty rate of 100.0%, comprising of 6 families. On the other hand, families with 3 or 4 children have the lowest poverty rate of 0.0%, which includes 0 families.
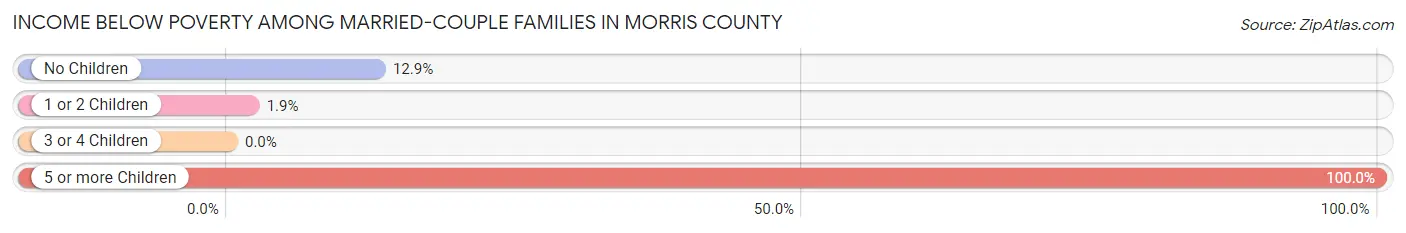
| Children | Above Poverty | Below Poverty |
| No Children | 798 (87.1%) | 118 (12.9%) |
| 1 or 2 Children | 208 (98.1%) | 4 (1.9%) |
| 3 or 4 Children | 102 (100.0%) | 0 (0.0%) |
| 5 or more Children | 0 (0.0%) | 6 (100.0%) |
| Total | 1,108 (89.6%) | 128 (10.4%) |
Income Below Poverty Among Single-Parent Households in Morris County
According to the poverty data in Morris County, 6.9% or 4 single-father households and 14.2% or 25 single-mother households are living below the poverty line. Among single-father households, those with 1 or 2 children have the highest poverty rate, with 4 households (12.1%) experiencing poverty. Likewise, among single-mother households, those with 3 or 4 children have the highest poverty rate, with 22 households (78.6%) falling below the poverty line.
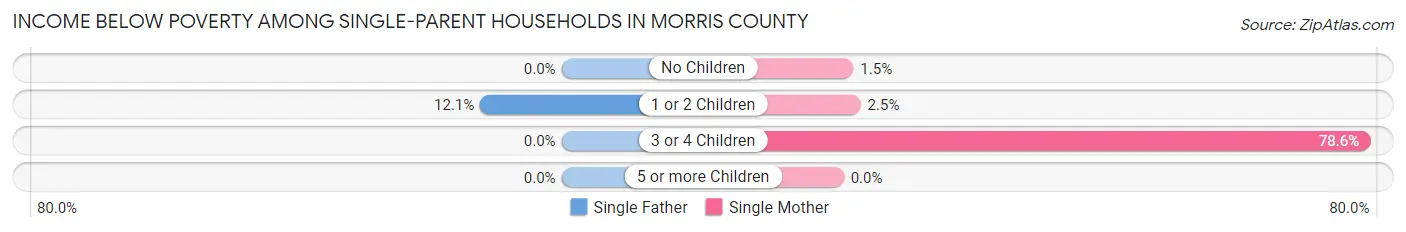
| Children | Single Father | Single Mother |
| No Children | 0 (0.0%) | 1 (1.5%) |
| 1 or 2 Children | 4 (12.1%) | 2 (2.5%) |
| 3 or 4 Children | 0 (0.0%) | 22 (78.6%) |
| 5 or more Children | 0 (0.0%) | 0 (0.0%) |
| Total | 4 (6.9%) | 25 (14.2%) |
Income Below Poverty Among Married-Couple vs Single-Parent Households in Morris County
The poverty data for Morris County shows that 128 of the married-couple family households (10.4%) and 29 of the single-parent households (12.4%) are living below the poverty level. Within the married-couple family households, those with 5 or more children have the highest poverty rate, with 6 households (100.0%) falling below the poverty line. Among the single-parent households, those with 3 or 4 children have the highest poverty rate, with 22 household (73.3%) living below poverty.
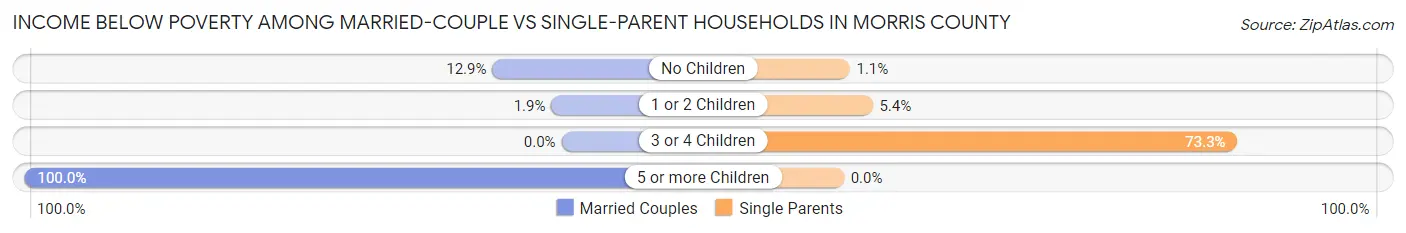
| Children | Married-Couple Families | Single-Parent Households |
| No Children | 118 (12.9%) | 1 (1.1%) |
| 1 or 2 Children | 4 (1.9%) | 6 (5.4%) |
| 3 or 4 Children | 0 (0.0%) | 22 (73.3%) |
| 5 or more Children | 6 (100.0%) | 0 (0.0%) |
| Total | 128 (10.4%) | 29 (12.4%) |
Race in Morris County
The most populous races in Morris County are White / Caucasian (5,039 | 93.6%), Hispanic or Latino (302 | 5.6%), and Two or more Races (249 | 4.6%).
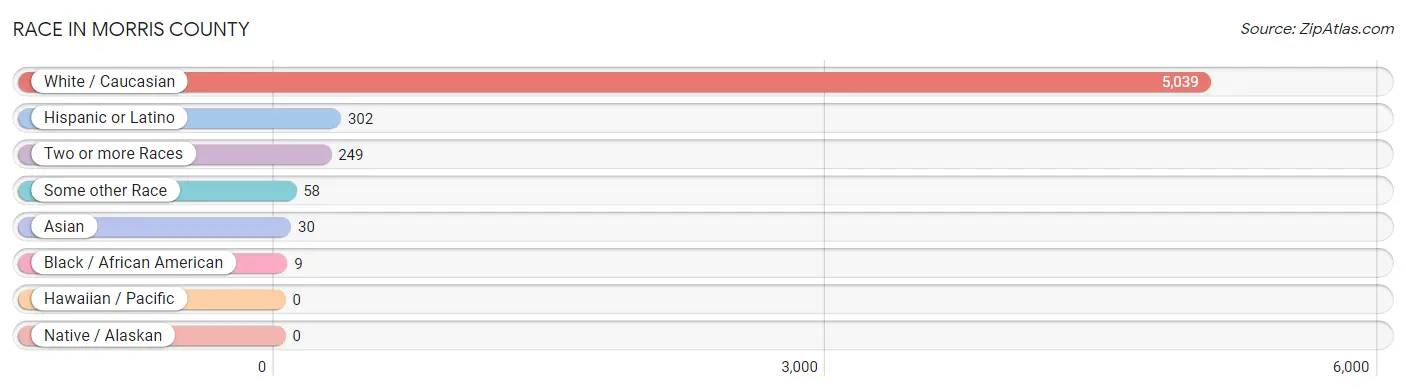
| Race | # Population | % Population |
| Asian | 30 | 0.6% |
| Black / African American | 9 | 0.2% |
| Hawaiian / Pacific | 0 | 0.0% |
| Hispanic or Latino | 302 | 5.6% |
| Native / Alaskan | 0 | 0.0% |
| White / Caucasian | 5,039 | 93.6% |
| Two or more Races | 249 | 4.6% |
| Some other Race | 58 | 1.1% |
| Total | 5,385 | 100.0% |
Ancestry in Morris County
The most populous ancestries reported in Morris County are German (1,611 | 29.9%), Irish (632 | 11.7%), English (612 | 11.4%), American (511 | 9.5%), and Swedish (266 | 4.9%), together accounting for 67.4% of all Morris County residents.
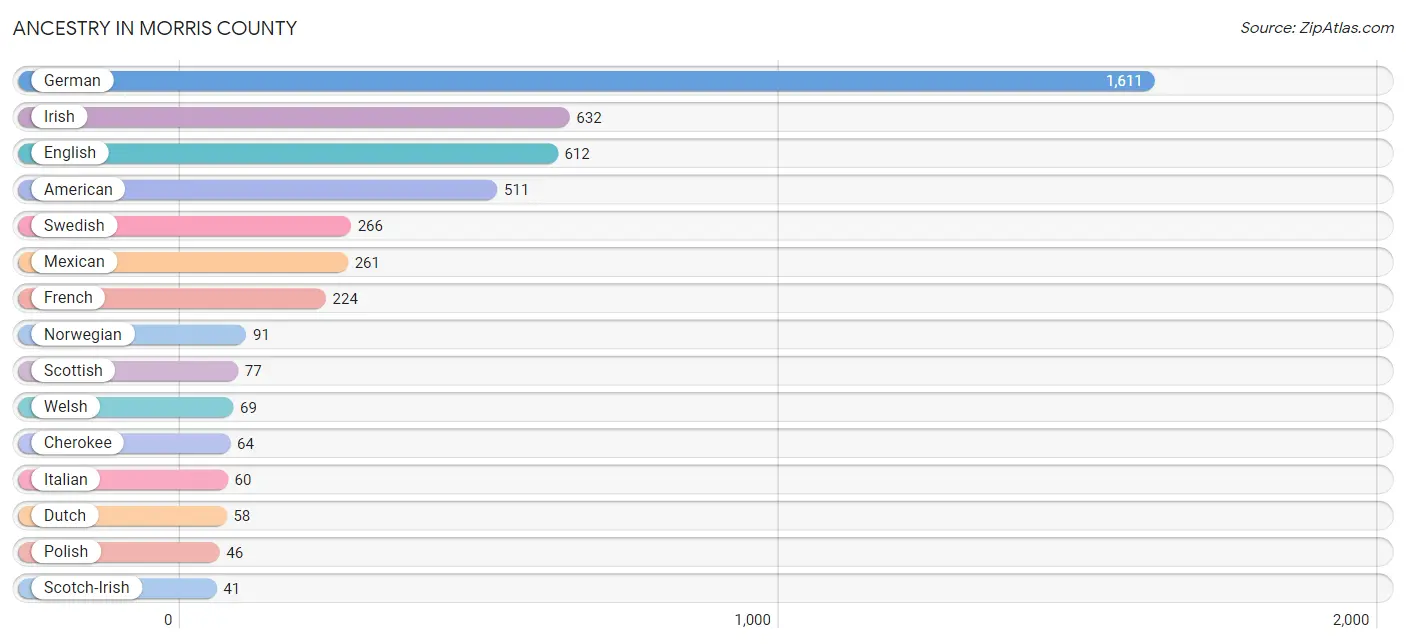
| Ancestry | # Population | % Population |
| African | 1 | 0.0% |
| American | 511 | 9.5% |
| Austrian | 16 | 0.3% |
| Bhutanese | 3 | 0.1% |
| Blackfeet | 18 | 0.3% |
| British | 16 | 0.3% |
| Burmese | 11 | 0.2% |
| Cherokee | 64 | 1.2% |
| Croatian | 6 | 0.1% |
| Czech | 33 | 0.6% |
| Czechoslovakian | 2 | 0.0% |
| Danish | 21 | 0.4% |
| Dutch | 58 | 1.1% |
| English | 612 | 11.4% |
| European | 32 | 0.6% |
| Finnish | 40 | 0.7% |
| French | 224 | 4.2% |
| French Canadian | 21 | 0.4% |
| German | 1,611 | 29.9% |
| German Russian | 6 | 0.1% |
| Hungarian | 1 | 0.0% |
| Irish | 632 | 11.7% |
| Italian | 60 | 1.1% |
| Mexican | 261 | 4.9% |
| Navajo | 16 | 0.3% |
| Northern European | 6 | 0.1% |
| Norwegian | 91 | 1.7% |
| Pennsylvania German | 3 | 0.1% |
| Polish | 46 | 0.9% |
| Portuguese | 7 | 0.1% |
| Puerto Rican | 7 | 0.1% |
| Russian | 3 | 0.1% |
| Scotch-Irish | 41 | 0.8% |
| Scottish | 77 | 1.4% |
| Spaniard | 6 | 0.1% |
| Spanish | 28 | 0.5% |
| Sri Lankan | 19 | 0.4% |
| Subsaharan African | 1 | 0.0% |
| Swedish | 266 | 4.9% |
| Swiss | 33 | 0.6% |
| Welsh | 69 | 1.3% | View All 41 Rows |
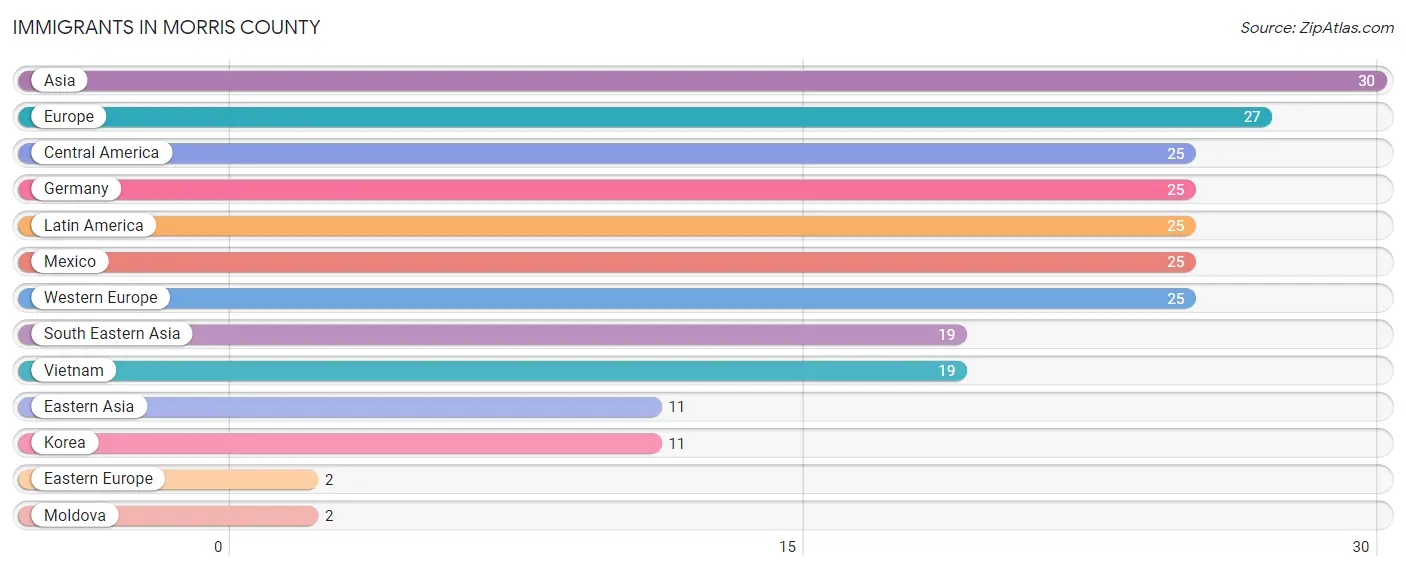
Immigrants in Morris County
The most numerous immigrant groups reported in Morris County came from Asia (30 | 0.6%), Europe (27 | 0.5%), Central America (25 | 0.5%), Germany (25 | 0.5%), and Latin America (25 | 0.5%), together accounting for 2.4% of all Morris County residents.
| Immigration Origin | # Population | % Population |
| Asia | 30 | 0.6% |
| Central America | 25 | 0.5% |
| Eastern Asia | 11 | 0.2% |
| Eastern Europe | 2 | 0.0% |
| Europe | 27 | 0.5% |
| Germany | 25 | 0.5% |
| Korea | 11 | 0.2% |
| Latin America | 25 | 0.5% |
| Mexico | 25 | 0.5% |
| Moldova | 2 | 0.0% |
| South Eastern Asia | 19 | 0.4% |
| Vietnam | 19 | 0.4% |
| Western Europe | 25 | 0.5% | View All 13 Rows |
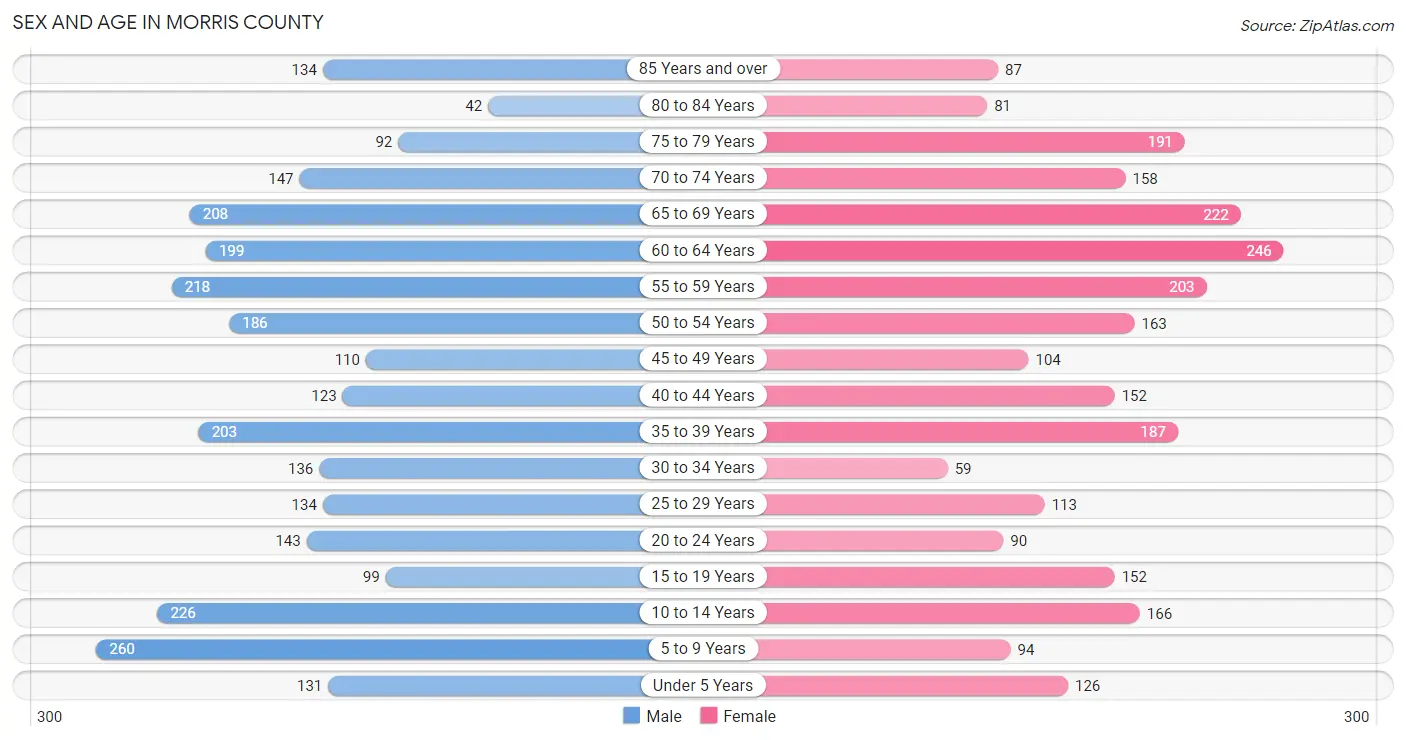
Sex and Age in Morris County
Sex and Age in Morris County
The most populous age groups in Morris County are 5 to 9 Years (260 | 9.3%) for men and 60 to 64 Years (246 | 9.5%) for women.
| Age Bracket | Male | Female |
| Under 5 Years | 131 (4.7%) | 126 (4.9%) |
| 5 to 9 Years | 260 (9.3%) | 94 (3.6%) |
| 10 to 14 Years | 226 (8.1%) | 166 (6.4%) |
| 15 to 19 Years | 99 (3.5%) | 152 (5.9%) |
| 20 to 24 Years | 143 (5.1%) | 90 (3.5%) |
| 25 to 29 Years | 134 (4.8%) | 113 (4.4%) |
| 30 to 34 Years | 136 (4.9%) | 59 (2.3%) |
| 35 to 39 Years | 203 (7.3%) | 187 (7.2%) |
| 40 to 44 Years | 123 (4.4%) | 152 (5.9%) |
| 45 to 49 Years | 110 (3.9%) | 104 (4.0%) |
| 50 to 54 Years | 186 (6.7%) | 163 (6.3%) |
| 55 to 59 Years | 218 (7.8%) | 203 (7.8%) |
| 60 to 64 Years | 199 (7.1%) | 246 (9.5%) |
| 65 to 69 Years | 208 (7.4%) | 222 (8.6%) |
| 70 to 74 Years | 147 (5.3%) | 158 (6.1%) |
| 75 to 79 Years | 92 (3.3%) | 191 (7.4%) |
| 80 to 84 Years | 42 (1.5%) | 81 (3.1%) |
| 85 Years and over | 134 (4.8%) | 87 (3.4%) |
| Total | 2,791 (100.0%) | 2,594 (100.0%) |
Families and Households in Morris County
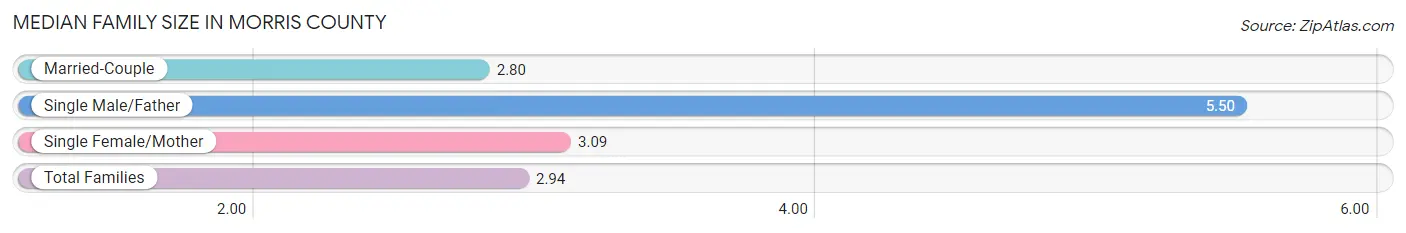
Median Family Size in Morris County
The median family size in Morris County is 2.94 persons per family, with single male/father families (58 | 4.0%) accounting for the largest median family size of 5.5 persons per family. On the other hand, married-couple families (1,236 | 84.1%) represent the smallest median family size with 2.80 persons per family.
| Family Type | # Families | Family Size |
| Married-Couple | 1,236 (84.1%) | 2.80 |
| Single Male/Father | 58 (4.0%) | 5.50 |
| Single Female/Mother | 176 (12.0%) | 3.09 |
| Total Families | 1,470 (100.0%) | 2.94 |
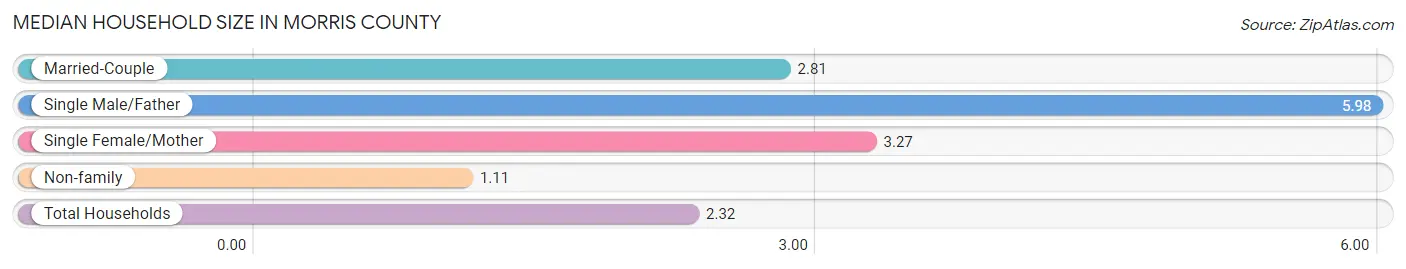
Median Household Size in Morris County
The median household size in Morris County is 2.32 persons per household, with single male/father households (58 | 2.5%) accounting for the largest median household size of 5.98 persons per household. non-family households (818 | 35.7%) represent the smallest median household size with 1.11 persons per household.
| Household Type | # Households | Household Size |
| Married-Couple | 1,236 (54.0%) | 2.81 |
| Single Male/Father | 58 (2.5%) | 5.98 |
| Single Female/Mother | 176 (7.7%) | 3.27 |
| Non-family | 818 (35.7%) | 1.11 |
| Total Households | 2,288 (100.0%) | 2.32 |
Household Size by Marriage Status in Morris County
Out of a total of 2,288 households in Morris County, 1,470 (64.2%) are family households, while 818 (35.7%) are nonfamily households. The most numerous type of family households are 2-person households, comprising 928, and the most common type of nonfamily households are 1-person households, comprising 745.
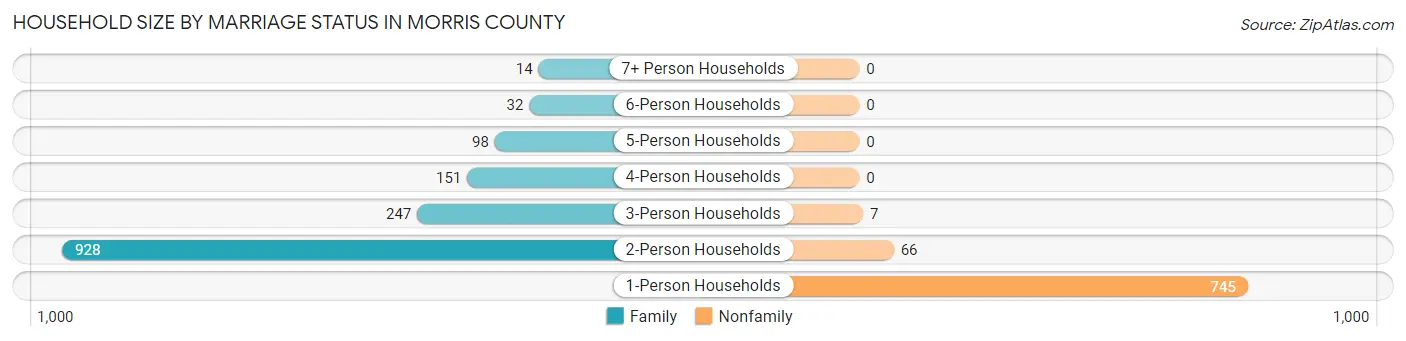
| Household Size | Family Households | Nonfamily Households |
| 1-Person Households | - | 745 (32.6%) |
| 2-Person Households | 928 (40.6%) | 66 (2.9%) |
| 3-Person Households | 247 (10.8%) | 7 (0.3%) |
| 4-Person Households | 151 (6.6%) | 0 (0.0%) |
| 5-Person Households | 98 (4.3%) | 0 (0.0%) |
| 6-Person Households | 32 (1.4%) | 0 (0.0%) |
| 7+ Person Households | 14 (0.6%) | 0 (0.0%) |
| Total | 1,470 (64.2%) | 818 (35.7%) |
Female Fertility in Morris County
Fertility by Age in Morris County
Average fertility rate in Morris County is 37.0 births per 1,000 women. Women in the age bracket of 20 to 34 years have the highest fertility rate with 53.0 births per 1,000 women. Women in the age bracket of 35 to 50 years acount for 57.6% of all women with births.
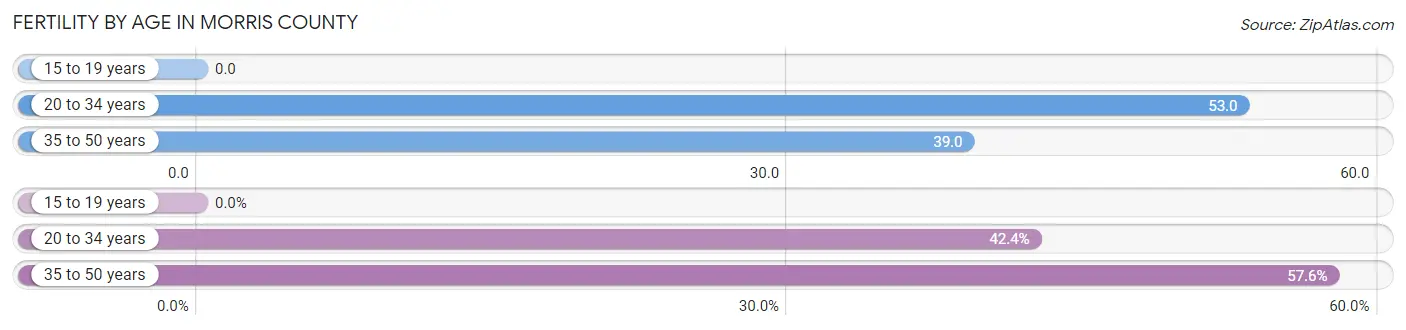
| Age Bracket | Women with Births | Births / 1,000 Women |
| 15 to 19 years | 0 (0.0%) | 0.0 |
| 20 to 34 years | 14 (42.4%) | 53.0 |
| 35 to 50 years | 19 (57.6%) | 39.0 |
| Total | 33 (100.0%) | 37.0 |
Fertility by Age by Marriage Status in Morris County
93.9% of women with births (33) in Morris County are married. The highest percentage of unmarried women with births falls into 20 to 34 years age bracket with 14.3% of them unmarried at the time of birth, while the lowest percentage of unmarried women with births belong to 35 to 50 years age bracket with 0.0% of them unmarried.
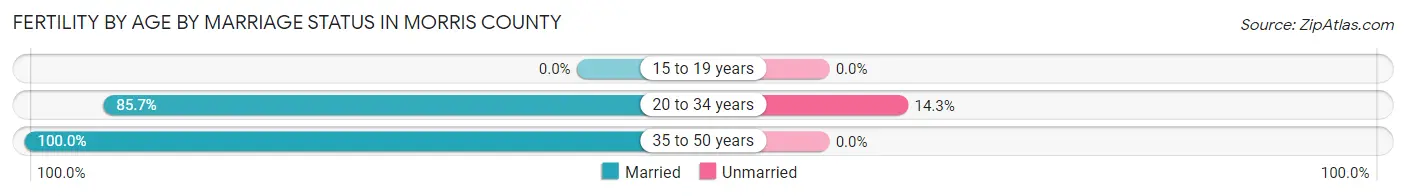
| Age Bracket | Married | Unmarried |
| 15 to 19 years | 0 (0.0%) | 0 (0.0%) |
| 20 to 34 years | 12 (85.7%) | 2 (14.3%) |
| 35 to 50 years | 19 (100.0%) | 0 (0.0%) |
| Total | 31 (93.9%) | 2 (6.1%) |
Fertility by Education in Morris County
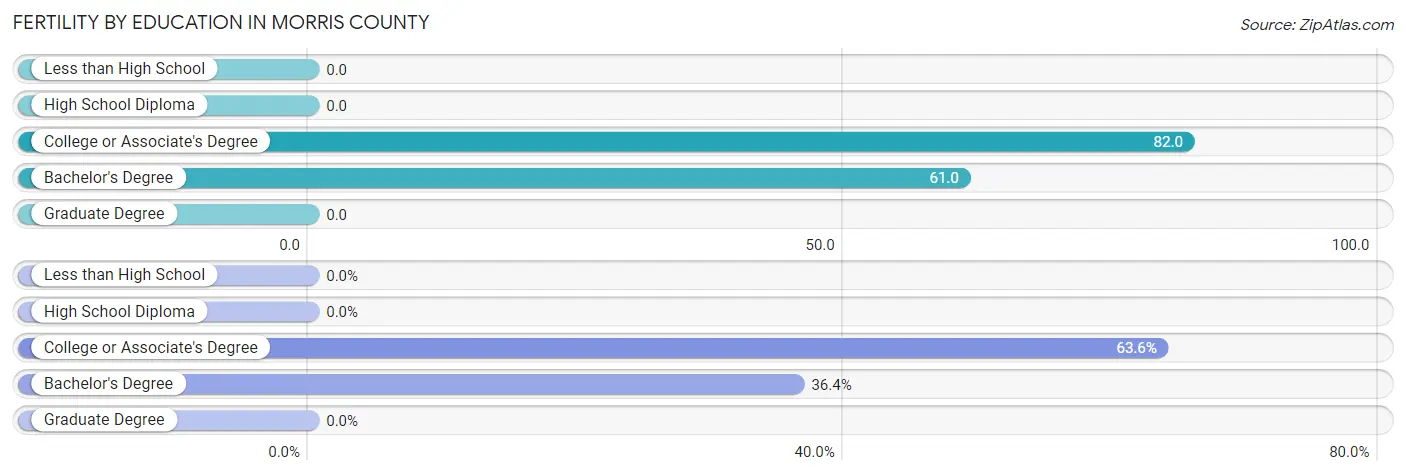
| Educational Attainment | Women with Births | Births / 1,000 Women |
| Less than High School | 0 (0.0%) | 0.0 |
| High School Diploma | 0 (0.0%) | 0.0 |
| College or Associate's Degree | 21 (63.6%) | 82.0 |
| Bachelor's Degree | 12 (36.4%) | 61.0 |
| Graduate Degree | 0 (0.0%) | 0.0 |
| Total | 33 (100.0%) | 37.0 |
Fertility by Education by Marriage Status in Morris County
6.1% of women with births in Morris County are unmarried. Women with the educational attainment of bachelor's degree are most likely to be married with 100.0% of them married at childbirth, while women with the educational attainment of college or associate's degree are least likely to be married with 9.5% of them unmarried at childbirth.
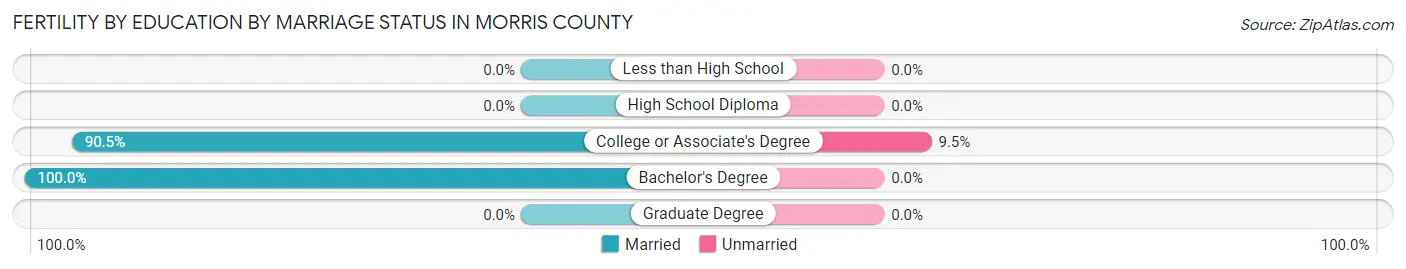
| Educational Attainment | Married | Unmarried |
| Less than High School | 0 (0.0%) | 0 (0.0%) |
| High School Diploma | 0 (0.0%) | 0 (0.0%) |
| College or Associate's Degree | 19 (90.5%) | 2 (9.5%) |
| Bachelor's Degree | 12 (100.0%) | 0 (0.0%) |
| Graduate Degree | 0 (0.0%) | 0 (0.0%) |
| Total | 31 (93.9%) | 2 (6.1%) |
Employment Characteristics in Morris County
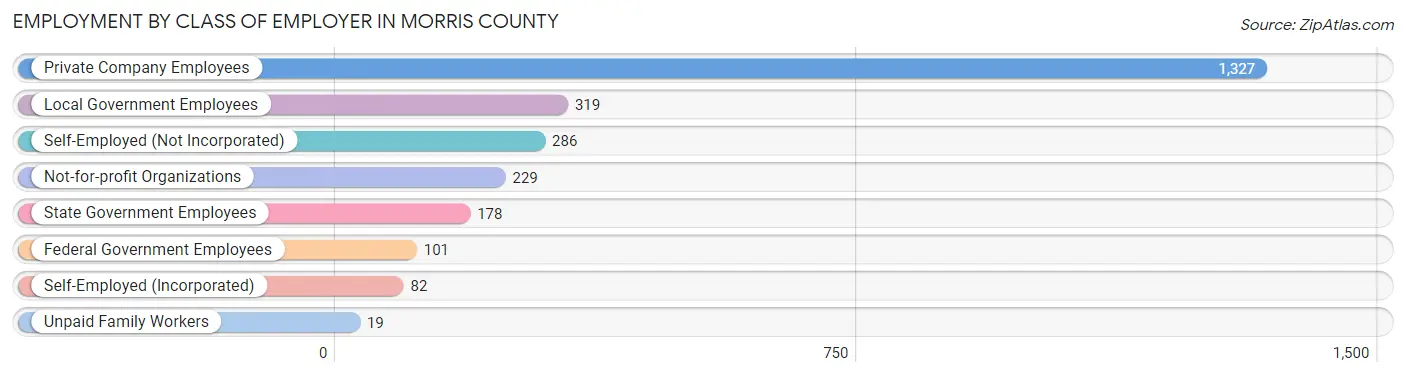
Employment by Class of Employer in Morris County
Among the 2,541 employed individuals in Morris County, private company employees (1,327 | 52.2%), local government employees (319 | 12.6%), and self-employed (not incorporated) (286 | 11.3%) make up the most common classes of employment.
| Employer Class | # Employees | % Employees |
| Private Company Employees | 1,327 | 52.2% |
| Self-Employed (Incorporated) | 82 | 3.2% |
| Self-Employed (Not Incorporated) | 286 | 11.3% |
| Not-for-profit Organizations | 229 | 9.0% |
| Local Government Employees | 319 | 12.6% |
| State Government Employees | 178 | 7.0% |
| Federal Government Employees | 101 | 4.0% |
| Unpaid Family Workers | 19 | 0.7% |
| Total | 2,541 | 100.0% |
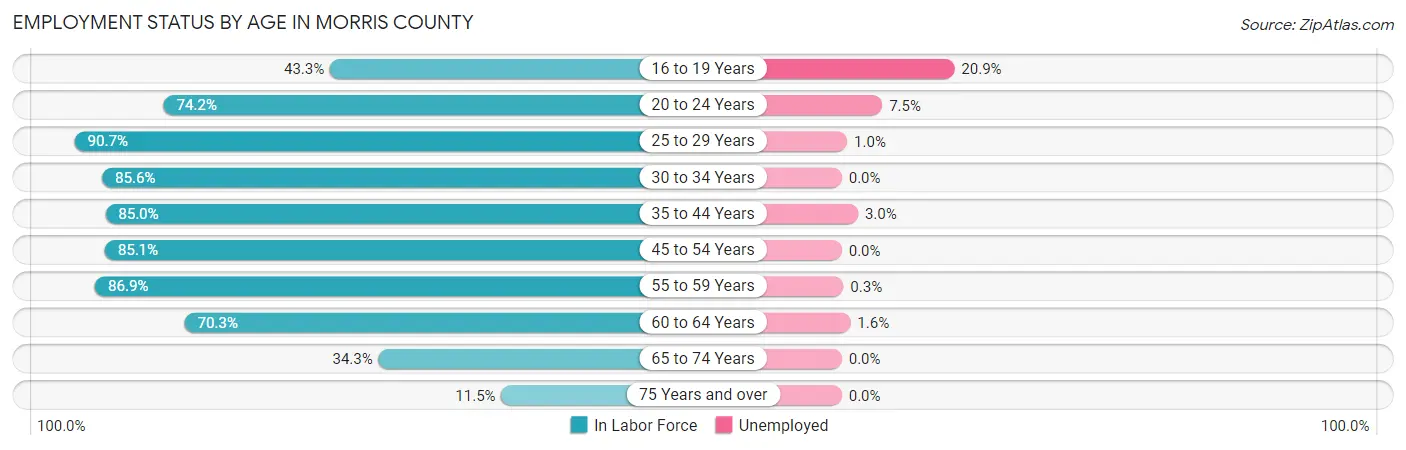
Employment Status by Age in Morris County
According to the labor force statistics for Morris County, out of the total population over 16 years of age (4,341), 62.2% or 2,700 individuals are in the labor force, with 2.1% or 57 of them unemployed. The age group with the highest labor force participation rate is 25 to 29 years, with 90.7% or 224 individuals in the labor force. Within the labor force, the 16 to 19 years age range has the highest percentage of unemployed individuals, with 20.9% or 19 of them being unemployed.
| Age Bracket | In Labor Force | Unemployed |
| 16 to 19 Years | 91 (43.3%) | 19 (20.9%) |
| 20 to 24 Years | 173 (74.2%) | 13 (7.5%) |
| 25 to 29 Years | 224 (90.7%) | 2 (1.0%) |
| 30 to 34 Years | 167 (85.6%) | 0 (0.0%) |
| 35 to 44 Years | 565 (85.0%) | 17 (3.0%) |
| 45 to 54 Years | 479 (85.1%) | 0 (0.0%) |
| 55 to 59 Years | 366 (86.9%) | 1 (0.3%) |
| 60 to 64 Years | 313 (70.3%) | 5 (1.6%) |
| 65 to 74 Years | 252 (34.3%) | 0 (0.0%) |
| 75 Years and over | 72 (11.5%) | 0 (0.0%) |
| Total | 2,700 (62.2%) | 57 (2.1%) |
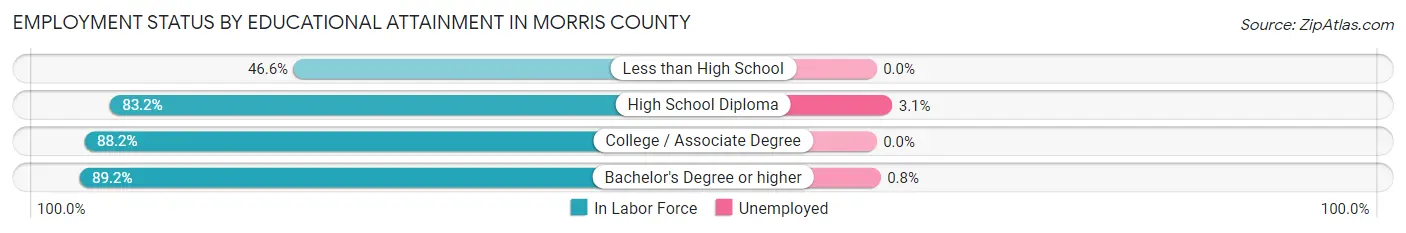
Employment Status by Educational Attainment in Morris County
According to labor force statistics for Morris County, 83.4% of individuals (2,115) out of the total population between 25 and 64 years of age (2,536) are in the labor force, with 1.2% or 25 of them being unemployed. The group with the highest labor force participation rate are those with the educational attainment of bachelor's degree or higher, with 89.2% or 675 individuals in the labor force. Within the labor force, individuals with high school diploma education have the highest percentage of unemployment, with 3.1% or 20 of them being unemployed.
| Educational Attainment | In Labor Force | Unemployed |
| Less than High School | 103 (46.6%) | 0 (0.0%) |
| High School Diploma | 641 (83.2%) | 24 (3.1%) |
| College / Associate Degree | 695 (88.2%) | 0 (0.0%) |
| Bachelor's Degree or higher | 675 (89.2%) | 6 (0.8%) |
| Total | 2,115 (83.4%) | 30 (1.2%) |
Employment Occupations by Sex in Morris County
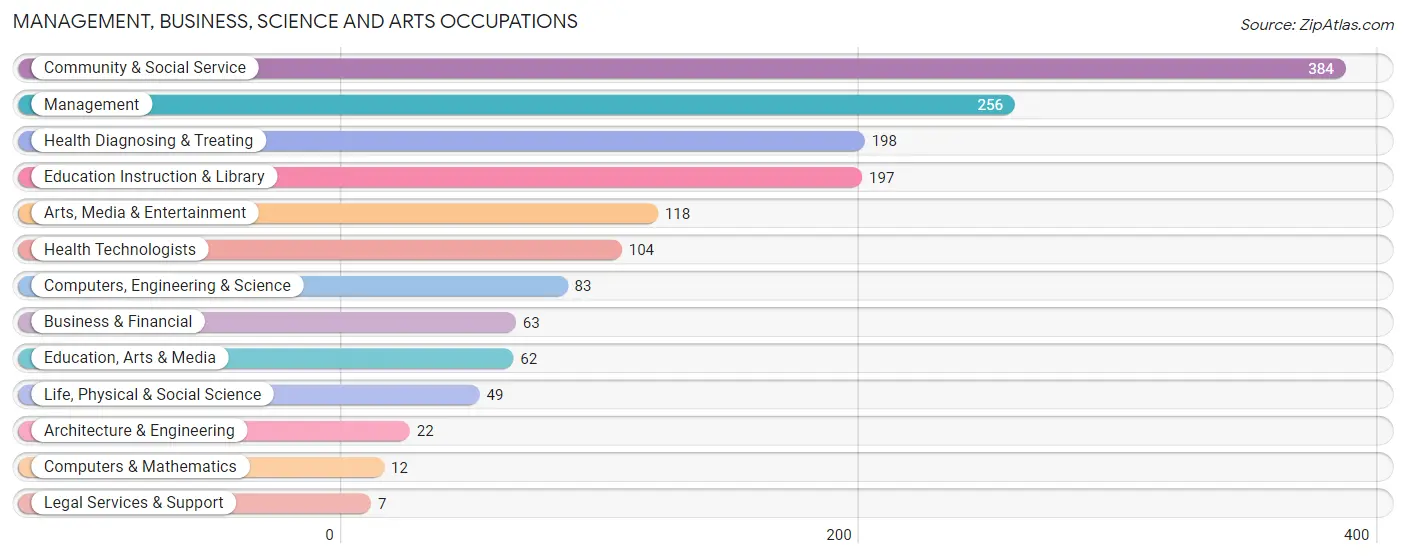
Management, Business, Science and Arts Occupations
The most common Management, Business, Science and Arts occupations in Morris County are Community & Social Service (384 | 14.6%), Management (256 | 9.8%), Health Diagnosing & Treating (198 | 7.5%), Education Instruction & Library (197 | 7.5%), and Arts, Media & Entertainment (118 | 4.5%).
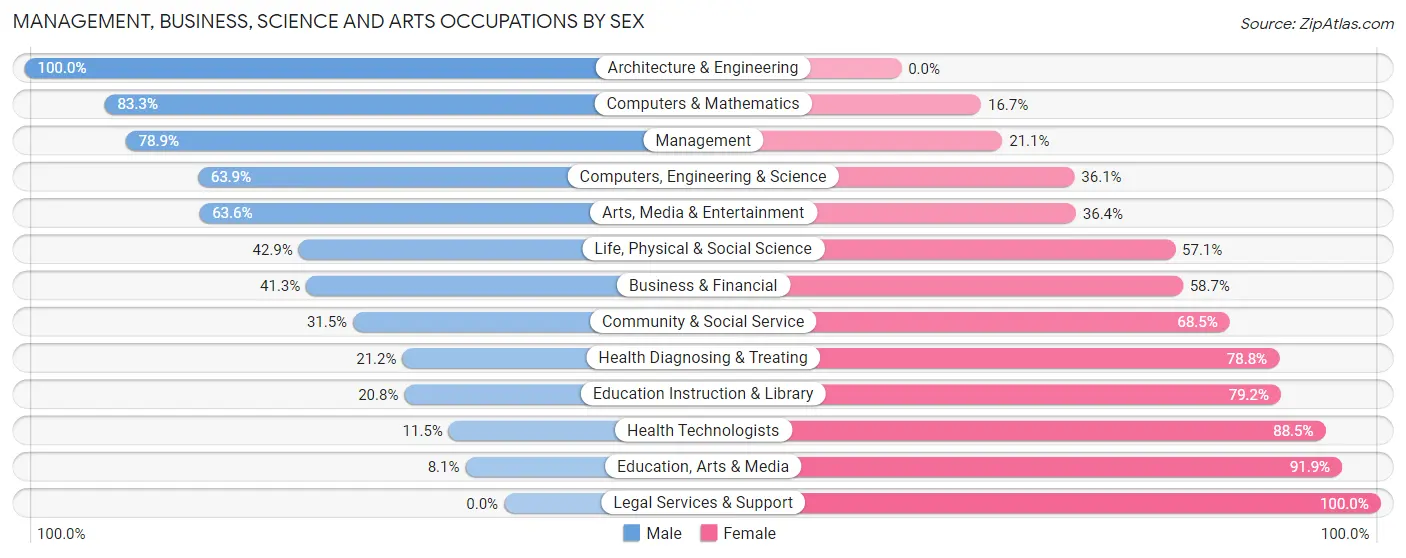
Management, Business, Science and Arts Occupations by Sex
Within the Management, Business, Science and Arts occupations in Morris County, the most male-oriented occupations are Architecture & Engineering (100.0%), Computers & Mathematics (83.3%), and Management (78.9%), while the most female-oriented occupations are Legal Services & Support (100.0%), Education, Arts & Media (91.9%), and Health Technologists (88.5%).
| Occupation | Male | Female |
| Management | 202 (78.9%) | 54 (21.1%) |
| Business & Financial | 26 (41.3%) | 37 (58.7%) |
| Computers, Engineering & Science | 53 (63.9%) | 30 (36.1%) |
| Computers & Mathematics | 10 (83.3%) | 2 (16.7%) |
| Architecture & Engineering | 22 (100.0%) | 0 (0.0%) |
| Life, Physical & Social Science | 21 (42.9%) | 28 (57.1%) |
| Community & Social Service | 121 (31.5%) | 263 (68.5%) |
| Education, Arts & Media | 5 (8.1%) | 57 (91.9%) |
| Legal Services & Support | 0 (0.0%) | 7 (100.0%) |
| Education Instruction & Library | 41 (20.8%) | 156 (79.2%) |
| Arts, Media & Entertainment | 75 (63.6%) | 43 (36.4%) |
| Health Diagnosing & Treating | 42 (21.2%) | 156 (78.8%) |
| Health Technologists | 12 (11.5%) | 92 (88.5%) |
| Total (Category) | 444 (45.1%) | 540 (54.9%) |
| Total (Overall) | 1,354 (51.6%) | 1,270 (48.4%) |
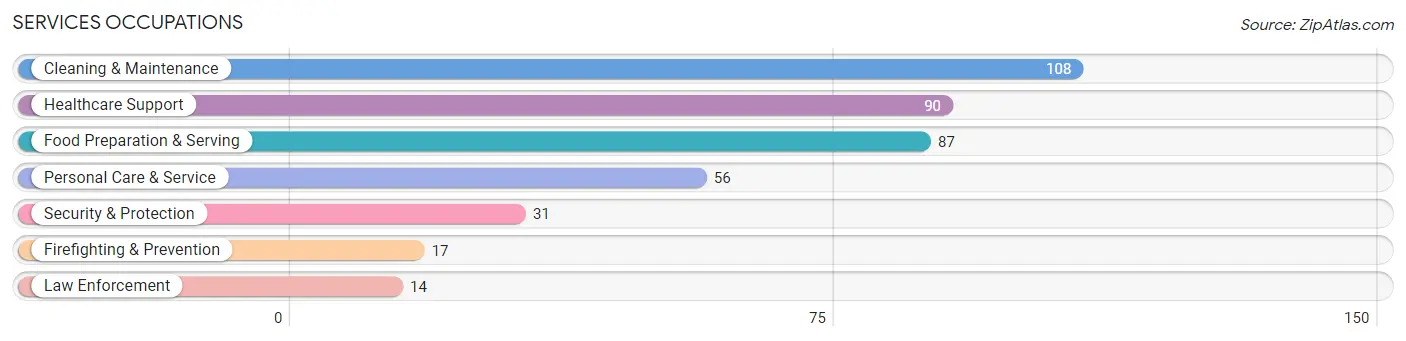
Services Occupations
The most common Services occupations in Morris County are Cleaning & Maintenance (108 | 4.1%), Healthcare Support (90 | 3.4%), Food Preparation & Serving (87 | 3.3%), Personal Care & Service (56 | 2.1%), and Security & Protection (31 | 1.2%).
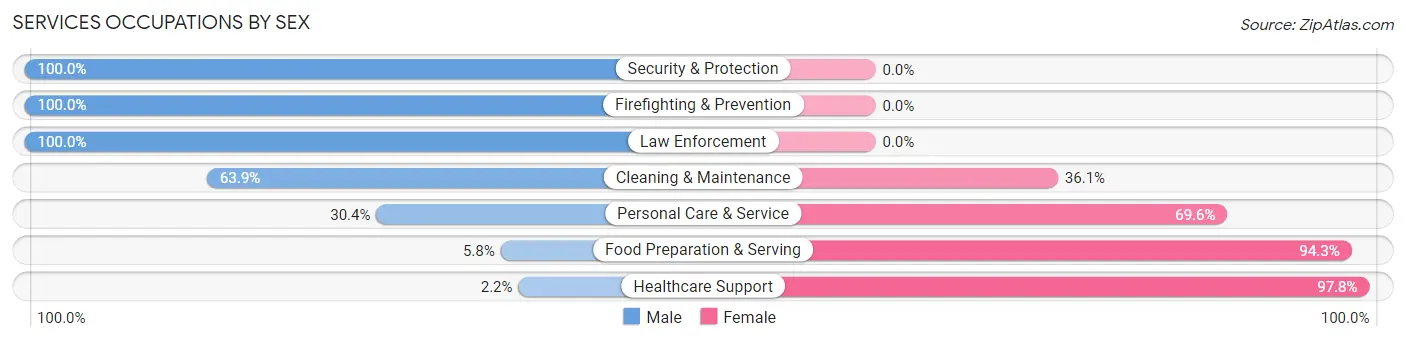
Services Occupations by Sex
Within the Services occupations in Morris County, the most male-oriented occupations are Security & Protection (100.0%), Firefighting & Prevention (100.0%), and Law Enforcement (100.0%), while the most female-oriented occupations are Healthcare Support (97.8%), Food Preparation & Serving (94.3%), and Personal Care & Service (69.6%).
| Occupation | Male | Female |
| Healthcare Support | 2 (2.2%) | 88 (97.8%) |
| Security & Protection | 31 (100.0%) | 0 (0.0%) |
| Firefighting & Prevention | 17 (100.0%) | 0 (0.0%) |
| Law Enforcement | 14 (100.0%) | 0 (0.0%) |
| Food Preparation & Serving | 5 (5.8%) | 82 (94.3%) |
| Cleaning & Maintenance | 69 (63.9%) | 39 (36.1%) |
| Personal Care & Service | 17 (30.4%) | 39 (69.6%) |
| Total (Category) | 124 (33.3%) | 248 (66.7%) |
| Total (Overall) | 1,354 (51.6%) | 1,270 (48.4%) |
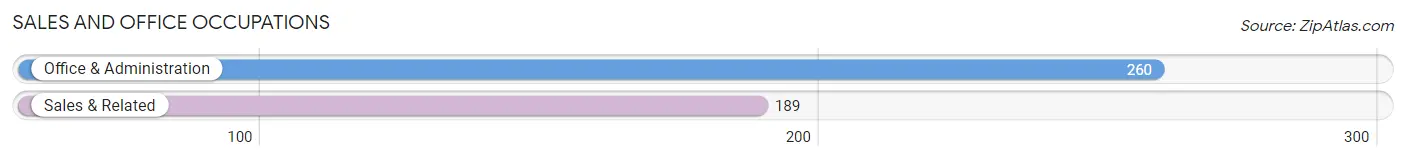
Sales and Office Occupations
The most common Sales and Office occupations in Morris County are Office & Administration (260 | 9.9%), and Sales & Related (189 | 7.2%).
Sales and Office Occupations by Sex
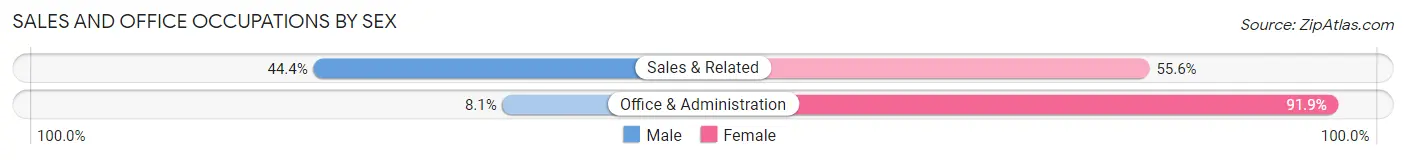
| Occupation | Male | Female |
| Sales & Related | 84 (44.4%) | 105 (55.6%) |
| Office & Administration | 21 (8.1%) | 239 (91.9%) |
| Total (Category) | 105 (23.4%) | 344 (76.6%) |
| Total (Overall) | 1,354 (51.6%) | 1,270 (48.4%) |
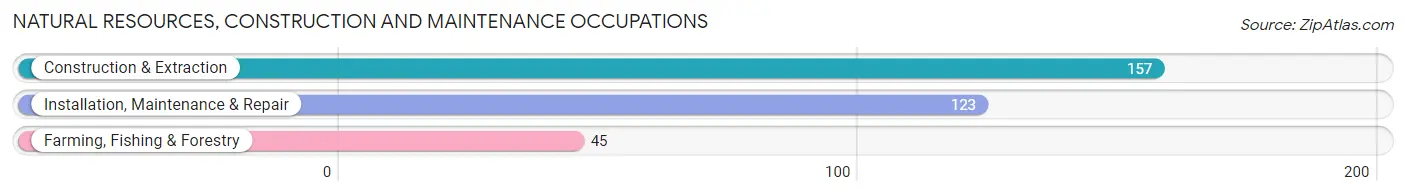
Natural Resources, Construction and Maintenance Occupations
The most common Natural Resources, Construction and Maintenance occupations in Morris County are Construction & Extraction (157 | 6.0%), Installation, Maintenance & Repair (123 | 4.7%), and Farming, Fishing & Forestry (45 | 1.7%).
Natural Resources, Construction and Maintenance Occupations by Sex
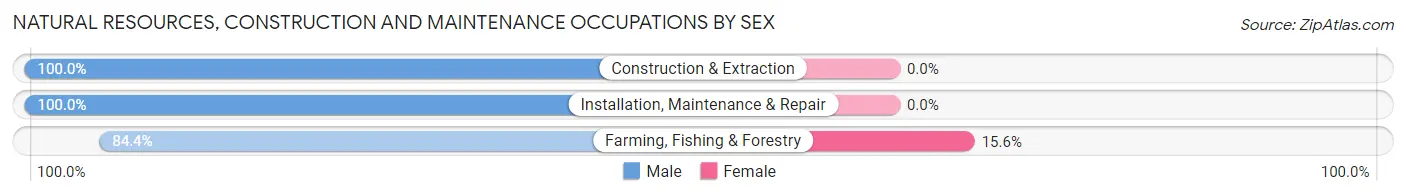
| Occupation | Male | Female |
| Farming, Fishing & Forestry | 38 (84.4%) | 7 (15.6%) |
| Construction & Extraction | 157 (100.0%) | 0 (0.0%) |
| Installation, Maintenance & Repair | 123 (100.0%) | 0 (0.0%) |
| Total (Category) | 318 (97.9%) | 7 (2.1%) |
| Total (Overall) | 1,354 (51.6%) | 1,270 (48.4%) |
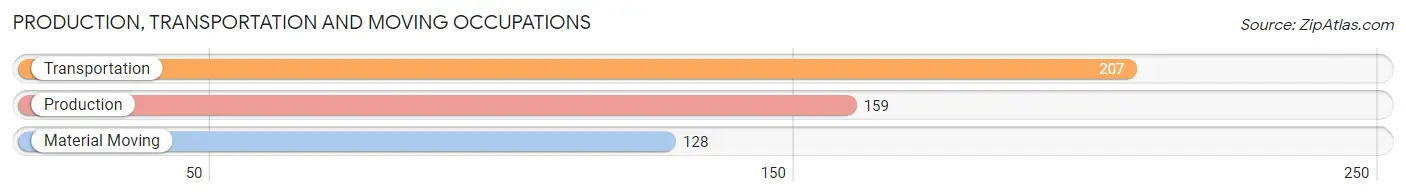
Production, Transportation and Moving Occupations
The most common Production, Transportation and Moving occupations in Morris County are Transportation (207 | 7.9%), Production (159 | 6.1%), and Material Moving (128 | 4.9%).
Production, Transportation and Moving Occupations by Sex
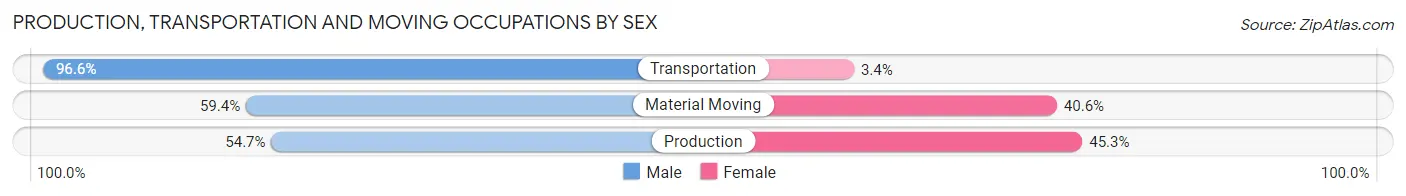
| Occupation | Male | Female |
| Production | 87 (54.7%) | 72 (45.3%) |
| Transportation | 200 (96.6%) | 7 (3.4%) |
| Material Moving | 76 (59.4%) | 52 (40.6%) |
| Total (Category) | 363 (73.5%) | 131 (26.5%) |
| Total (Overall) | 1,354 (51.6%) | 1,270 (48.4%) |
Employment Industries by Sex in Morris County
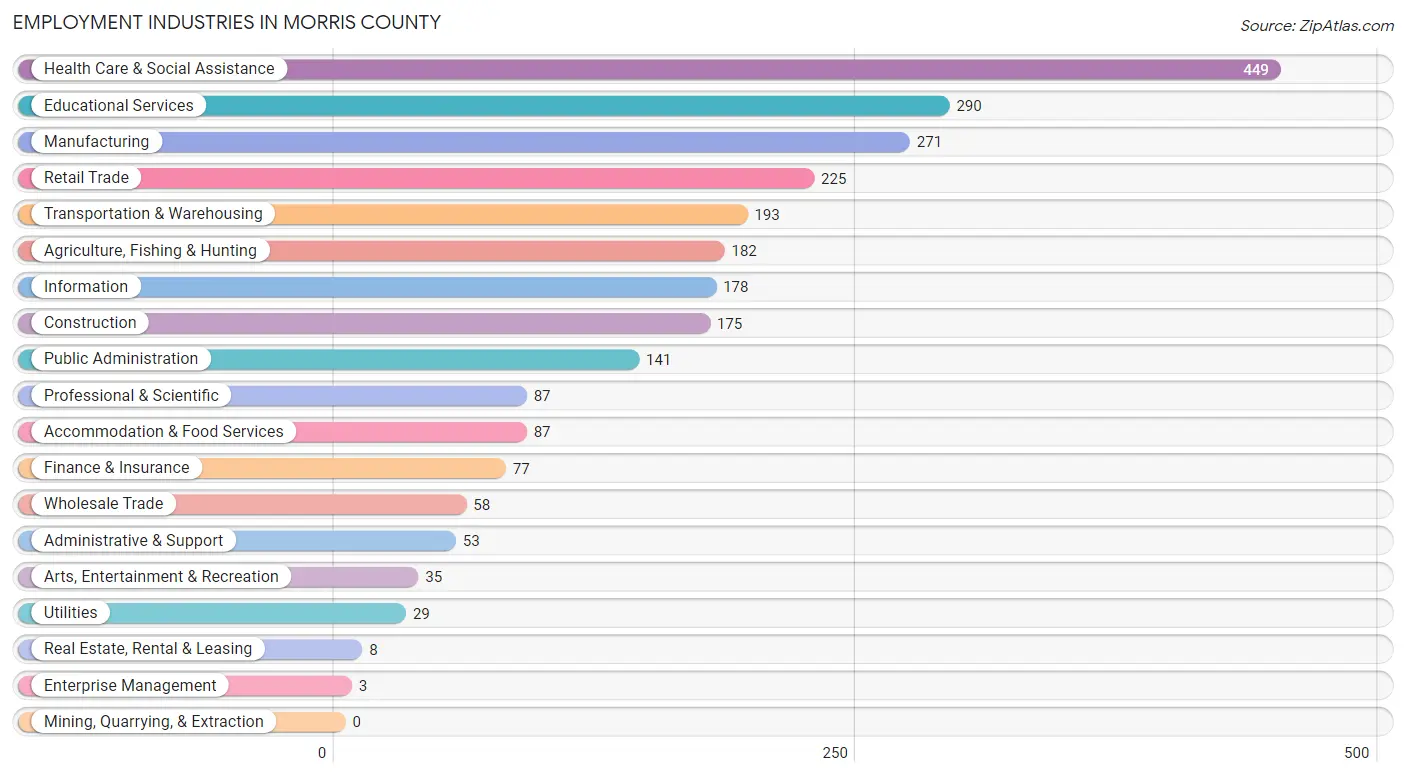
Employment Industries in Morris County
The major employment industries in Morris County include Health Care & Social Assistance (449 | 17.1%), Educational Services (290 | 11.1%), Manufacturing (271 | 10.3%), Retail Trade (225 | 8.6%), and Transportation & Warehousing (193 | 7.4%).
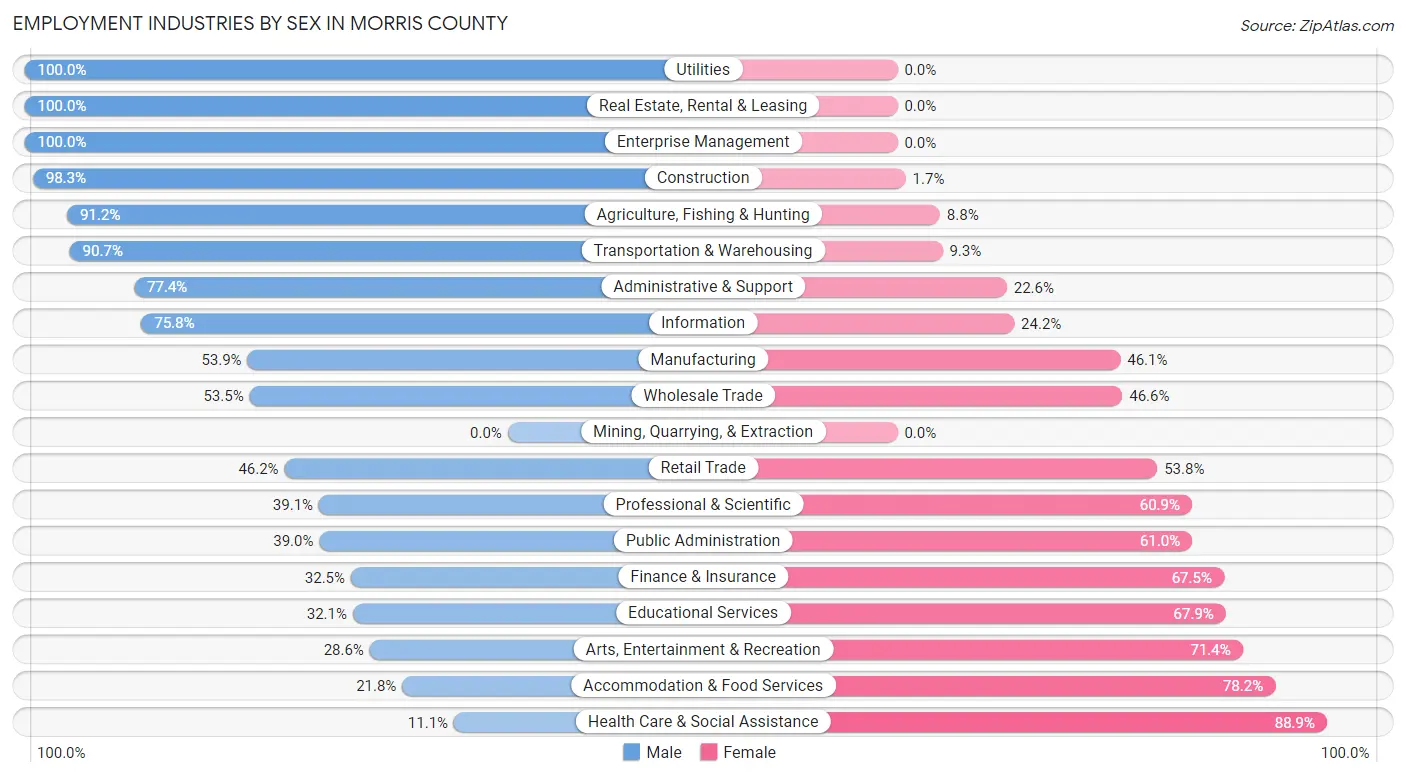
Employment Industries by Sex in Morris County
The Morris County industries that see more men than women are Utilities (100.0%), Real Estate, Rental & Leasing (100.0%), and Enterprise Management (100.0%), whereas the industries that tend to have a higher number of women are Health Care & Social Assistance (88.9%), Accommodation & Food Services (78.2%), and Arts, Entertainment & Recreation (71.4%).
| Industry | Male | Female |
| Agriculture, Fishing & Hunting | 166 (91.2%) | 16 (8.8%) |
| Mining, Quarrying, & Extraction | 0 (0.0%) | 0 (0.0%) |
| Construction | 172 (98.3%) | 3 (1.7%) |
| Manufacturing | 146 (53.9%) | 125 (46.1%) |
| Wholesale Trade | 31 (53.4%) | 27 (46.6%) |
| Retail Trade | 104 (46.2%) | 121 (53.8%) |
| Transportation & Warehousing | 175 (90.7%) | 18 (9.3%) |
| Utilities | 29 (100.0%) | 0 (0.0%) |
| Information | 135 (75.8%) | 43 (24.2%) |
| Finance & Insurance | 25 (32.5%) | 52 (67.5%) |
| Real Estate, Rental & Leasing | 8 (100.0%) | 0 (0.0%) |
| Professional & Scientific | 34 (39.1%) | 53 (60.9%) |
| Enterprise Management | 3 (100.0%) | 0 (0.0%) |
| Administrative & Support | 41 (77.4%) | 12 (22.6%) |
| Educational Services | 93 (32.1%) | 197 (67.9%) |
| Health Care & Social Assistance | 50 (11.1%) | 399 (88.9%) |
| Arts, Entertainment & Recreation | 10 (28.6%) | 25 (71.4%) |
| Accommodation & Food Services | 19 (21.8%) | 68 (78.2%) |
| Public Administration | 55 (39.0%) | 86 (61.0%) |
| Total | 1,354 (51.6%) | 1,270 (48.4%) |
Education in Morris County
School Enrollment in Morris County
The most common levels of schooling among the 1,117 students in Morris County are middle school (328 | 29.4%), elementary school (273 | 24.4%), and high school (244 | 21.8%).
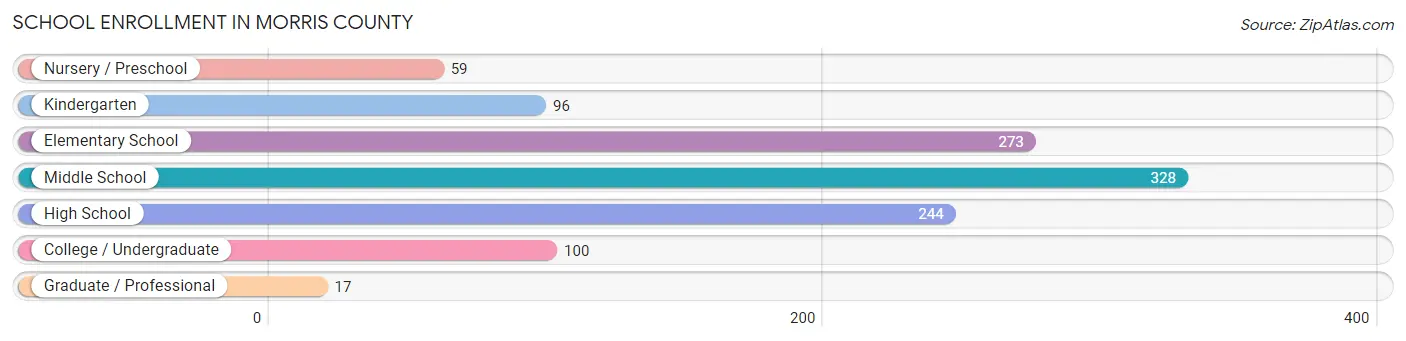
| School Level | # Students | % Students |
| Nursery / Preschool | 59 | 5.3% |
| Kindergarten | 96 | 8.6% |
| Elementary School | 273 | 24.4% |
| Middle School | 328 | 29.4% |
| High School | 244 | 21.8% |
| College / Undergraduate | 100 | 8.9% |
| Graduate / Professional | 17 | 1.5% |
| Total | 1,117 | 100.0% |
School Enrollment by Age by Funding Source in Morris County
Out of a total of 1,117 students who are enrolled in schools in Morris County, 68 (6.1%) attend a private institution, while the remaining 1,049 (93.9%) are enrolled in public schools. The age group of 35 years and over has the highest likelihood of being enrolled in private schools, with 7 (30.4% in the age bracket) enrolled. Conversely, the age group of 15 to 17 year olds has the lowest likelihood of being enrolled in a private school, with 153 (100.0% in the age bracket) attending a public institution.
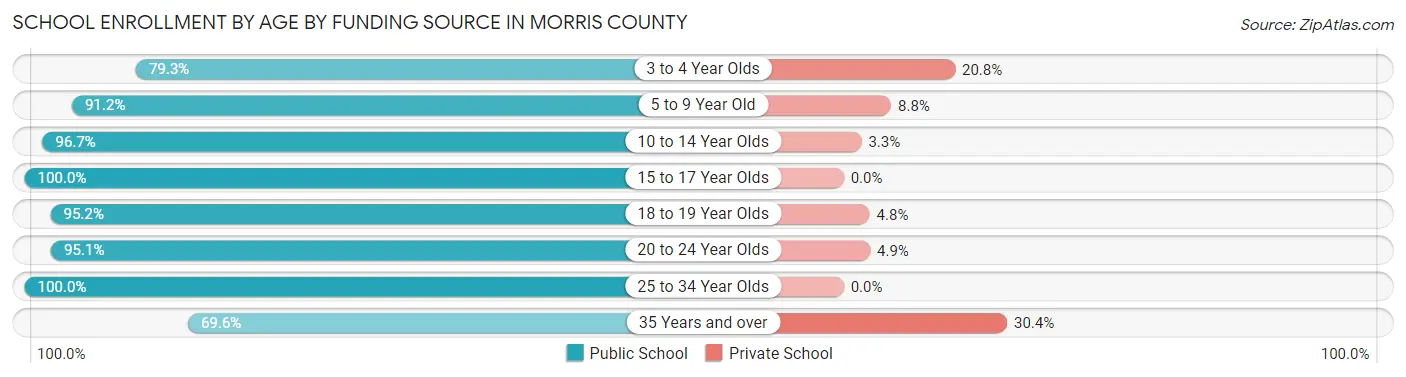
| Age Bracket | Public School | Private School |
| 3 to 4 Year Olds | 42 (79.2%) | 11 (20.7%) |
| 5 to 9 Year Old | 320 (91.2%) | 31 (8.8%) |
| 10 to 14 Year Olds | 379 (96.7%) | 13 (3.3%) |
| 15 to 17 Year Olds | 153 (100.0%) | 0 (0.0%) |
| 18 to 19 Year Olds | 59 (95.2%) | 3 (4.8%) |
| 20 to 24 Year Olds | 58 (95.1%) | 3 (4.9%) |
| 25 to 34 Year Olds | 22 (100.0%) | 0 (0.0%) |
| 35 Years and over | 16 (69.6%) | 7 (30.4%) |
| Total | 1,049 (93.9%) | 68 (6.1%) |
Educational Attainment by Field of Study in Morris County
Business (268 | 23.6%), education (230 | 20.3%), bio, nature & agricultural (183 | 16.1%), science & technology (111 | 9.8%), and arts & humanities (92 | 8.1%) are the most common fields of study among 1,136 individuals in Morris County who have obtained a bachelor's degree or higher.
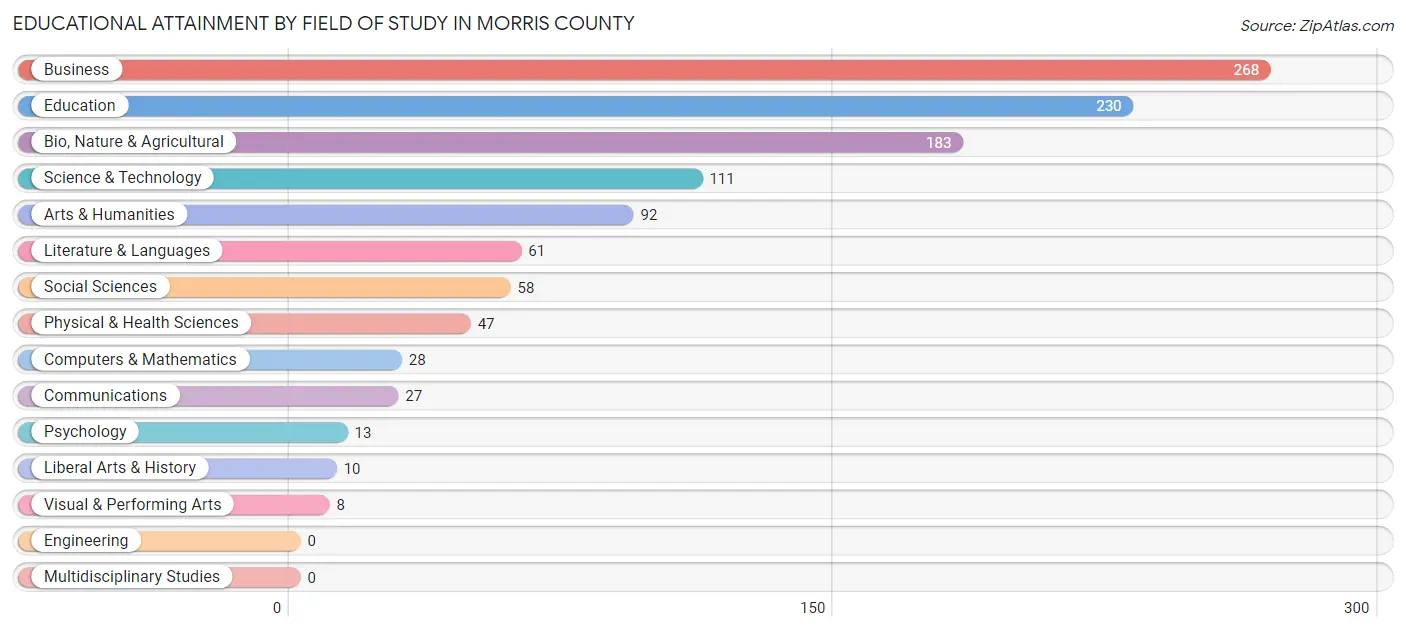
| Field of Study | # Graduates | % Graduates |
| Computers & Mathematics | 28 | 2.5% |
| Bio, Nature & Agricultural | 183 | 16.1% |
| Physical & Health Sciences | 47 | 4.1% |
| Psychology | 13 | 1.1% |
| Social Sciences | 58 | 5.1% |
| Engineering | 0 | 0.0% |
| Multidisciplinary Studies | 0 | 0.0% |
| Science & Technology | 111 | 9.8% |
| Business | 268 | 23.6% |
| Education | 230 | 20.3% |
| Literature & Languages | 61 | 5.4% |
| Liberal Arts & History | 10 | 0.9% |
| Visual & Performing Arts | 8 | 0.7% |
| Communications | 27 | 2.4% |
| Arts & Humanities | 92 | 8.1% |
| Total | 1,136 | 100.0% |
Transportation & Commute in Morris County
Vehicle Availability by Sex in Morris County
The most prevalent vehicle ownership categories in Morris County are males with 2 vehicles (593, accounting for 45.8%) and females with 2 vehicles (553, making up 47.5%).
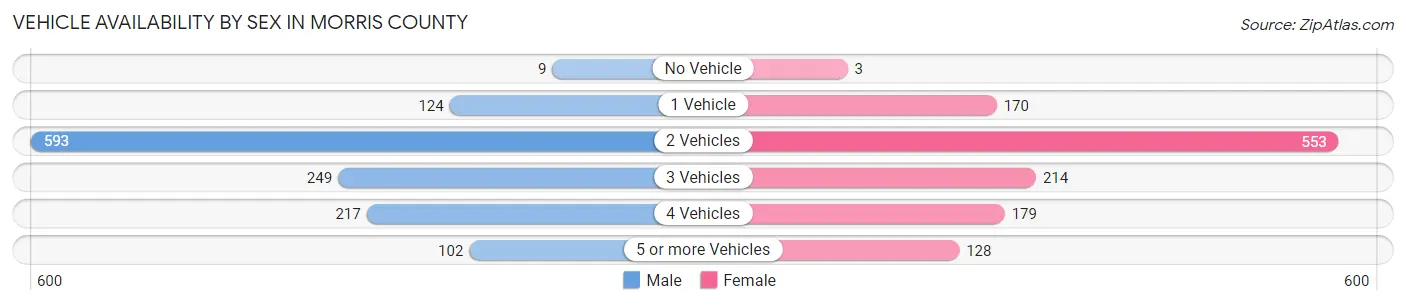
| Vehicles Available | Male | Female |
| No Vehicle | 9 (0.7%) | 3 (0.2%) |
| 1 Vehicle | 124 (9.6%) | 170 (13.6%) |
| 2 Vehicles | 593 (45.8%) | 553 (44.4%) |
| 3 Vehicles | 249 (19.2%) | 214 (17.2%) |
| 4 Vehicles | 217 (16.8%) | 179 (14.3%) |
| 5 or more Vehicles | 102 (7.9%) | 128 (10.3%) |
| Total | 1,294 (100.0%) | 1,247 (100.0%) |
Commute Time in Morris County
The most frequently occuring commute durations in Morris County are 10 to 14 minutes (428 commuters, 18.2%), 45 to 59 minutes (364 commuters, 15.4%), and 5 to 9 minutes (361 commuters, 15.3%).
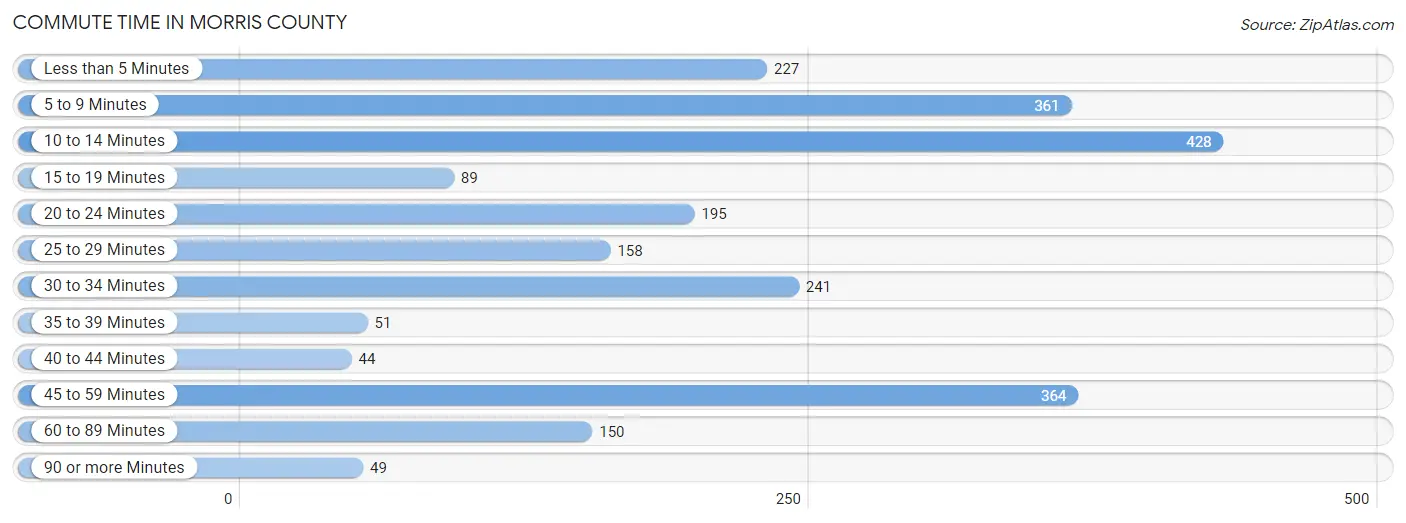
| Commute Time | # Commuters | % Commuters |
| Less than 5 Minutes | 227 | 9.6% |
| 5 to 9 Minutes | 361 | 15.3% |
| 10 to 14 Minutes | 428 | 18.2% |
| 15 to 19 Minutes | 89 | 3.8% |
| 20 to 24 Minutes | 195 | 8.3% |
| 25 to 29 Minutes | 158 | 6.7% |
| 30 to 34 Minutes | 241 | 10.2% |
| 35 to 39 Minutes | 51 | 2.2% |
| 40 to 44 Minutes | 44 | 1.9% |
| 45 to 59 Minutes | 364 | 15.4% |
| 60 to 89 Minutes | 150 | 6.4% |
| 90 or more Minutes | 49 | 2.1% |
Commute Time by Sex in Morris County
The most common commute times in Morris County are 10 to 14 minutes (241 commuters, 19.9%) for males and 45 to 59 minutes (192 commuters, 16.7%) for females.
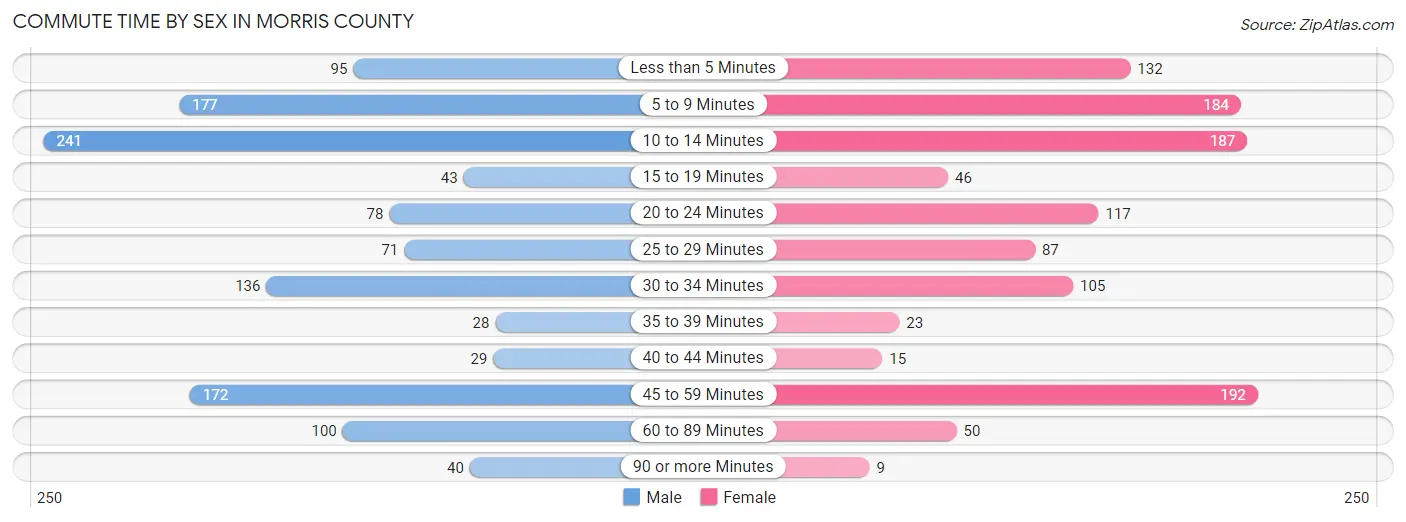
| Commute Time | Male | Female |
| Less than 5 Minutes | 95 (7.9%) | 132 (11.5%) |
| 5 to 9 Minutes | 177 (14.6%) | 184 (16.0%) |
| 10 to 14 Minutes | 241 (19.9%) | 187 (16.3%) |
| 15 to 19 Minutes | 43 (3.5%) | 46 (4.0%) |
| 20 to 24 Minutes | 78 (6.5%) | 117 (10.2%) |
| 25 to 29 Minutes | 71 (5.9%) | 87 (7.6%) |
| 30 to 34 Minutes | 136 (11.2%) | 105 (9.1%) |
| 35 to 39 Minutes | 28 (2.3%) | 23 (2.0%) |
| 40 to 44 Minutes | 29 (2.4%) | 15 (1.3%) |
| 45 to 59 Minutes | 172 (14.2%) | 192 (16.7%) |
| 60 to 89 Minutes | 100 (8.3%) | 50 (4.4%) |
| 90 or more Minutes | 40 (3.3%) | 9 (0.8%) |
Time of Departure to Work by Sex in Morris County
The most frequent times of departure to work in Morris County are 6:00 AM to 6:29 AM (230, 19.0%) for males and 7:30 AM to 7:59 AM (254, 22.1%) for females.
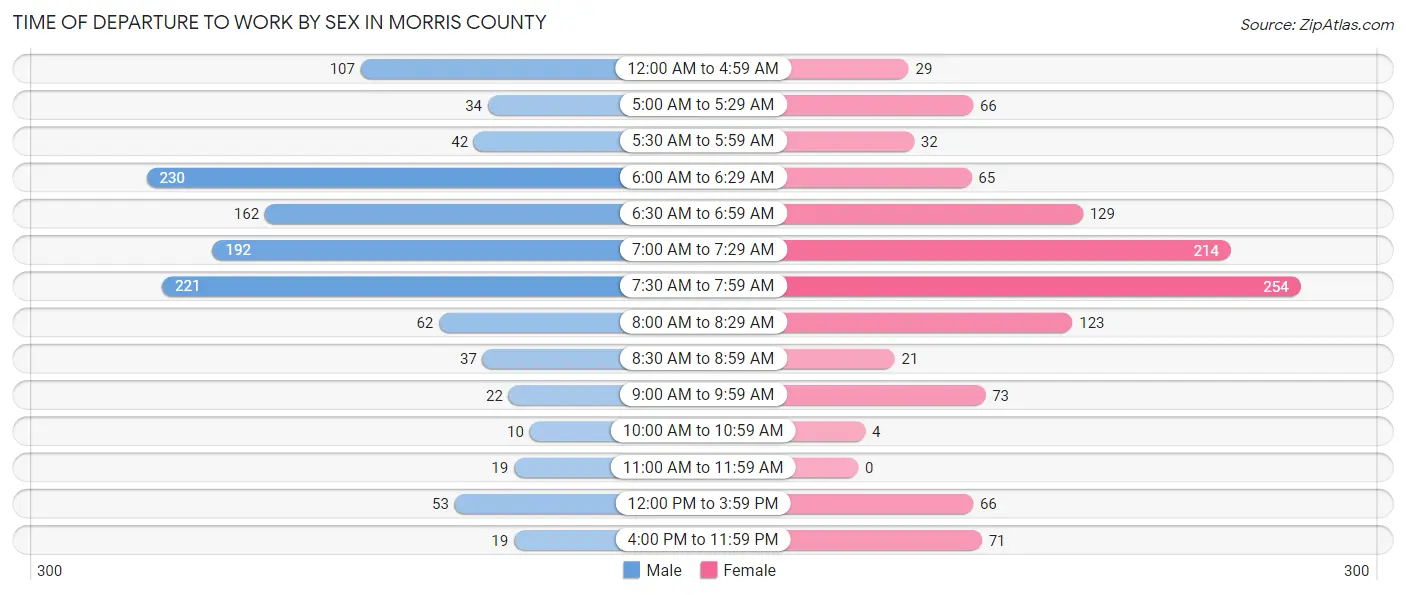
| Time of Departure | Male | Female |
| 12:00 AM to 4:59 AM | 107 (8.8%) | 29 (2.5%) |
| 5:00 AM to 5:29 AM | 34 (2.8%) | 66 (5.8%) |
| 5:30 AM to 5:59 AM | 42 (3.5%) | 32 (2.8%) |
| 6:00 AM to 6:29 AM | 230 (19.0%) | 65 (5.7%) |
| 6:30 AM to 6:59 AM | 162 (13.4%) | 129 (11.3%) |
| 7:00 AM to 7:29 AM | 192 (15.9%) | 214 (18.7%) |
| 7:30 AM to 7:59 AM | 221 (18.3%) | 254 (22.1%) |
| 8:00 AM to 8:29 AM | 62 (5.1%) | 123 (10.7%) |
| 8:30 AM to 8:59 AM | 37 (3.1%) | 21 (1.8%) |
| 9:00 AM to 9:59 AM | 22 (1.8%) | 73 (6.4%) |
| 10:00 AM to 10:59 AM | 10 (0.8%) | 4 (0.4%) |
| 11:00 AM to 11:59 AM | 19 (1.6%) | 0 (0.0%) |
| 12:00 PM to 3:59 PM | 53 (4.4%) | 66 (5.8%) |
| 4:00 PM to 11:59 PM | 19 (1.6%) | 71 (6.2%) |
| Total | 1,210 (100.0%) | 1,147 (100.0%) |
Housing Occupancy in Morris County
Occupancy by Ownership in Morris County
Of the total 2,288 dwellings in Morris County, owner-occupied units account for 1,876 (82.0%), while renter-occupied units make up 412 (18.0%).
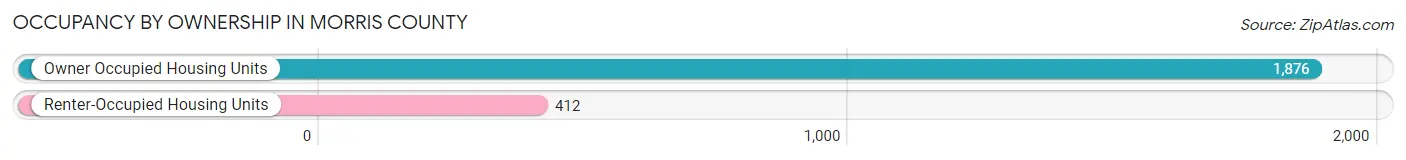
| Occupancy | # Housing Units | % Housing Units |
| Owner Occupied Housing Units | 1,876 | 82.0% |
| Renter-Occupied Housing Units | 412 | 18.0% |
| Total Occupied Housing Units | 2,288 | 100.0% |
Occupancy by Household Size in Morris County
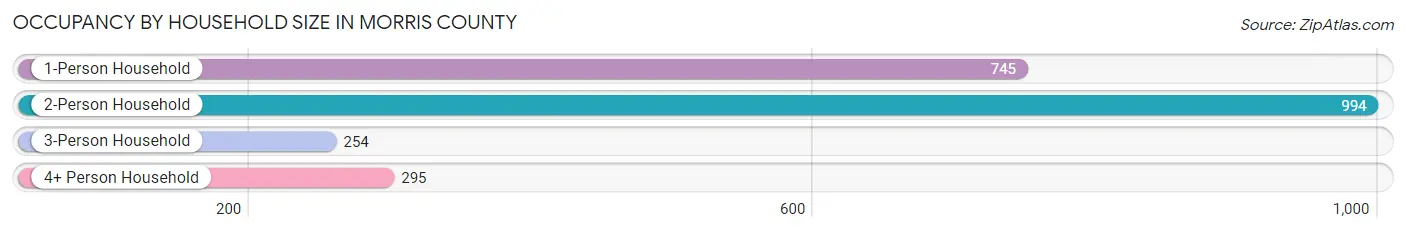
| Household Size | # Housing Units | % Housing Units |
| 1-Person Household | 745 | 32.6% |
| 2-Person Household | 994 | 43.4% |
| 3-Person Household | 254 | 11.1% |
| 4+ Person Household | 295 | 12.9% |
| Total Housing Units | 2,288 | 100.0% |
Occupancy by Ownership by Household Size in Morris County
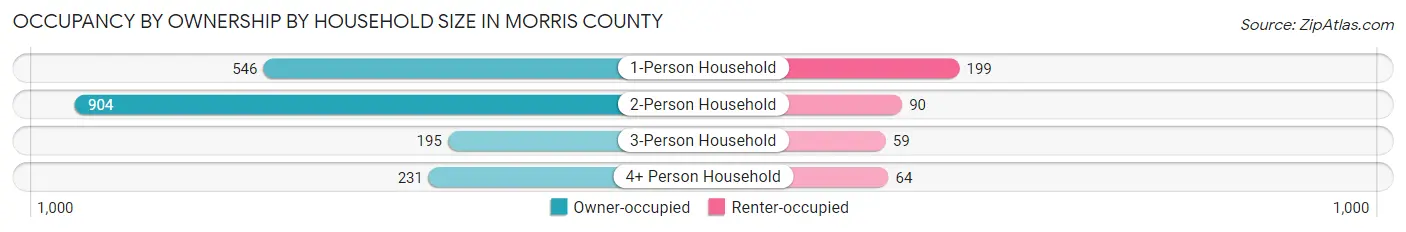
| Household Size | Owner-occupied | Renter-occupied |
| 1-Person Household | 546 (73.3%) | 199 (26.7%) |
| 2-Person Household | 904 (90.9%) | 90 (9.0%) |
| 3-Person Household | 195 (76.8%) | 59 (23.2%) |
| 4+ Person Household | 231 (78.3%) | 64 (21.7%) |
| Total Housing Units | 1,876 (82.0%) | 412 (18.0%) |
Occupancy by Educational Attainment in Morris County
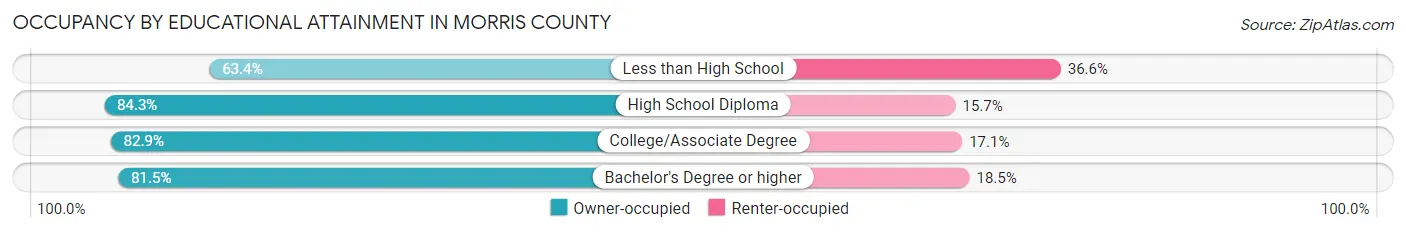
| Household Size | Owner-occupied | Renter-occupied |
| Less than High School | 71 (63.4%) | 41 (36.6%) |
| High School Diploma | 589 (84.3%) | 110 (15.7%) |
| College/Associate Degree | 710 (82.9%) | 146 (17.1%) |
| Bachelor's Degree or higher | 506 (81.5%) | 115 (18.5%) |
Occupancy by Age of Householder in Morris County
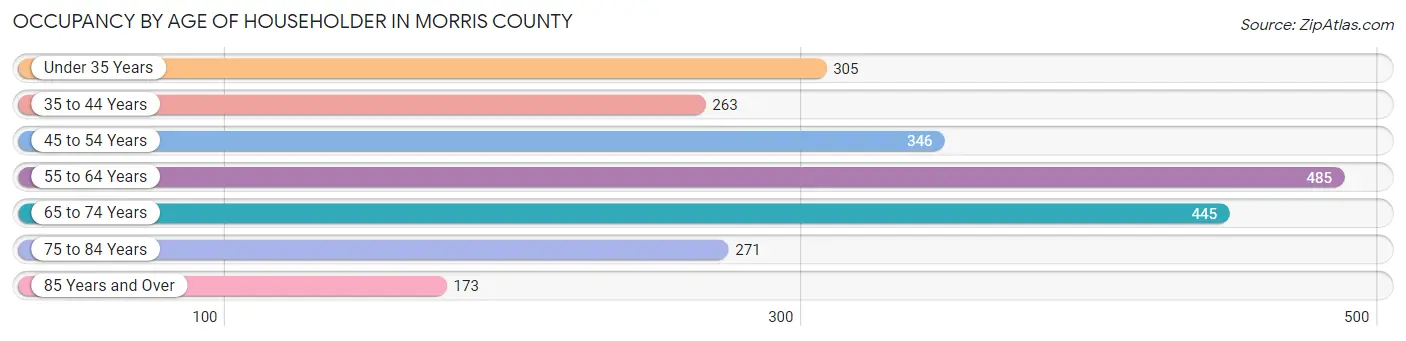
| Age Bracket | # Households | % Households |
| Under 35 Years | 305 | 13.3% |
| 35 to 44 Years | 263 | 11.5% |
| 45 to 54 Years | 346 | 15.1% |
| 55 to 64 Years | 485 | 21.2% |
| 65 to 74 Years | 445 | 19.5% |
| 75 to 84 Years | 271 | 11.8% |
| 85 Years and Over | 173 | 7.6% |
| Total | 2,288 | 100.0% |
Housing Finances in Morris County
Median Income by Occupancy in Morris County
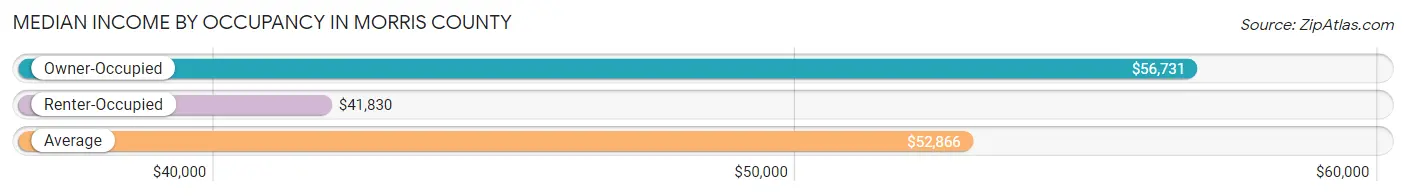
| Occupancy Type | # Households | Median Income |
| Owner-Occupied | 1,876 (82.0%) | $56,731 |
| Renter-Occupied | 412 (18.0%) | $41,830 |
| Average | 2,288 (100.0%) | $52,866 |
Occupancy by Householder Income Bracket in Morris County
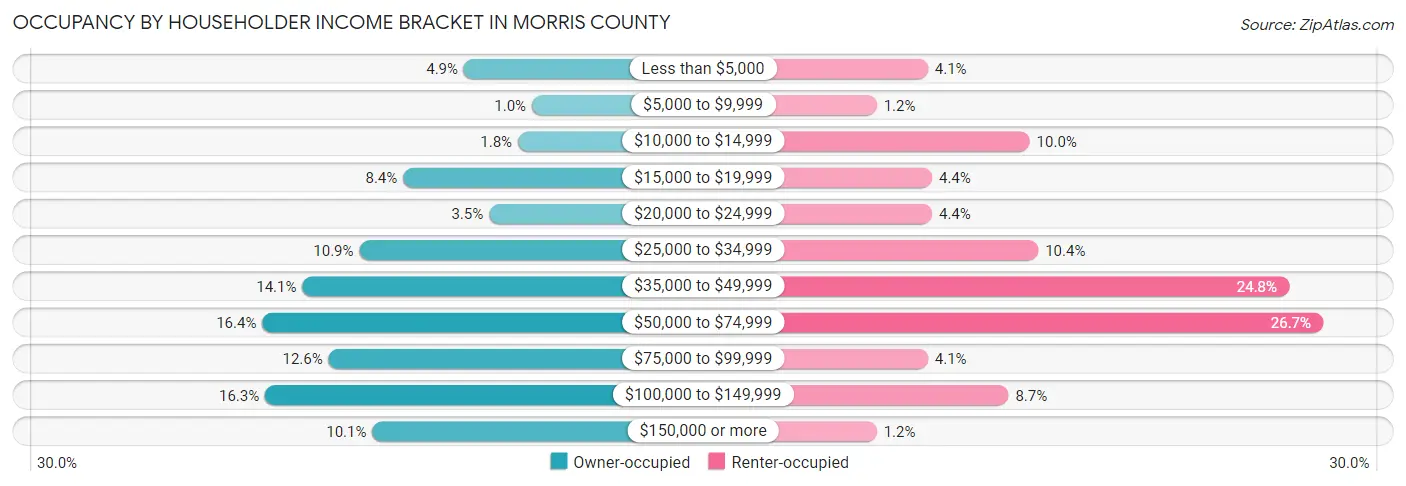
| Income Bracket | Owner-occupied | Renter-occupied |
| Less than $5,000 | 92 (4.9%) | 17 (4.1%) |
| $5,000 to $9,999 | 19 (1.0%) | 5 (1.2%) |
| $10,000 to $14,999 | 34 (1.8%) | 41 (10.0%) |
| $15,000 to $19,999 | 157 (8.4%) | 18 (4.4%) |
| $20,000 to $24,999 | 65 (3.5%) | 18 (4.4%) |
| $25,000 to $34,999 | 204 (10.9%) | 43 (10.4%) |
| $35,000 to $49,999 | 265 (14.1%) | 102 (24.8%) |
| $50,000 to $74,999 | 308 (16.4%) | 110 (26.7%) |
| $75,000 to $99,999 | 237 (12.6%) | 17 (4.1%) |
| $100,000 to $149,999 | 305 (16.3%) | 36 (8.7%) |
| $150,000 or more | 190 (10.1%) | 5 (1.2%) |
| Total | 1,876 (100.0%) | 412 (100.0%) |
Monthly Housing Cost Tiers in Morris County
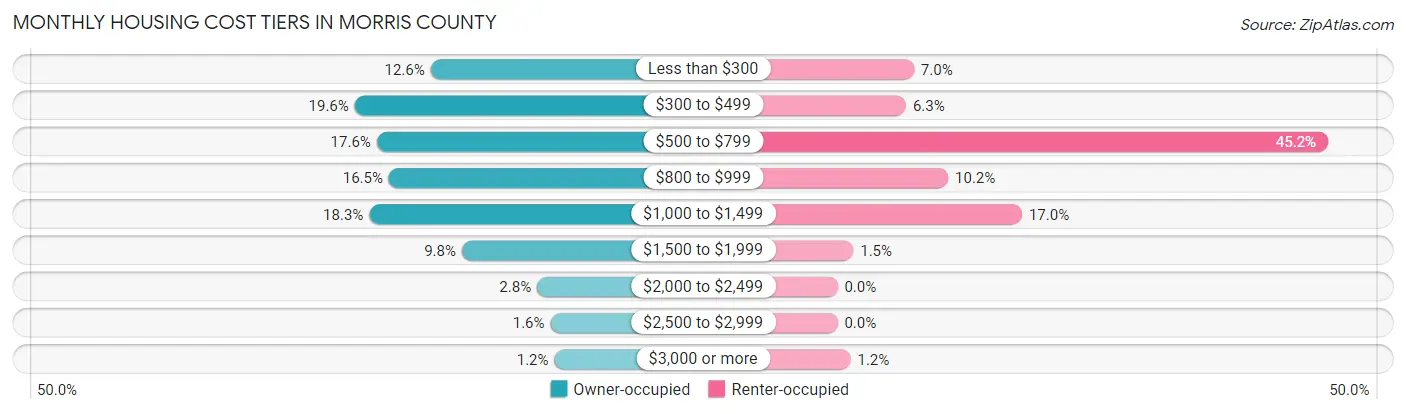
| Monthly Cost | Owner-occupied | Renter-occupied |
| Less than $300 | 237 (12.6%) | 29 (7.0%) |
| $300 to $499 | 368 (19.6%) | 26 (6.3%) |
| $500 to $799 | 330 (17.6%) | 186 (45.2%) |
| $800 to $999 | 309 (16.5%) | 42 (10.2%) |
| $1,000 to $1,499 | 343 (18.3%) | 70 (17.0%) |
| $1,500 to $1,999 | 183 (9.8%) | 6 (1.5%) |
| $2,000 to $2,499 | 53 (2.8%) | 0 (0.0%) |
| $2,500 to $2,999 | 30 (1.6%) | 0 (0.0%) |
| $3,000 or more | 23 (1.2%) | 5 (1.2%) |
| Total | 1,876 (100.0%) | 412 (100.0%) |
Physical Housing Characteristics in Morris County
Housing Structures in Morris County
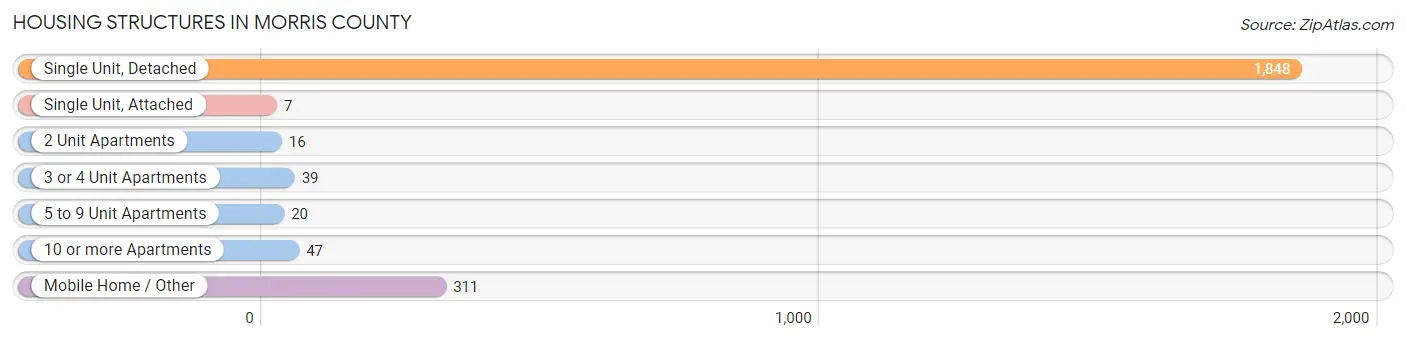
| Structure Type | # Housing Units | % Housing Units |
| Single Unit, Detached | 1,848 | 80.8% |
| Single Unit, Attached | 7 | 0.3% |
| 2 Unit Apartments | 16 | 0.7% |
| 3 or 4 Unit Apartments | 39 | 1.7% |
| 5 to 9 Unit Apartments | 20 | 0.9% |
| 10 or more Apartments | 47 | 2.1% |
| Mobile Home / Other | 311 | 13.6% |
| Total | 2,288 | 100.0% |
Housing Structures by Occupancy in Morris County
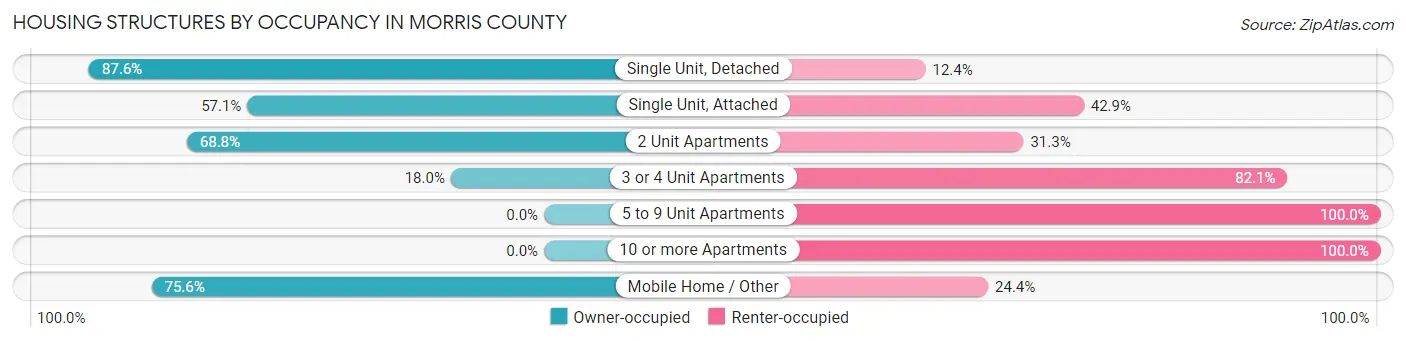
| Structure Type | Owner-occupied | Renter-occupied |
| Single Unit, Detached | 1,619 (87.6%) | 229 (12.4%) |
| Single Unit, Attached | 4 (57.1%) | 3 (42.9%) |
| 2 Unit Apartments | 11 (68.8%) | 5 (31.2%) |
| 3 or 4 Unit Apartments | 7 (17.9%) | 32 (82.1%) |
| 5 to 9 Unit Apartments | 0 (0.0%) | 20 (100.0%) |
| 10 or more Apartments | 0 (0.0%) | 47 (100.0%) |
| Mobile Home / Other | 235 (75.6%) | 76 (24.4%) |
| Total | 1,876 (82.0%) | 412 (18.0%) |
Housing Structures by Number of Rooms in Morris County
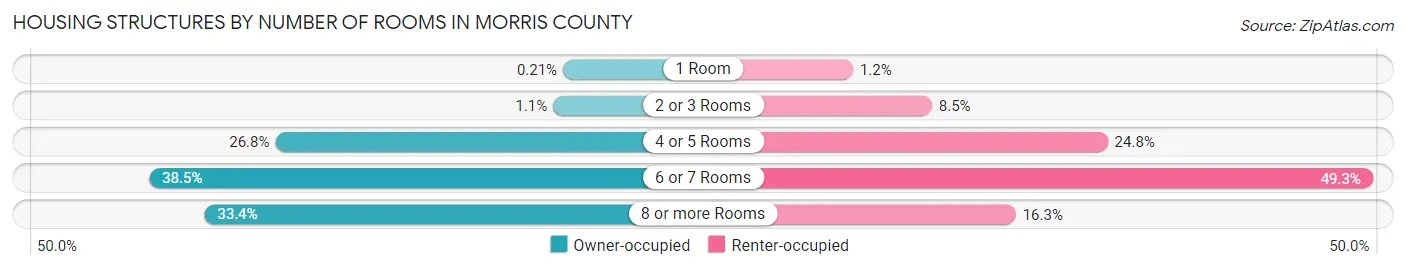
| Number of Rooms | Owner-occupied | Renter-occupied |
| 1 Room | 4 (0.2%) | 5 (1.2%) |
| 2 or 3 Rooms | 21 (1.1%) | 35 (8.5%) |
| 4 or 5 Rooms | 503 (26.8%) | 102 (24.8%) |
| 6 or 7 Rooms | 722 (38.5%) | 203 (49.3%) |
| 8 or more Rooms | 626 (33.4%) | 67 (16.3%) |
| Total | 1,876 (100.0%) | 412 (100.0%) |
Housing Structure by Heating Type in Morris County
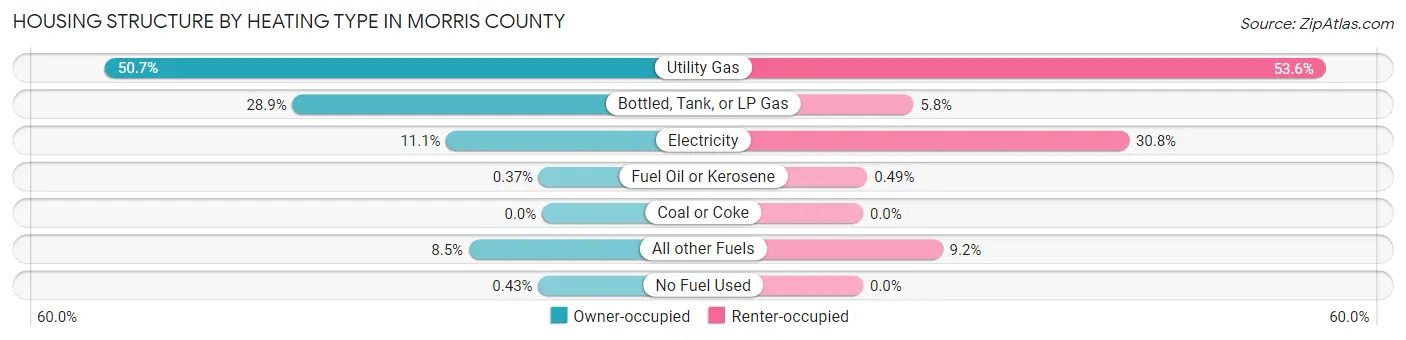
| Heating Type | Owner-occupied | Renter-occupied |
| Utility Gas | 951 (50.7%) | 221 (53.6%) |
| Bottled, Tank, or LP Gas | 543 (28.9%) | 24 (5.8%) |
| Electricity | 208 (11.1%) | 127 (30.8%) |
| Fuel Oil or Kerosene | 7 (0.4%) | 2 (0.5%) |
| Coal or Coke | 0 (0.0%) | 0 (0.0%) |
| All other Fuels | 159 (8.5%) | 38 (9.2%) |
| No Fuel Used | 8 (0.4%) | 0 (0.0%) |
| Total | 1,876 (100.0%) | 412 (100.0%) |
Household Vehicle Usage in Morris County
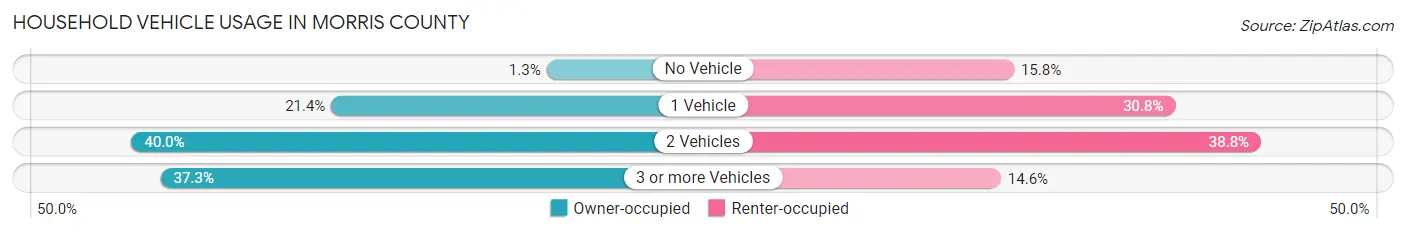
| Vehicles per Household | Owner-occupied | Renter-occupied |
| No Vehicle | 24 (1.3%) | 65 (15.8%) |
| 1 Vehicle | 401 (21.4%) | 127 (30.8%) |
| 2 Vehicles | 751 (40.0%) | 160 (38.8%) |
| 3 or more Vehicles | 700 (37.3%) | 60 (14.6%) |
| Total | 1,876 (100.0%) | 412 (100.0%) |
Real Estate & Mortgages in Morris County
Real Estate and Mortgage Overview in Morris County
| Characteristic | Without Mortgage | With Mortgage |
| Housing Units | 1,086 | 790 |
| Median Property Value | $84,500 | $146,500 |
| Median Household Income | $39,048 | $144 |
| Monthly Housing Costs | $471 | $23 |
| Real Estate Taxes | $1,628 | $11 |
Property Value by Mortgage Status in Morris County
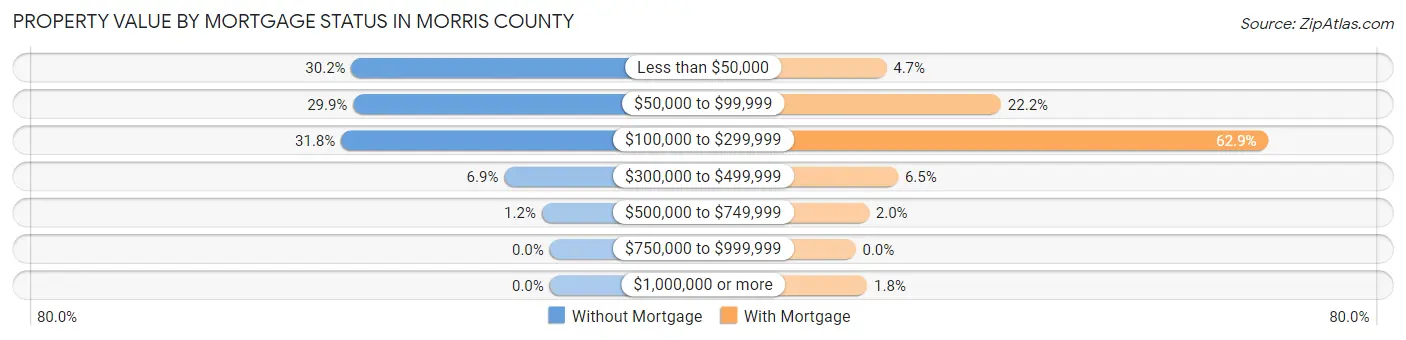
| Property Value | Without Mortgage | With Mortgage |
| Less than $50,000 | 328 (30.2%) | 37 (4.7%) |
| $50,000 to $99,999 | 325 (29.9%) | 175 (22.2%) |
| $100,000 to $299,999 | 345 (31.8%) | 497 (62.9%) |
| $300,000 to $499,999 | 75 (6.9%) | 51 (6.5%) |
| $500,000 to $749,999 | 13 (1.2%) | 16 (2.0%) |
| $750,000 to $999,999 | 0 (0.0%) | 0 (0.0%) |
| $1,000,000 or more | 0 (0.0%) | 14 (1.8%) |
| Total | 1,086 (100.0%) | 790 (100.0%) |
Household Income by Mortgage Status in Morris County
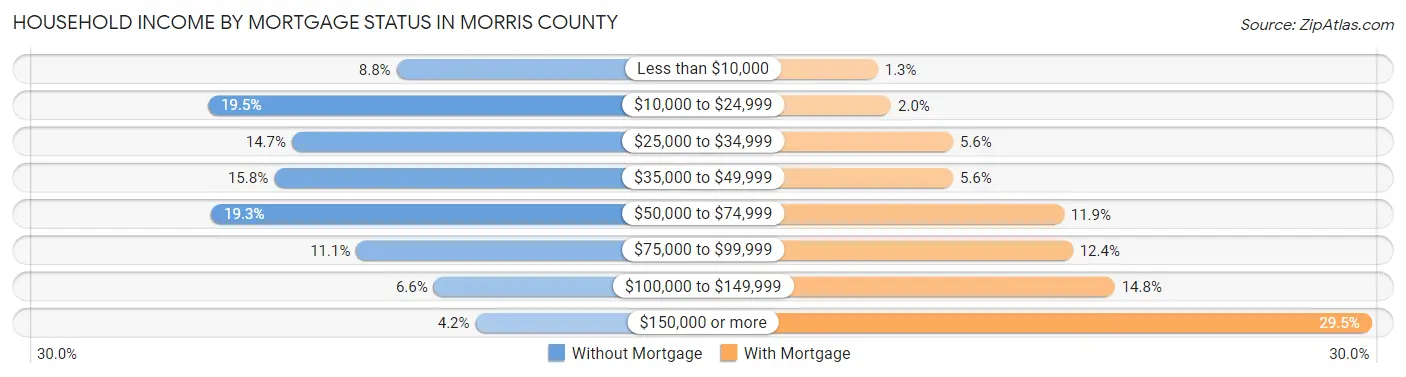
| Household Income | Without Mortgage | With Mortgage |
| Less than $10,000 | 95 (8.7%) | 10 (1.3%) |
| $10,000 to $24,999 | 212 (19.5%) | 16 (2.0%) |
| $25,000 to $34,999 | 160 (14.7%) | 44 (5.6%) |
| $35,000 to $49,999 | 171 (15.8%) | 44 (5.6%) |
| $50,000 to $74,999 | 210 (19.3%) | 94 (11.9%) |
| $75,000 to $99,999 | 120 (11.1%) | 98 (12.4%) |
| $100,000 to $149,999 | 72 (6.6%) | 117 (14.8%) |
| $150,000 or more | 46 (4.2%) | 233 (29.5%) |
| Total | 1,086 (100.0%) | 790 (100.0%) |
Property Value to Household Income Ratio in Morris County
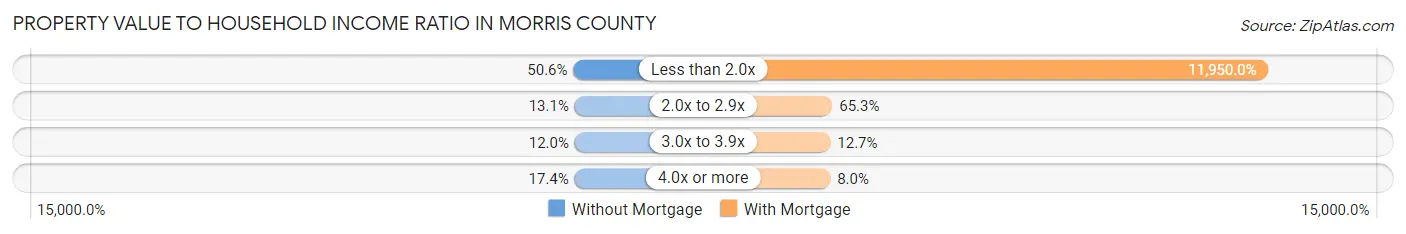
| Value-to-Income Ratio | Without Mortgage | With Mortgage |
| Less than 2.0x | 550 (50.6%) | 94,405 (11,950.0%) |
| 2.0x to 2.9x | 142 (13.1%) | 516 (65.3%) |
| 3.0x to 3.9x | 130 (12.0%) | 100 (12.7%) |
| 4.0x or more | 189 (17.4%) | 63 (8.0%) |
| Total | 1,086 (100.0%) | 790 (100.0%) |
Real Estate Taxes by Mortgage Status in Morris County
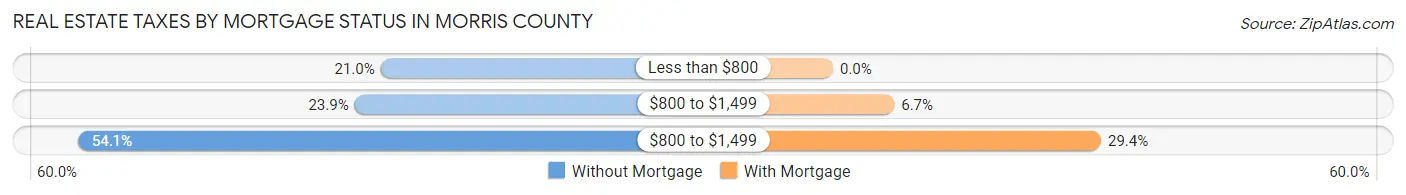
| Property Taxes | Without Mortgage | With Mortgage |
| Less than $800 | 228 (21.0%) | 0 (0.0%) |
| $800 to $1,499 | 259 (23.8%) | 53 (6.7%) |
| $800 to $1,499 | 587 (54.0%) | 232 (29.4%) |
| Total | 1,086 (100.0%) | 790 (100.0%) |
Health & Disability in Morris County
Health Insurance Coverage by Age in Morris County
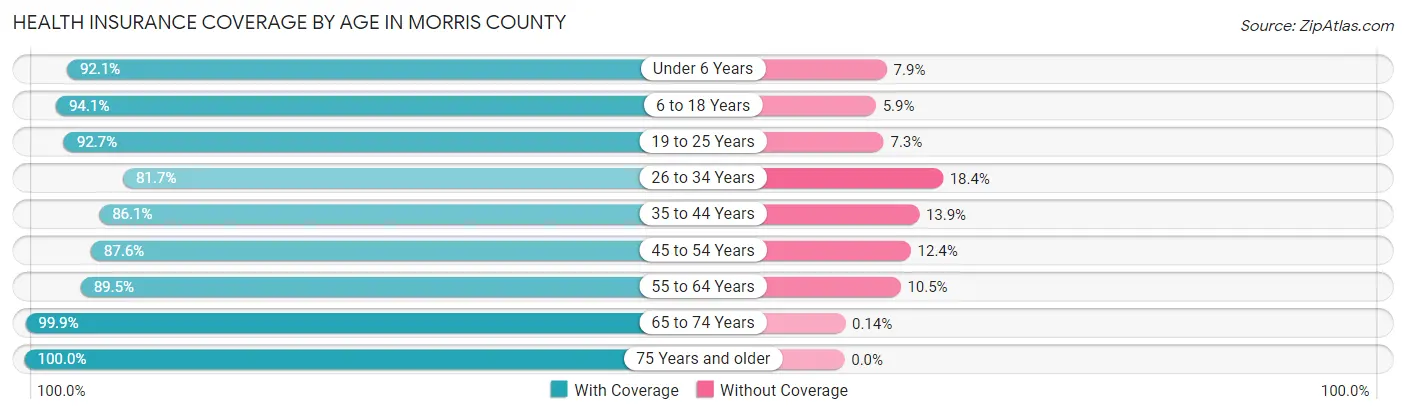
| Age Bracket | With Coverage | Without Coverage |
| Under 6 Years | 303 (92.1%) | 26 (7.9%) |
| 6 to 18 Years | 851 (94.1%) | 53 (5.9%) |
| 19 to 25 Years | 266 (92.7%) | 21 (7.3%) |
| 26 to 34 Years | 316 (81.7%) | 71 (18.3%) |
| 35 to 44 Years | 569 (86.1%) | 92 (13.9%) |
| 45 to 54 Years | 489 (87.6%) | 69 (12.4%) |
| 55 to 64 Years | 770 (89.5%) | 90 (10.5%) |
| 65 to 74 Years | 725 (99.9%) | 1 (0.1%) |
| 75 Years and older | 573 (100.0%) | 0 (0.0%) |
| Total | 4,862 (92.0%) | 423 (8.0%) |
Health Insurance Coverage by Citizenship Status in Morris County
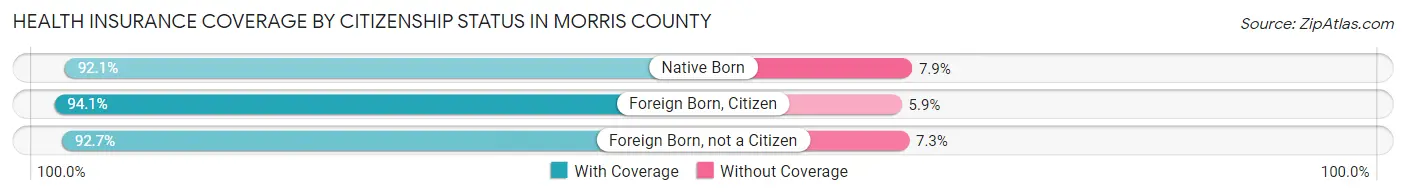
| Citizenship Status | With Coverage | Without Coverage |
| Native Born | 303 (92.1%) | 26 (7.9%) |
| Foreign Born, Citizen | 851 (94.1%) | 53 (5.9%) |
| Foreign Born, not a Citizen | 266 (92.7%) | 21 (7.3%) |
Health Insurance Coverage by Household Income in Morris County
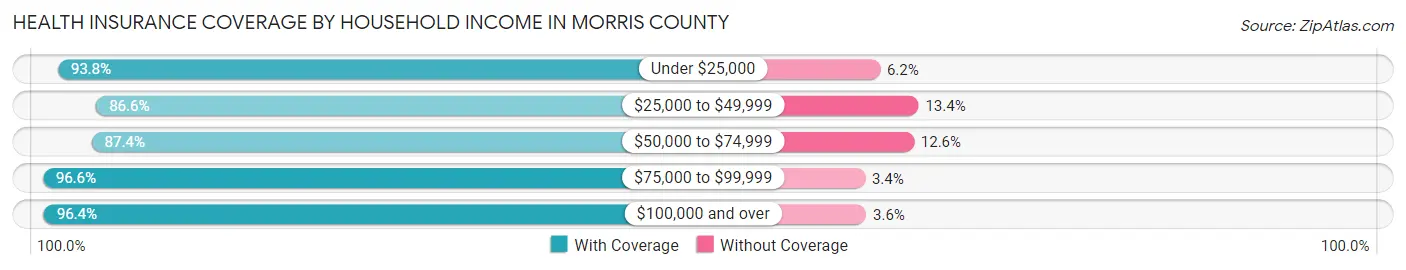
| Household Income | With Coverage | Without Coverage |
| Under $25,000 | 618 (93.8%) | 41 (6.2%) |
| $25,000 to $49,999 | 1,096 (86.6%) | 170 (13.4%) |
| $50,000 to $74,999 | 898 (87.4%) | 129 (12.6%) |
| $75,000 to $99,999 | 595 (96.6%) | 21 (3.4%) |
| $100,000 and over | 1,655 (96.4%) | 62 (3.6%) |
Public vs Private Health Insurance Coverage by Age in Morris County
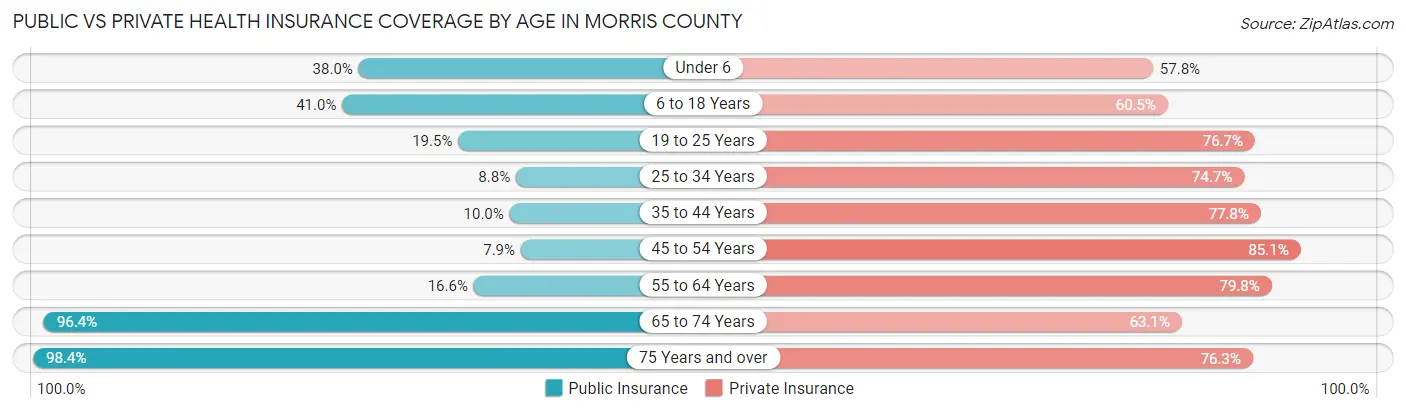
| Age Bracket | Public Insurance | Private Insurance |
| Under 6 | 125 (38.0%) | 190 (57.8%) |
| 6 to 18 Years | 371 (41.0%) | 547 (60.5%) |
| 19 to 25 Years | 56 (19.5%) | 220 (76.7%) |
| 25 to 34 Years | 34 (8.8%) | 289 (74.7%) |
| 35 to 44 Years | 66 (10.0%) | 514 (77.8%) |
| 45 to 54 Years | 44 (7.9%) | 475 (85.1%) |
| 55 to 64 Years | 143 (16.6%) | 686 (79.8%) |
| 65 to 74 Years | 700 (96.4%) | 458 (63.1%) |
| 75 Years and over | 564 (98.4%) | 437 (76.3%) |
| Total | 2,103 (39.8%) | 3,816 (72.2%) |
Disability Status by Sex by Age in Morris County
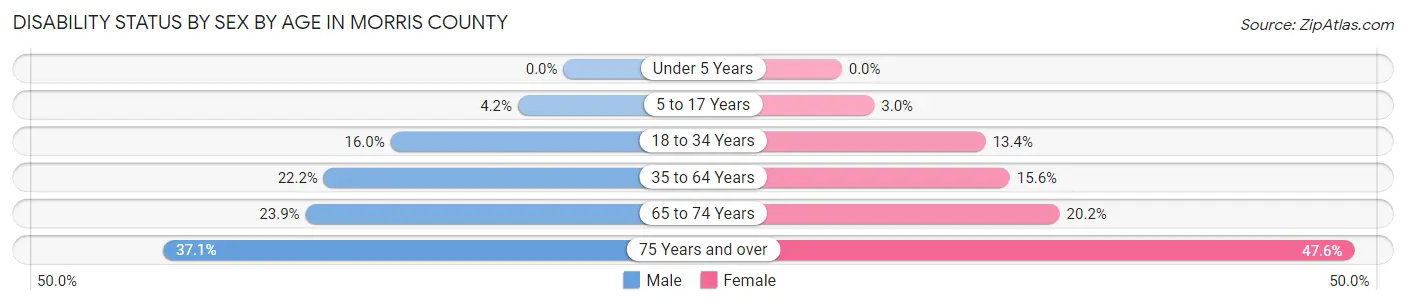
| Age Bracket | Male | Female |
| Under 5 Years | 0 (0.0%) | 0 (0.0%) |
| 5 to 17 Years | 23 (4.2%) | 11 (3.0%) |
| 18 to 34 Years | 72 (16.0%) | 39 (13.4%) |
| 35 to 64 Years | 230 (22.2%) | 163 (15.6%) |
| 65 to 74 Years | 85 (23.9%) | 75 (20.2%) |
| 75 Years and over | 91 (37.1%) | 156 (47.6%) |
Disability Class by Sex by Age in Morris County
Disability Class: Hearing Difficulty
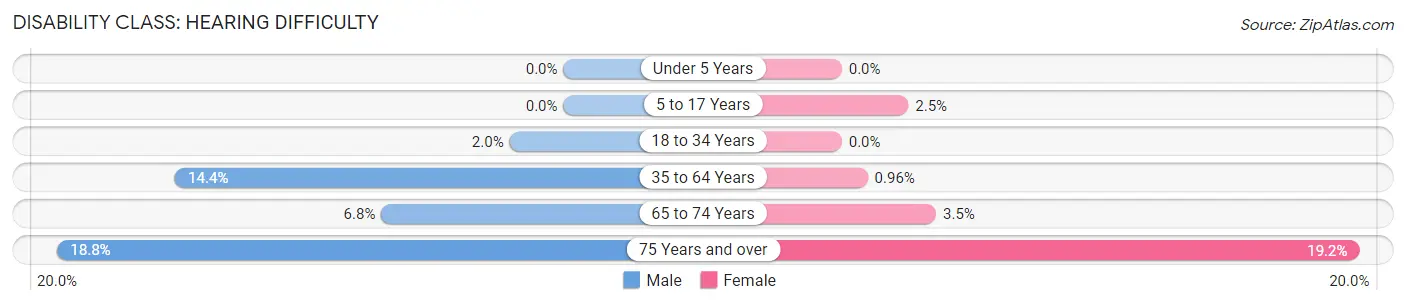
| Age Bracket | Male | Female |
| Under 5 Years | 0 (0.0%) | 0 (0.0%) |
| 5 to 17 Years | 0 (0.0%) | 9 (2.5%) |
| 18 to 34 Years | 9 (2.0%) | 0 (0.0%) |
| 35 to 64 Years | 149 (14.4%) | 10 (1.0%) |
| 65 to 74 Years | 24 (6.8%) | 13 (3.5%) |
| 75 Years and over | 46 (18.8%) | 63 (19.2%) |
Disability Class: Vision Difficulty
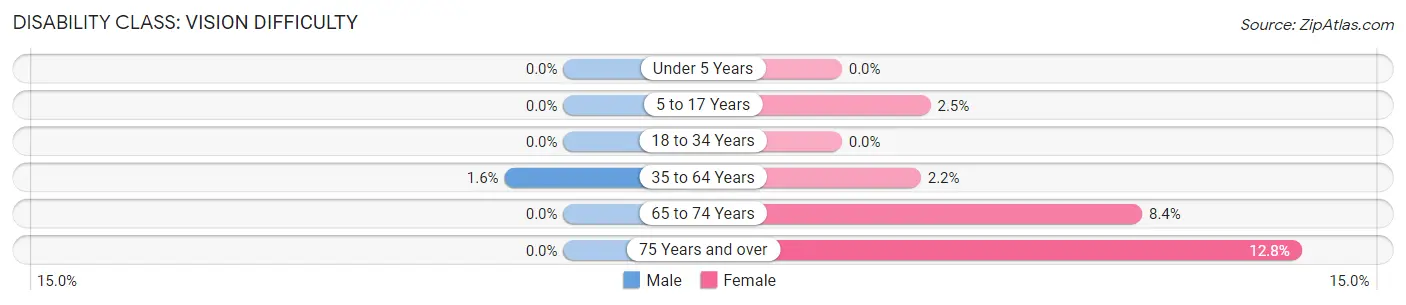
| Age Bracket | Male | Female |
| Under 5 Years | 0 (0.0%) | 0 (0.0%) |
| 5 to 17 Years | 0 (0.0%) | 9 (2.5%) |
| 18 to 34 Years | 0 (0.0%) | 0 (0.0%) |
| 35 to 64 Years | 17 (1.6%) | 23 (2.2%) |
| 65 to 74 Years | 0 (0.0%) | 31 (8.4%) |
| 75 Years and over | 0 (0.0%) | 42 (12.8%) |
Disability Class: Cognitive Difficulty
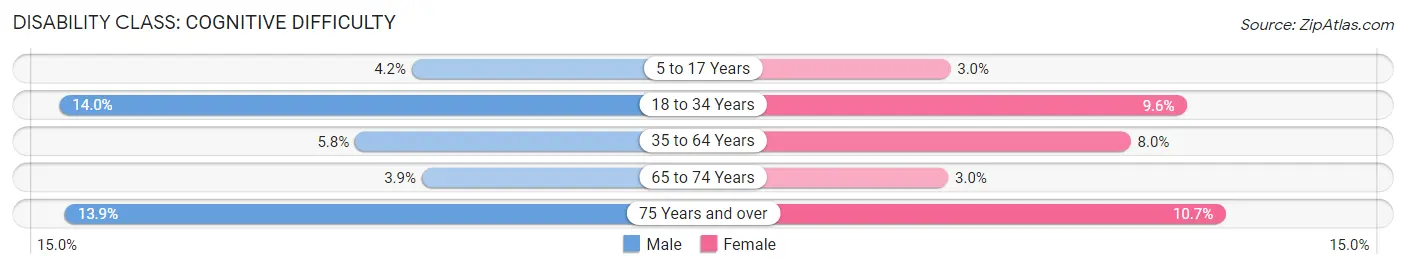
| Age Bracket | Male | Female |
| 5 to 17 Years | 23 (4.2%) | 11 (3.0%) |
| 18 to 34 Years | 63 (14.0%) | 28 (9.6%) |
| 35 to 64 Years | 60 (5.8%) | 84 (8.0%) |
| 65 to 74 Years | 14 (3.9%) | 11 (3.0%) |
| 75 Years and over | 34 (13.9%) | 35 (10.7%) |
Disability Class: Ambulatory Difficulty
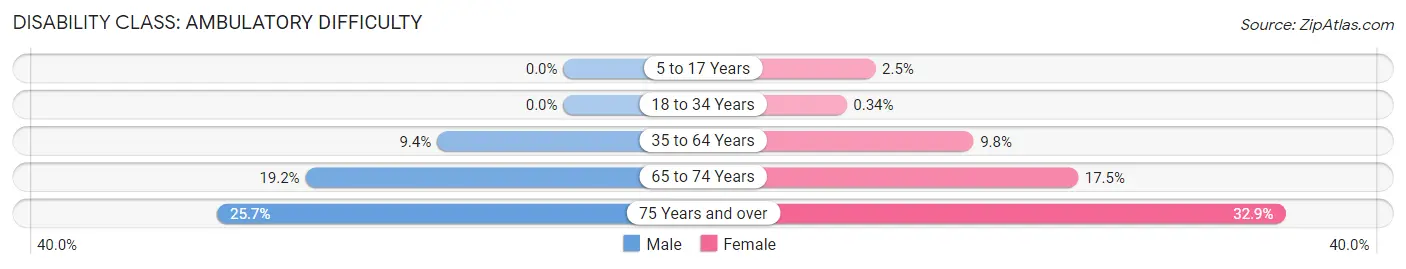
| Age Bracket | Male | Female |
| 5 to 17 Years | 0 (0.0%) | 9 (2.5%) |
| 18 to 34 Years | 0 (0.0%) | 1 (0.3%) |
| 35 to 64 Years | 97 (9.4%) | 102 (9.8%) |
| 65 to 74 Years | 68 (19.2%) | 65 (17.5%) |
| 75 Years and over | 63 (25.7%) | 108 (32.9%) |
Disability Class: Self-Care Difficulty
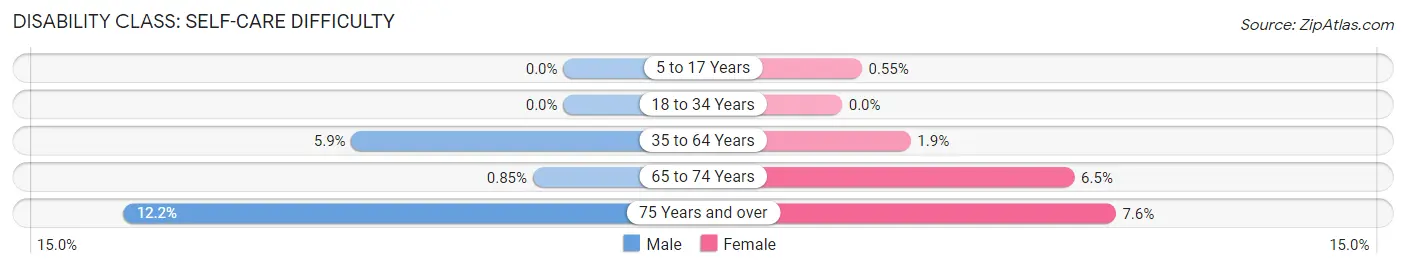
| Age Bracket | Male | Female |
| 5 to 17 Years | 0 (0.0%) | 2 (0.5%) |
| 18 to 34 Years | 0 (0.0%) | 0 (0.0%) |
| 35 to 64 Years | 61 (5.9%) | 20 (1.9%) |
| 65 to 74 Years | 3 (0.9%) | 24 (6.5%) |
| 75 Years and over | 30 (12.2%) | 25 (7.6%) |
Technology Access in Morris County
Computing Device Access in Morris County
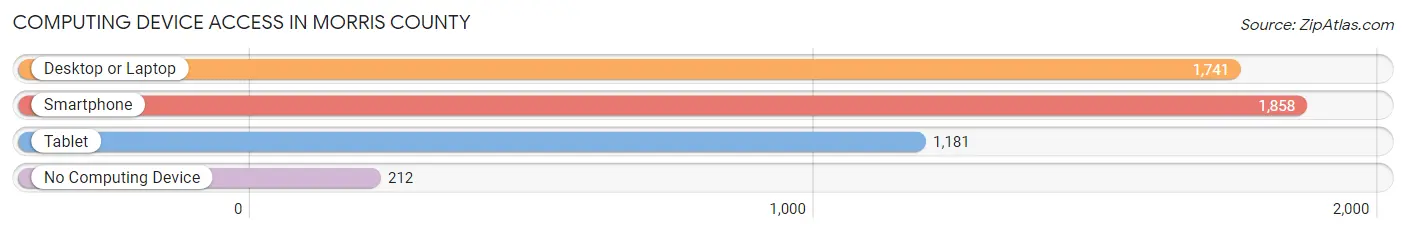
| Device Type | # Households | % Households |
| Desktop or Laptop | 1,741 | 76.1% |
| Smartphone | 1,858 | 81.2% |
| Tablet | 1,181 | 51.6% |
| No Computing Device | 212 | 9.3% |
| Total | 2,288 | 100.0% |
Internet Access in Morris County
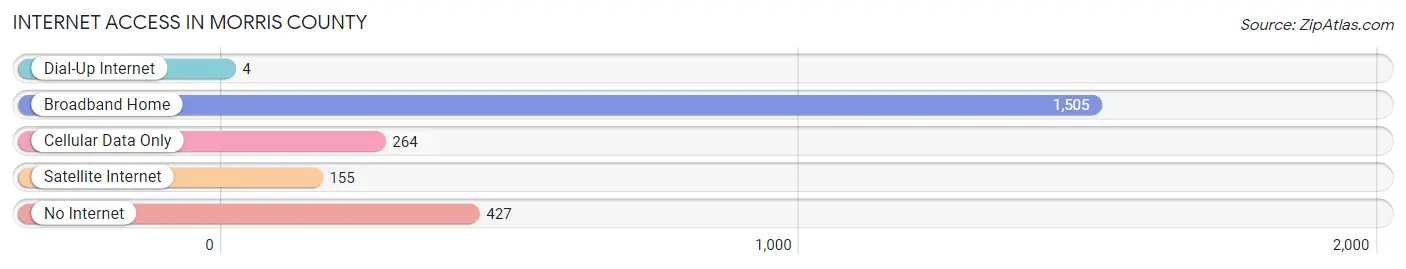
| Internet Type | # Households | % Households |
| Dial-Up Internet | 4 | 0.2% |
| Broadband Home | 1,505 | 65.8% |
| Cellular Data Only | 264 | 11.5% |
| Satellite Internet | 155 | 6.8% |
| No Internet | 427 | 18.7% |
| Total | 2,288 | 100.0% |
Morris County Summary
Morris County, Kansas is located in the north-central part of the state and is bordered by the counties of Washington, Clay, Cloud, Ottawa, and Lincoln. The county seat is Council Grove, and the largest city is Council Grove. The county was named after Thomas Morris, a U.S. Senator from Ohio.
Geography
Morris County is located in the Flint Hills region of Kansas. The county has a total area of 576 square miles, of which 575 square miles is land and 1 square mile is water. The county is drained by the Neosho River and its tributaries. The highest point in the county is located in the northwest corner, at an elevation of 1,890 feet. The county is mostly rolling hills, with some flat areas in the valleys.
The climate of Morris County is characterized by hot, humid summers and cold, dry winters. The average annual temperature is 54 degrees Fahrenheit, and the average annual precipitation is about 30 inches.
Demographics
As of the 2010 census, there were 6,719 people, 2,717 households, and 1,845 families residing in the county. The population density was 11.7 people per square mile. The racial makeup of the county was 95.3% White, 0.7% Black or African American, 0.5% Native American, 0.3% Asian, 0.1% Pacific Islander, 1.7% from other races, and 1.4% from two or more races. Hispanic or Latino of any race were 4.2% of the population.
The median income for a household in the county was $41,945, and the median income for a family was $50,945. The per capita income for the county was $20,945. About 11.2% of families and 14.2% of the population were below the poverty line, including 19.2% of those under age 18 and 8.2% of those age 65 or over.
Economy
The economy of Morris County is largely based on agriculture. The county is home to several large farms, and the main crops grown are wheat, corn, soybeans, and sorghum. Cattle and hogs are also raised in the county.
The county is also home to several small businesses, including a few restaurants, a few retail stores, and a few service businesses. The county also has a few manufacturing businesses, including a furniture factory and a plastics factory.
The county is served by two airports, Council Grove Municipal Airport and Morris County Airport. The county is also served by two railroads, the Union Pacific and the Burlington Northern Santa Fe.
History
Morris County was established in 1855 and was named after Thomas Morris, a U.S. Senator from Ohio. The county was originally part of the Osage Indian Reservation, and the first settlers arrived in the area in the late 1850s.
The county was home to several Native American tribes, including the Kaw, Osage, and Pawnee. The county was also home to several military forts, including Fort Riley, Fort Larned, and Fort Harker.
The county was also home to several famous people, including Wild Bill Hickok, who was born in the county in 1837. The county was also home to several famous outlaws, including Jesse James and the Younger brothers.
The county was also home to several famous battles, including the Battle of Council Grove in 1864 and the Battle of Little Blue in 1868. The county was also home to several famous trails, including the Santa Fe Trail, the Oregon Trail, and the California Trail.
Today, Morris County is a rural county with a population of about 6,700 people. The county is home to several small towns, including Council Grove, White City, and Dunlap. The county is also home to several state parks, including Council Grove State Park and White City State Park.
Common Questions
What is Per Capita Income in Morris County?
Per Capita income in Morris County is $32,462.
What is the Median Family Income in Morris County?
Median Family Income in Morris County is $71,776.
What is the Median Household income in Morris County?
Median Household Income in Morris County is $52,866.
What is Income or Wage Gap in Morris County?
Income or Wage Gap in Morris County is 20.9%.
Women in Morris County earn 79.1 cents for every dollar earned by a man.
What is Inequality or Gini Index in Morris County?
Inequality or Gini Index in Morris County is 0.45.
What is the Total Population of Morris County?
Total Population of Morris County is 5,385.
What is the Total Male Population of Morris County?
Total Male Population of Morris County is 2,791.
What is the Total Female Population of Morris County?
Total Female Population of Morris County is 2,594.
What is the Ratio of Males per 100 Females in Morris County?
There are 107.59 Males per 100 Females in Morris County.
What is the Ratio of Females per 100 Males in Morris County?
There are 92.94 Females per 100 Males in Morris County.
What is the Median Population Age in Morris County?
Median Population Age in Morris County is 46.5 Years.
What is the Average Family Size in Morris County
Average Family Size in Morris County is 2.9 People.
What is the Average Household Size in Morris County
Average Household Size in Morris County is 2.3 People.
How Large is the Labor Force in Morris County?
There are 2,700 People in the Labor Forcein in Morris County.
What is the Percentage of People in the Labor Force in Morris County?
62.2% of People are in the Labor Force in Morris County.
What is the Unemployment Rate in Morris County?
Unemployment Rate in Morris County is 2.1%.