Lane County, KS Map & Demographics
Lane County Map
Lane County Overview
$35,779
PER CAPITA INCOME
$84,107
AVG FAMILY INCOME
$52,222
AVG HOUSEHOLD INCOME
35.3%
WAGE / INCOME GAP [ % ]
64.7¢/ $1
WAGE / INCOME GAP [ $ ]
0.45
INEQUALITY / GINI INDEX
1,528
TOTAL POPULATION
754
MALE POPULATION
774
FEMALE POPULATION
97.42
MALES / 100 FEMALES
102.65
FEMALES / 100 MALES
47.9
MEDIAN AGE
2.9
AVG FAMILY SIZE
2.3
AVG HOUSEHOLD SIZE
803
LABOR FORCE [ PEOPLE ]
64.1%
PERCENT IN LABOR FORCE
0.4%
UNEMPLOYMENT RATE
Income in Lane County
Income Overview in Lane County
Per Capita Income in Lane County is $35,779, while median incomes of families and households are $84,107 and $52,222 respectively.
| Characteristic | Number | Measure |
| Per Capita Income | 1,528 | $35,779 |
| Median Family Income | 421 | $84,107 |
| Mean Family Income | 421 | $97,942 |
| Median Household Income | 672 | $52,222 |
| Mean Household Income | 672 | $75,972 |
| Income Deficit | 421 | $0 |
| Wage / Income Gap (%) | 1,528 | 35.26% |
| Wage / Income Gap ($) | 1,528 | 64.74¢ per $1 |
| Gini / Inequality Index | 1,528 | 0.45 |
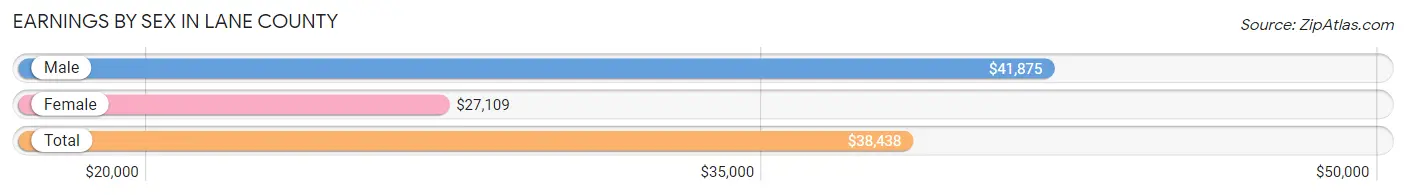
Earnings by Sex in Lane County
Average Earnings in Lane County are $38,438, $41,875 for men and $27,109 for women, a difference of 35.3%.
| Sex | Number | Average Earnings |
| Male | 434 (50.4%) | $41,875 |
| Female | 427 (49.6%) | $27,109 |
| Total | 861 (100.0%) | $38,438 |
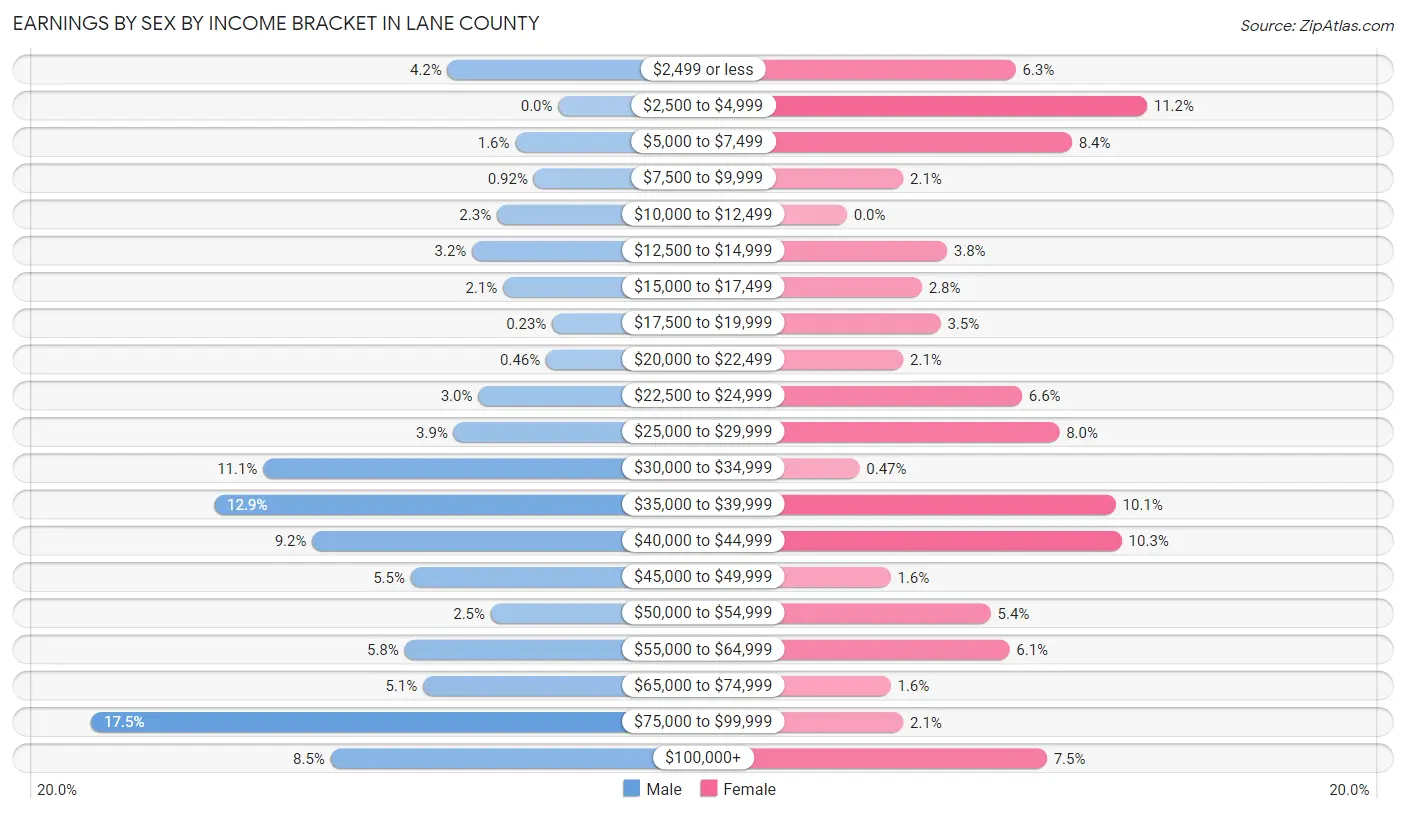
Earnings by Sex by Income Bracket in Lane County
The most common earnings brackets in Lane County are $75,000 to $99,999 for men (76 | 17.5%) and $2,500 to $4,999 for women (48 | 11.2%).
| Income | Male | Female |
| $2,499 or less | 18 (4.2%) | 27 (6.3%) |
| $2,500 to $4,999 | 0 (0.0%) | 48 (11.2%) |
| $5,000 to $7,499 | 7 (1.6%) | 36 (8.4%) |
| $7,500 to $9,999 | 4 (0.9%) | 9 (2.1%) |
| $10,000 to $12,499 | 10 (2.3%) | 0 (0.0%) |
| $12,500 to $14,999 | 14 (3.2%) | 16 (3.7%) |
| $15,000 to $17,499 | 9 (2.1%) | 12 (2.8%) |
| $17,500 to $19,999 | 1 (0.2%) | 15 (3.5%) |
| $20,000 to $22,499 | 2 (0.5%) | 9 (2.1%) |
| $22,500 to $24,999 | 13 (3.0%) | 28 (6.6%) |
| $25,000 to $29,999 | 17 (3.9%) | 34 (8.0%) |
| $30,000 to $34,999 | 48 (11.1%) | 2 (0.5%) |
| $35,000 to $39,999 | 56 (12.9%) | 43 (10.1%) |
| $40,000 to $44,999 | 40 (9.2%) | 44 (10.3%) |
| $45,000 to $49,999 | 24 (5.5%) | 7 (1.6%) |
| $50,000 to $54,999 | 11 (2.5%) | 23 (5.4%) |
| $55,000 to $64,999 | 25 (5.8%) | 26 (6.1%) |
| $65,000 to $74,999 | 22 (5.1%) | 7 (1.6%) |
| $75,000 to $99,999 | 76 (17.5%) | 9 (2.1%) |
| $100,000+ | 37 (8.5%) | 32 (7.5%) |
| Total | 434 (100.0%) | 427 (100.0%) |
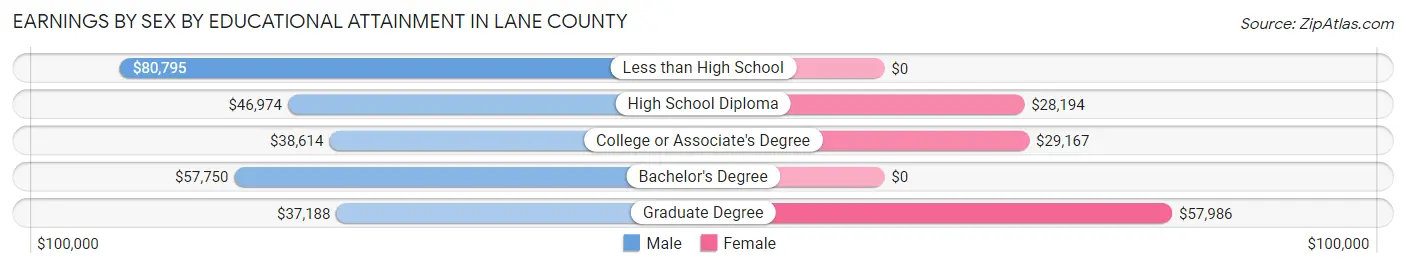
Earnings by Sex by Educational Attainment in Lane County
Average earnings in Lane County are $43,750 for men and $37,250 for women, a difference of 14.9%. Men with an educational attainment of less than high school enjoy the highest average annual earnings of $80,795, while those with graduate degree education earn the least with $37,188. Women with an educational attainment of graduate degree earn the most with the average annual earnings of $57,986, while those with high school diploma education have the smallest earnings of $28,194.
| Educational Attainment | Male Income | Female Income |
| Less than High School | $80,795 | $0 |
| High School Diploma | $46,974 | $28,194 |
| College or Associate's Degree | $38,614 | $29,167 |
| Bachelor's Degree | $57,750 | $0 |
| Graduate Degree | $37,188 | $57,986 |
| Total | $43,750 | $37,250 |
Family Income in Lane County
Family Income Brackets in Lane County
According to the Lane County family income data, there are 134 families falling into the $100,000 to $149,999 income range, which is the most common income bracket and makes up 31.8% of all families.
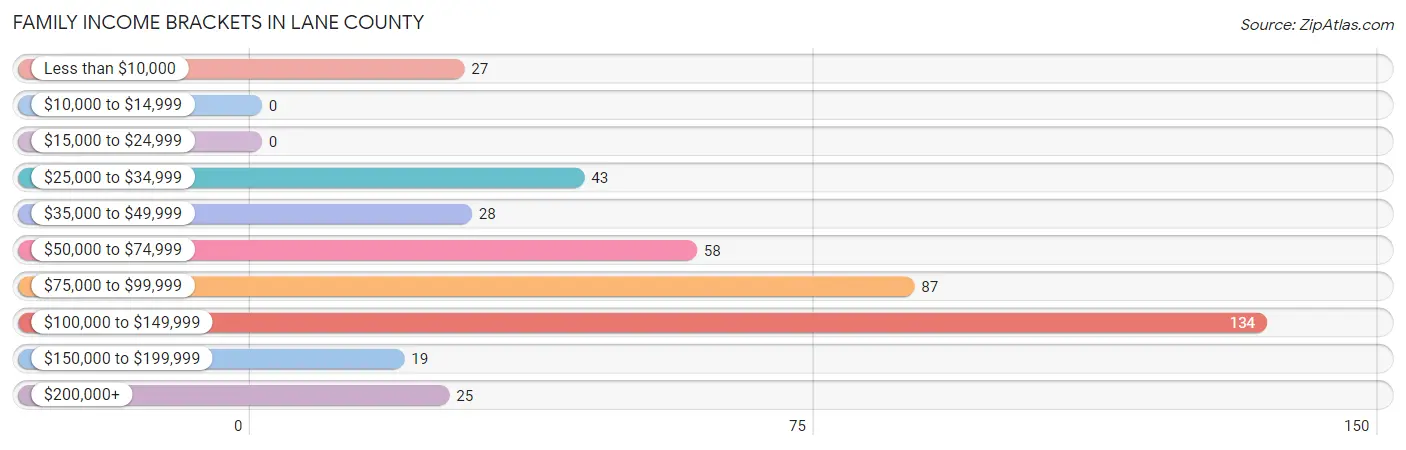
| Income Bracket | # Families | % Families |
| Less than $10,000 | 27 | 6.4% |
| $10,000 to $14,999 | 0 | 0.0% |
| $15,000 to $24,999 | 0 | 0.0% |
| $25,000 to $34,999 | 43 | 10.2% |
| $35,000 to $49,999 | 28 | 6.7% |
| $50,000 to $74,999 | 58 | 13.8% |
| $75,000 to $99,999 | 87 | 20.7% |
| $100,000 to $149,999 | 134 | 31.8% |
| $150,000 to $199,999 | 19 | 4.5% |
| $200,000+ | 25 | 5.9% |
Family Income by Famaliy Size in Lane County
6-person families (18 | 4.3%) account for the highest median family income in Lane County with $123,462 per family, while 2-person families (231 | 54.9%) have the highest median income of $51,682 per family member.
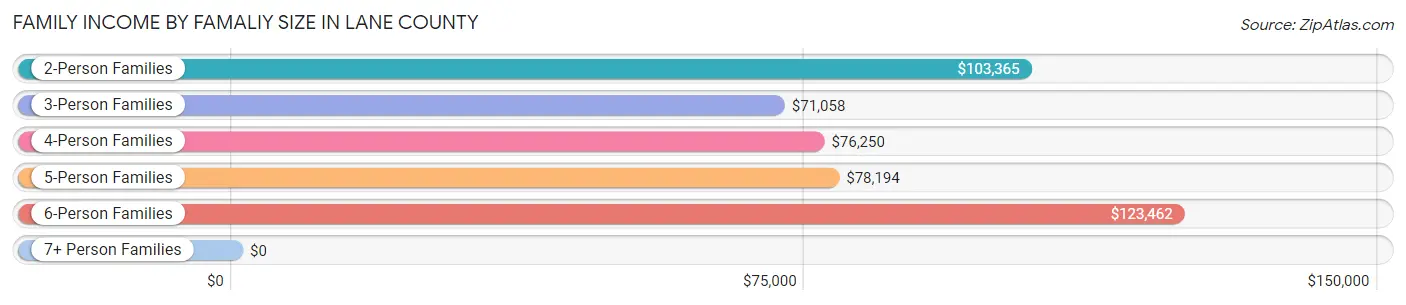
| Income Bracket | # Families | Median Income |
| 2-Person Families | 231 (54.9%) | $103,365 |
| 3-Person Families | 55 (13.1%) | $71,058 |
| 4-Person Families | 71 (16.9%) | $76,250 |
| 5-Person Families | 42 (10.0%) | $78,194 |
| 6-Person Families | 18 (4.3%) | $123,462 |
| 7+ Person Families | 4 (0.9%) | $0 |
| Total | 421 (100.0%) | $84,107 |
Family Income by Number of Earners in Lane County
The median family income in Lane County is $84,107, with families comprising 2 earners (174) having the highest median family income of $98,333, while families with no earners (42) have the lowest median family income of $76,429, accounting for 41.3% and 10.0% of families, respectively.
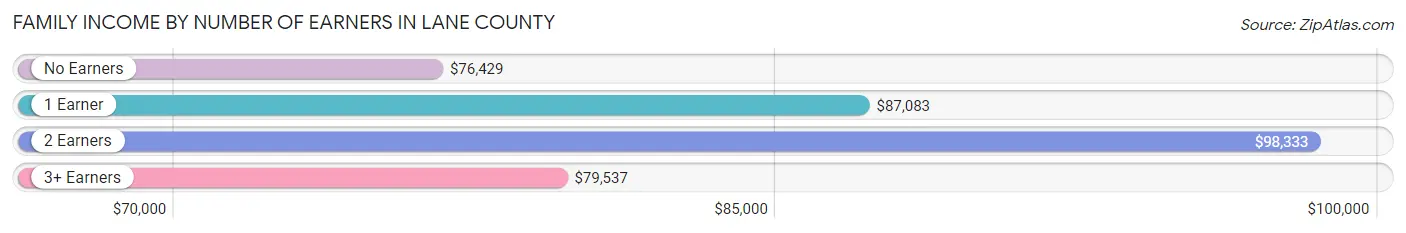
| Number of Earners | # Families | Median Income |
| No Earners | 42 (10.0%) | $76,429 |
| 1 Earner | 153 (36.3%) | $87,083 |
| 2 Earners | 174 (41.3%) | $98,333 |
| 3+ Earners | 52 (12.3%) | $79,537 |
| Total | 421 (100.0%) | $84,107 |
Household Income in Lane County
Household Income Brackets in Lane County
With 152 households falling in the category, the $100,000 to $149,999 income range is the most frequent in Lane County, accounting for 22.6% of all households. In contrast, only 20 households (3.0%) fall into the $150,000 to $199,999 income bracket, making it the least populous group.
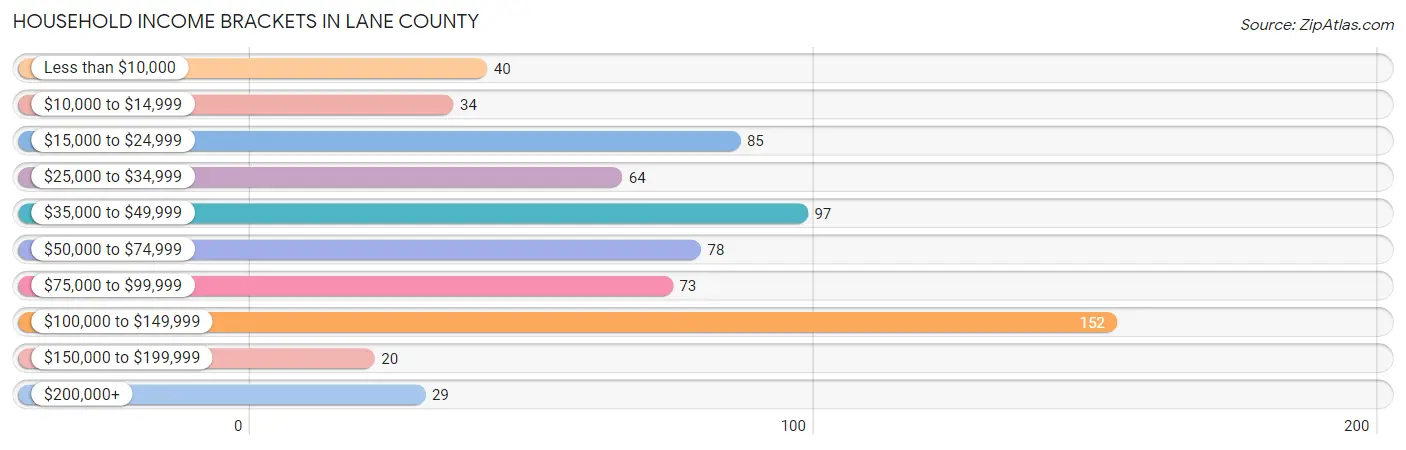
| Income Bracket | # Households | % Households |
| Less than $10,000 | 40 | 6.0% |
| $10,000 to $14,999 | 34 | 5.1% |
| $15,000 to $24,999 | 85 | 12.6% |
| $25,000 to $34,999 | 64 | 9.5% |
| $35,000 to $49,999 | 97 | 14.4% |
| $50,000 to $74,999 | 78 | 11.6% |
| $75,000 to $99,999 | 73 | 10.9% |
| $100,000 to $149,999 | 152 | 22.6% |
| $150,000 to $199,999 | 20 | 3.0% |
| $200,000+ | 29 | 4.3% |
Household Income by Householder Age in Lane County
The median household income in Lane County is $52,222, with the highest median household income of $71,346 found in the 45 to 64 years age bracket for the primary householder. A total of 220 households (32.7%) fall into this category. Meanwhile, the 15 to 24 years age bracket for the primary householder has the lowest median household income of $0, with 51 households (7.6%) in this group.
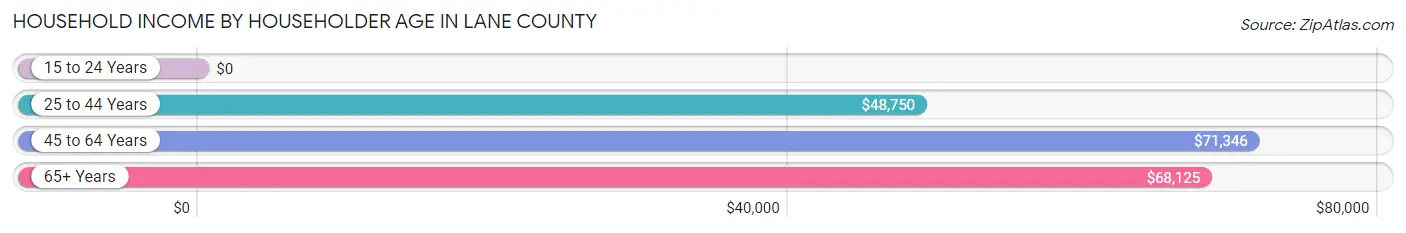
| Income Bracket | # Households | Median Income |
| 15 to 24 Years | 51 (7.6%) | $0 |
| 25 to 44 Years | 169 (25.2%) | $48,750 |
| 45 to 64 Years | 220 (32.7%) | $71,346 |
| 65+ Years | 232 (34.5%) | $68,125 |
| Total | 672 (100.0%) | $52,222 |
Poverty in Lane County
Income Below Poverty by Sex and Age in Lane County
With 8.3% poverty level for males and 9.7% for females among the residents of Lane County, 15 year old males and 18 to 24 year old females are the most vulnerable to poverty, with 2 males (100.0%) and 28 females (35.0%) in their respective age groups living below the poverty level.
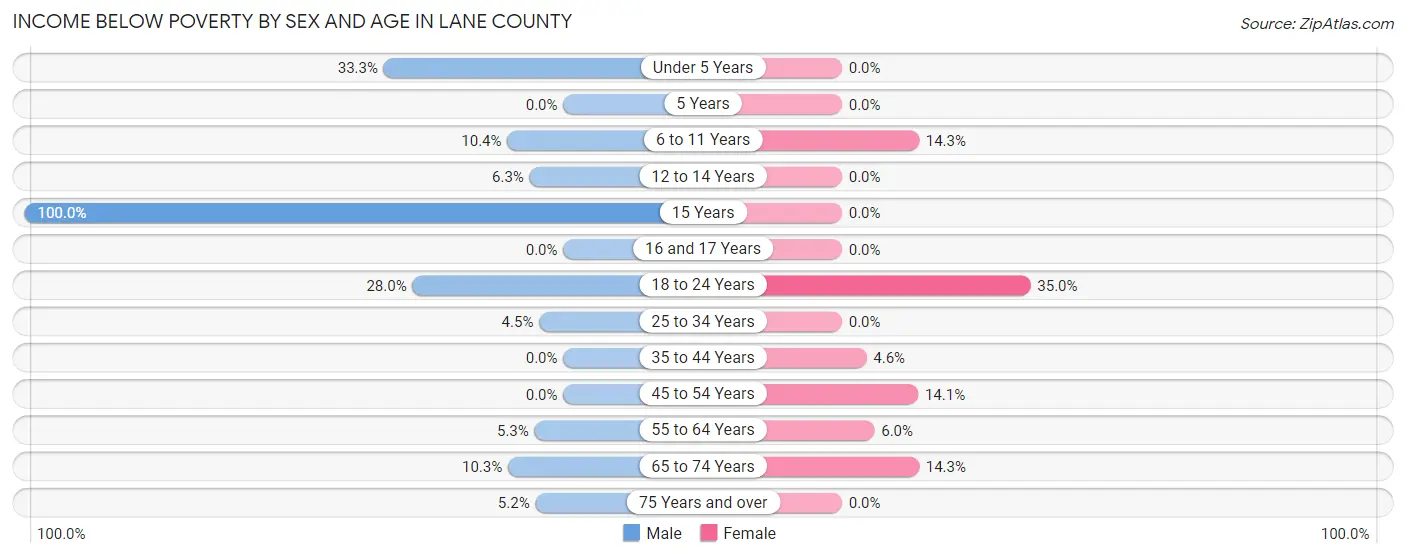
| Age Bracket | Male | Female |
| Under 5 Years | 11 (33.3%) | 0 (0.0%) |
| 5 Years | 0 (0.0%) | 0 (0.0%) |
| 6 to 11 Years | 8 (10.4%) | 9 (14.3%) |
| 12 to 14 Years | 2 (6.2%) | 0 (0.0%) |
| 15 Years | 2 (100.0%) | 0 (0.0%) |
| 16 and 17 Years | 0 (0.0%) | 0 (0.0%) |
| 18 to 24 Years | 14 (28.0%) | 28 (35.0%) |
| 25 to 34 Years | 3 (4.5%) | 0 (0.0%) |
| 35 to 44 Years | 0 (0.0%) | 4 (4.5%) |
| 45 to 54 Years | 0 (0.0%) | 14 (14.1%) |
| 55 to 64 Years | 7 (5.3%) | 7 (6.0%) |
| 65 to 74 Years | 12 (10.3%) | 13 (14.3%) |
| 75 Years and over | 3 (5.2%) | 0 (0.0%) |
| Total | 62 (8.3%) | 75 (9.7%) |
Income Above Poverty by Sex and Age in Lane County
According to the poverty statistics in Lane County, males aged 5 years and females aged under 5 years are the age groups that are most secure financially, with 100.0% of males and 100.0% of females in these age groups living above the poverty line.
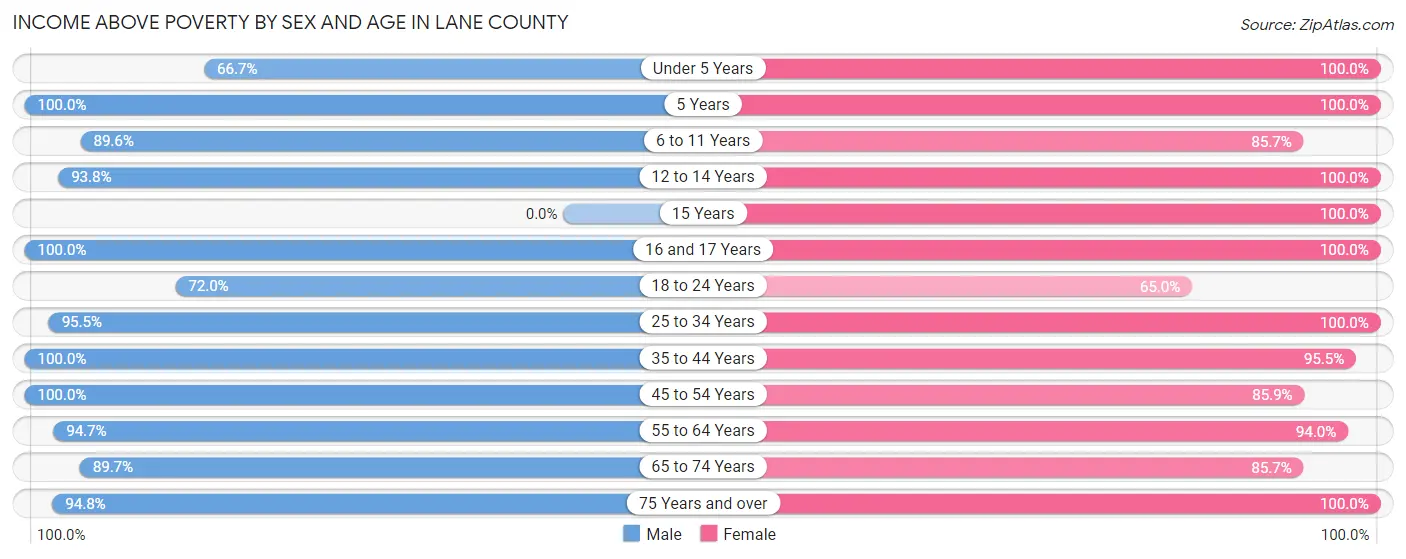
| Age Bracket | Male | Female |
| Under 5 Years | 22 (66.7%) | 29 (100.0%) |
| 5 Years | 1 (100.0%) | 2 (100.0%) |
| 6 to 11 Years | 69 (89.6%) | 54 (85.7%) |
| 12 to 14 Years | 30 (93.8%) | 16 (100.0%) |
| 15 Years | 0 (0.0%) | 21 (100.0%) |
| 16 and 17 Years | 11 (100.0%) | 25 (100.0%) |
| 18 to 24 Years | 36 (72.0%) | 52 (65.0%) |
| 25 to 34 Years | 64 (95.5%) | 75 (100.0%) |
| 35 to 44 Years | 65 (100.0%) | 84 (95.5%) |
| 45 to 54 Years | 105 (100.0%) | 85 (85.9%) |
| 55 to 64 Years | 124 (94.7%) | 109 (94.0%) |
| 65 to 74 Years | 105 (89.7%) | 78 (85.7%) |
| 75 Years and over | 55 (94.8%) | 69 (100.0%) |
| Total | 687 (91.7%) | 699 (90.3%) |
Income Below Poverty Among Married-Couple Families in Lane County
The poverty statistics for married-couple families in Lane County show that 3.1% or 11 of the total 359 families live below the poverty line. Families with 3 or 4 children have the highest poverty rate of 10.0%, comprising of 4 families. On the other hand, families with 1 or 2 children have the lowest poverty rate of 0.0%, which includes 0 families.
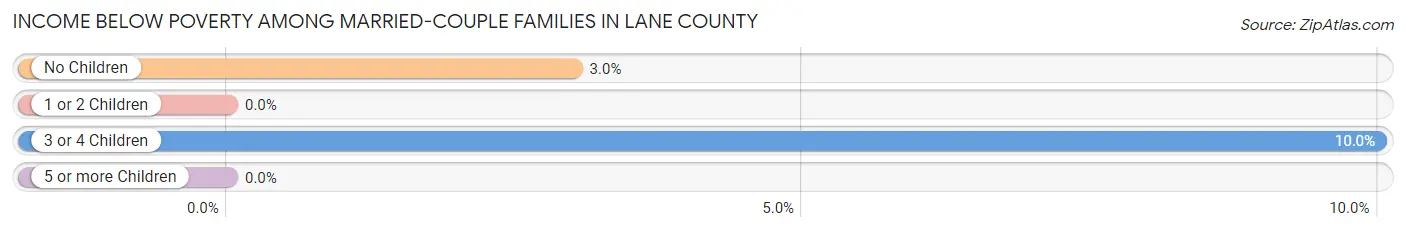
| Children | Above Poverty | Below Poverty |
| No Children | 226 (97.0%) | 7 (3.0%) |
| 1 or 2 Children | 82 (100.0%) | 0 (0.0%) |
| 3 or 4 Children | 36 (90.0%) | 4 (10.0%) |
| 5 or more Children | 4 (100.0%) | 0 (0.0%) |
| Total | 348 (96.9%) | 11 (3.1%) |
Income Below Poverty Among Single-Parent Households in Lane County
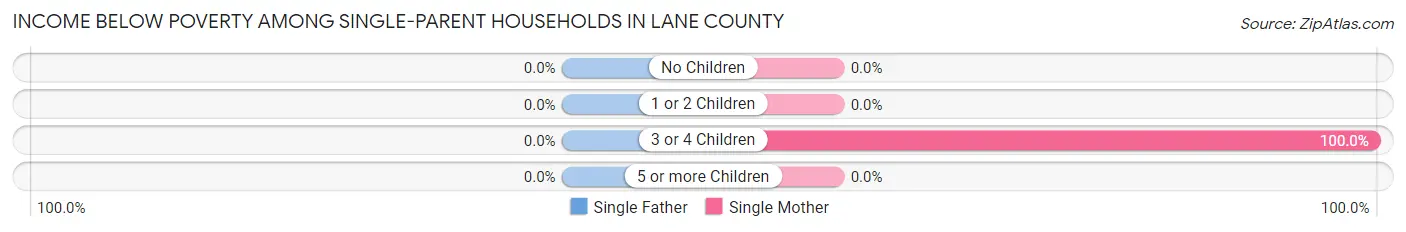
| Children | Single Father | Single Mother |
| No Children | 0 (0.0%) | 0 (0.0%) |
| 1 or 2 Children | 0 (0.0%) | 0 (0.0%) |
| 3 or 4 Children | 0 (0.0%) | 20 (100.0%) |
| 5 or more Children | 0 (0.0%) | 0 (0.0%) |
| Total | 0 (0.0%) | 20 (66.7%) |
Income Below Poverty Among Married-Couple vs Single-Parent Households in Lane County
The poverty data for Lane County shows that 11 of the married-couple family households (3.1%) and 20 of the single-parent households (32.3%) are living below the poverty level. Within the married-couple family households, those with 3 or 4 children have the highest poverty rate, with 4 households (10.0%) falling below the poverty line. Among the single-parent households, those with 3 or 4 children have the highest poverty rate, with 20 household (74.1%) living below poverty.
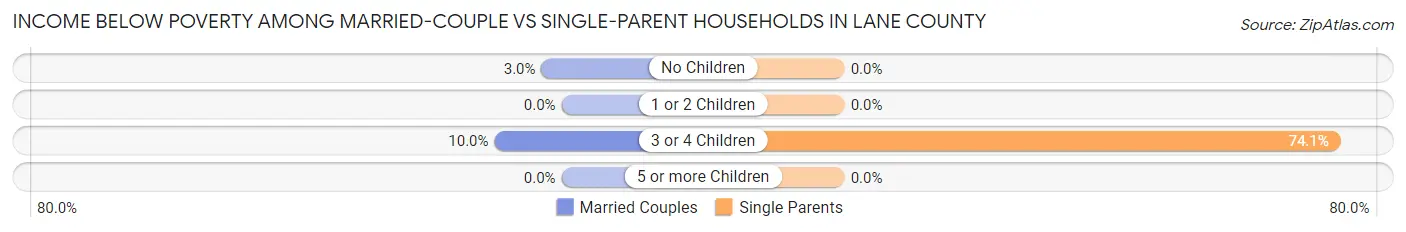
| Children | Married-Couple Families | Single-Parent Households |
| No Children | 7 (3.0%) | 0 (0.0%) |
| 1 or 2 Children | 0 (0.0%) | 0 (0.0%) |
| 3 or 4 Children | 4 (10.0%) | 20 (74.1%) |
| 5 or more Children | 0 (0.0%) | 0 (0.0%) |
| Total | 11 (3.1%) | 20 (32.3%) |
Race in Lane County
The most populous races in Lane County are White / Caucasian (1,388 | 90.8%), Hispanic or Latino (187 | 12.2%), and Some other Race (65 | 4.3%).
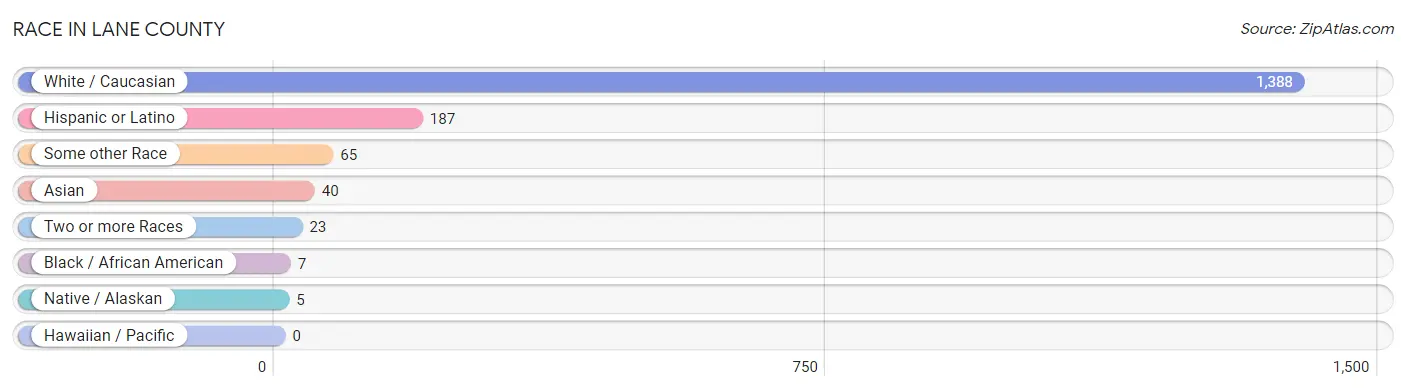
| Race | # Population | % Population |
| Asian | 40 | 2.6% |
| Black / African American | 7 | 0.5% |
| Hawaiian / Pacific | 0 | 0.0% |
| Hispanic or Latino | 187 | 12.2% |
| Native / Alaskan | 5 | 0.3% |
| White / Caucasian | 1,388 | 90.8% |
| Two or more Races | 23 | 1.5% |
| Some other Race | 65 | 4.3% |
| Total | 1,528 | 100.0% |
Ancestry in Lane County
The most populous ancestries reported in Lane County are German (276 | 18.1%), English (258 | 16.9%), Mexican (170 | 11.1%), Irish (118 | 7.7%), and French (55 | 3.6%), together accounting for 57.4% of all Lane County residents.
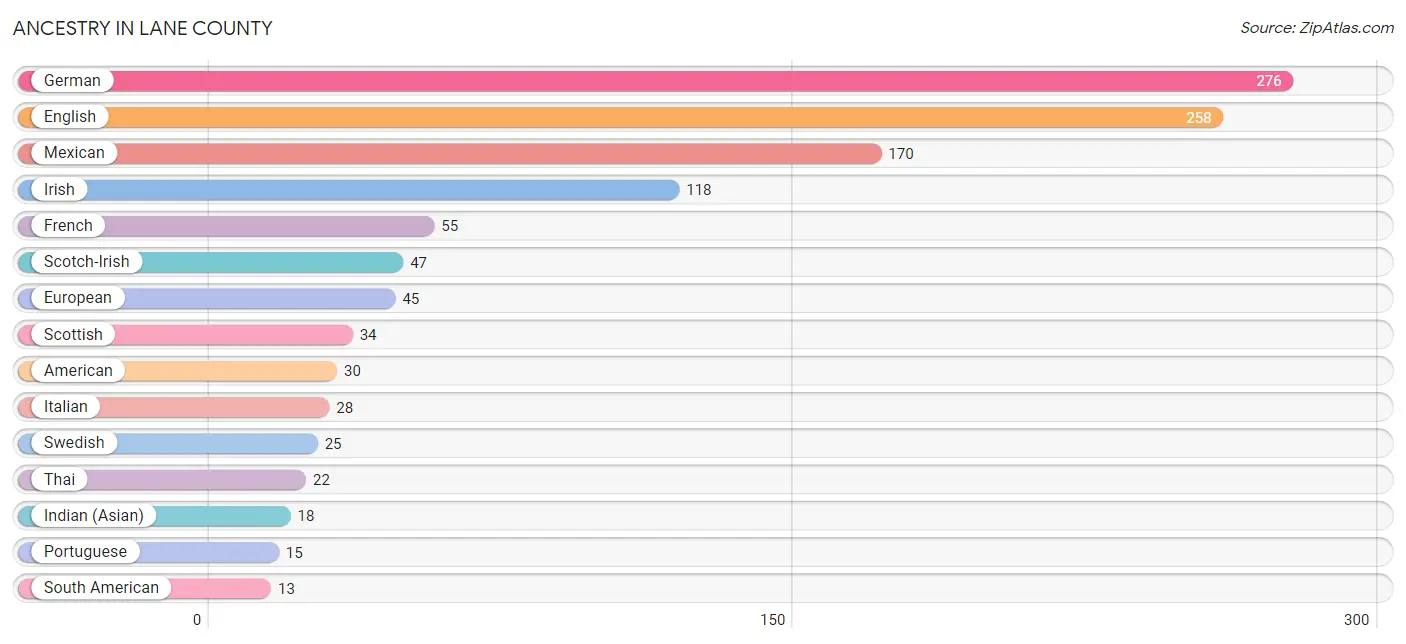
| Ancestry | # Population | % Population |
| American | 30 | 2.0% |
| Arab | 2 | 0.1% |
| Argentinean | 5 | 0.3% |
| British | 2 | 0.1% |
| Dutch | 12 | 0.8% |
| English | 258 | 16.9% |
| European | 45 | 2.9% |
| French | 55 | 3.6% |
| German | 276 | 18.1% |
| Indian (Asian) | 18 | 1.2% |
| Irish | 118 | 7.7% |
| Italian | 28 | 1.8% |
| Lebanese | 2 | 0.1% |
| Lithuanian | 3 | 0.2% |
| Mexican | 170 | 11.1% |
| Northern European | 3 | 0.2% |
| Pennsylvania German | 7 | 0.5% |
| Peruvian | 8 | 0.5% |
| Portuguese | 15 | 1.0% |
| Puerto Rican | 4 | 0.3% |
| Romanian | 3 | 0.2% |
| Russian | 5 | 0.3% |
| Scandinavian | 7 | 0.5% |
| Scotch-Irish | 47 | 3.1% |
| Scottish | 34 | 2.2% |
| South American | 13 | 0.9% |
| Swedish | 25 | 1.6% |
| Thai | 22 | 1.4% | View All 28 Rows |
Immigrants in Lane County
The most numerous immigrant groups reported in Lane County came from Latin America (68 | 4.4%), Central America (63 | 4.1%), Mexico (63 | 4.1%), Asia (40 | 2.6%), and India (22 | 1.4%), together accounting for 16.8% of all Lane County residents.
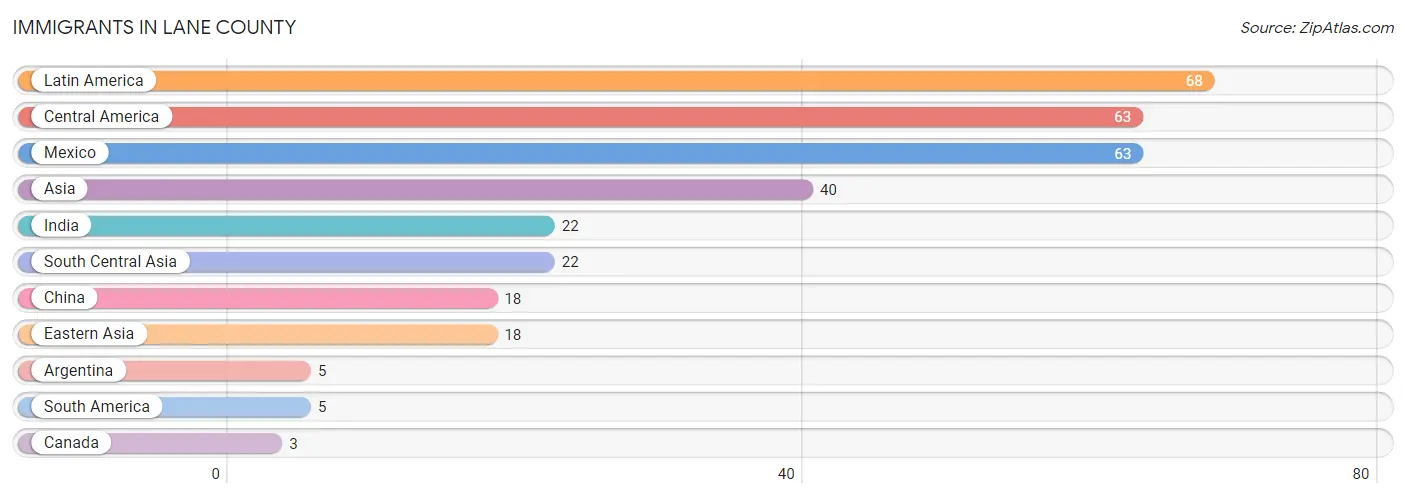
| Immigration Origin | # Population | % Population |
| Argentina | 5 | 0.3% |
| Asia | 40 | 2.6% |
| Canada | 3 | 0.2% |
| Central America | 63 | 4.1% |
| China | 18 | 1.2% |
| Eastern Asia | 18 | 1.2% |
| India | 22 | 1.4% |
| Latin America | 68 | 4.4% |
| Mexico | 63 | 4.1% |
| South America | 5 | 0.3% |
| South Central Asia | 22 | 1.4% | View All 11 Rows |
Sex and Age in Lane County
Sex and Age in Lane County
The most populous age groups in Lane County are 55 to 59 Years (116 | 15.4%) for men and 15 to 19 Years (89 | 11.5%) for women.
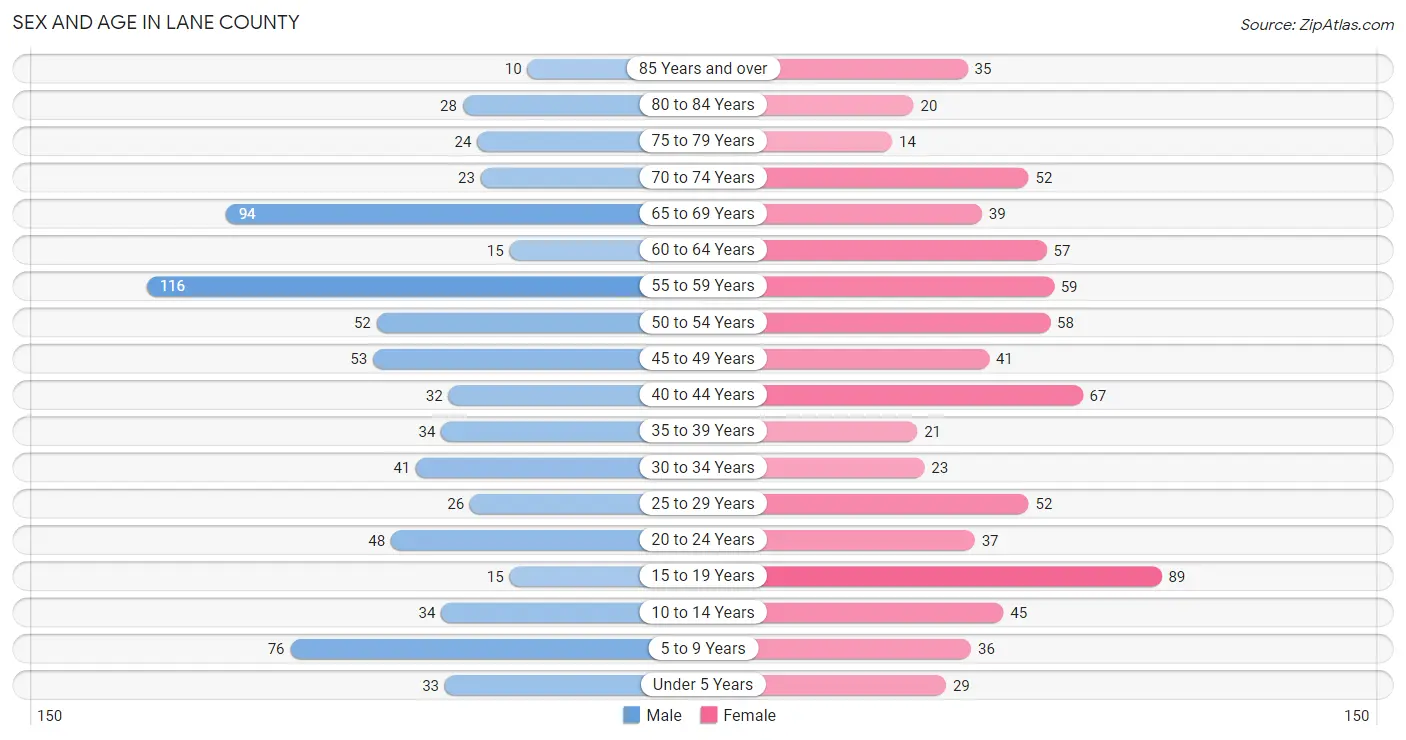
| Age Bracket | Male | Female |
| Under 5 Years | 33 (4.4%) | 29 (3.7%) |
| 5 to 9 Years | 76 (10.1%) | 36 (4.6%) |
| 10 to 14 Years | 34 (4.5%) | 45 (5.8%) |
| 15 to 19 Years | 15 (2.0%) | 89 (11.5%) |
| 20 to 24 Years | 48 (6.4%) | 37 (4.8%) |
| 25 to 29 Years | 26 (3.5%) | 52 (6.7%) |
| 30 to 34 Years | 41 (5.4%) | 23 (3.0%) |
| 35 to 39 Years | 34 (4.5%) | 21 (2.7%) |
| 40 to 44 Years | 32 (4.2%) | 67 (8.7%) |
| 45 to 49 Years | 53 (7.0%) | 41 (5.3%) |
| 50 to 54 Years | 52 (6.9%) | 58 (7.5%) |
| 55 to 59 Years | 116 (15.4%) | 59 (7.6%) |
| 60 to 64 Years | 15 (2.0%) | 57 (7.4%) |
| 65 to 69 Years | 94 (12.5%) | 39 (5.0%) |
| 70 to 74 Years | 23 (3.0%) | 52 (6.7%) |
| 75 to 79 Years | 24 (3.2%) | 14 (1.8%) |
| 80 to 84 Years | 28 (3.7%) | 20 (2.6%) |
| 85 Years and over | 10 (1.3%) | 35 (4.5%) |
| Total | 754 (100.0%) | 774 (100.0%) |
Families and Households in Lane County
Median Family Size in Lane County
The median family size in Lane County is 2.90 persons per family, with married-couple families (359 | 85.3%) accounting for the largest median family size of 2.96 persons per family. On the other hand, single female/mother families (30 | 7.1%) represent the smallest median family size with 2.30 persons per family.
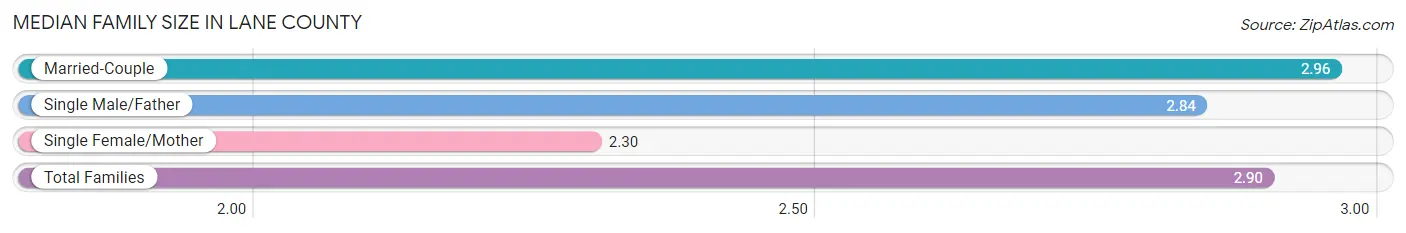
| Family Type | # Families | Family Size |
| Married-Couple | 359 (85.3%) | 2.96 |
| Single Male/Father | 32 (7.6%) | 2.84 |
| Single Female/Mother | 30 (7.1%) | 2.30 |
| Total Families | 421 (100.0%) | 2.90 |
Median Household Size in Lane County
The median household size in Lane County is 2.27 persons per household, with single male/father households (32 | 4.8%) accounting for the largest median household size of 3.31 persons per household. non-family households (251 | 37.3%) represent the smallest median household size with 1.12 persons per household.
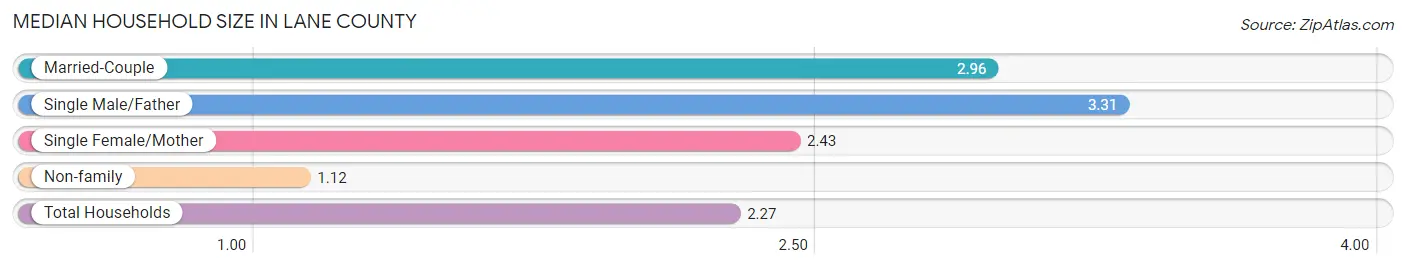
| Household Type | # Households | Household Size |
| Married-Couple | 359 (53.4%) | 2.96 |
| Single Male/Father | 32 (4.8%) | 3.31 |
| Single Female/Mother | 30 (4.5%) | 2.43 |
| Non-family | 251 (37.3%) | 1.12 |
| Total Households | 672 (100.0%) | 2.27 |
Household Size by Marriage Status in Lane County
Out of a total of 672 households in Lane County, 421 (62.6%) are family households, while 251 (37.3%) are nonfamily households. The most numerous type of family households are 2-person households, comprising 231, and the most common type of nonfamily households are 1-person households, comprising 232.
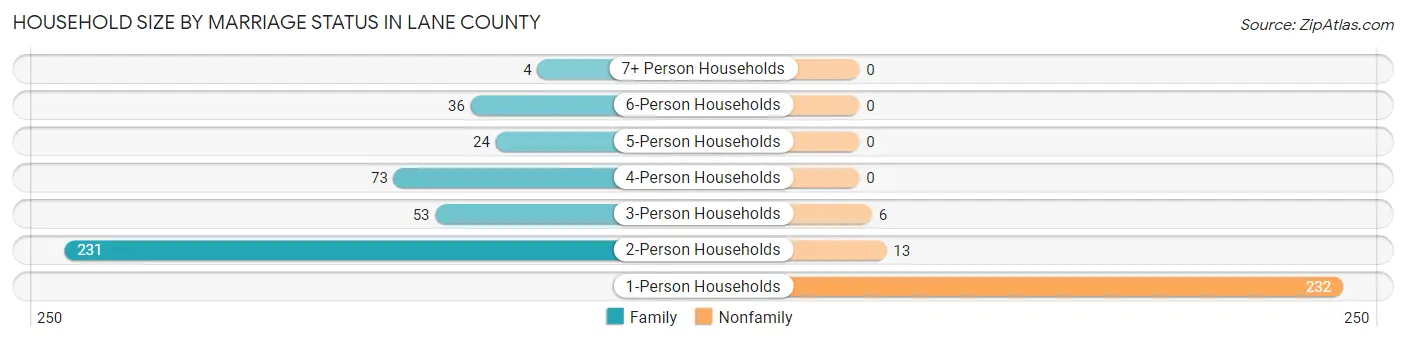
| Household Size | Family Households | Nonfamily Households |
| 1-Person Households | - | 232 (34.5%) |
| 2-Person Households | 231 (34.4%) | 13 (1.9%) |
| 3-Person Households | 53 (7.9%) | 6 (0.9%) |
| 4-Person Households | 73 (10.9%) | 0 (0.0%) |
| 5-Person Households | 24 (3.6%) | 0 (0.0%) |
| 6-Person Households | 36 (5.4%) | 0 (0.0%) |
| 7+ Person Households | 4 (0.6%) | 0 (0.0%) |
| Total | 421 (62.6%) | 251 (37.3%) |
Female Fertility in Lane County
Fertility by Age in Lane County
Average fertility rate in Lane County is 54.0 births per 1,000 women. Women in the age bracket of 20 to 34 years have the highest fertility rate with 161.0 births per 1,000 women. Women in the age bracket of 20 to 34 years acount for 100.0% of all women with births.
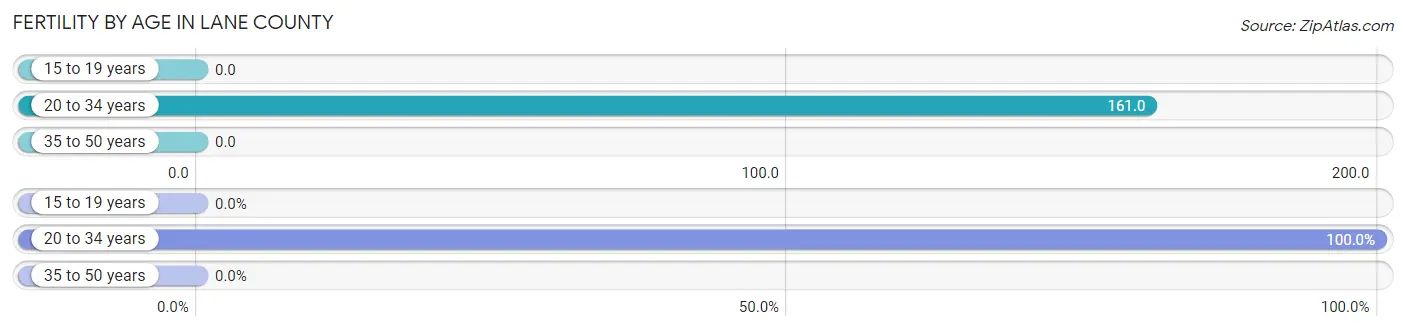
| Age Bracket | Women with Births | Births / 1,000 Women |
| 15 to 19 years | 0 (0.0%) | 0.0 |
| 20 to 34 years | 18 (100.0%) | 161.0 |
| 35 to 50 years | 0 (0.0%) | 0.0 |
| Total | 18 (100.0%) | 54.0 |
Fertility by Age by Marriage Status in Lane County
88.9% of women with births (18) in Lane County are married. The highest percentage of unmarried women with births falls into 20 to 34 years age bracket with 11.1% of them unmarried at the time of birth, while the lowest percentage of unmarried women with births belong to 20 to 34 years age bracket with 11.1% of them unmarried.
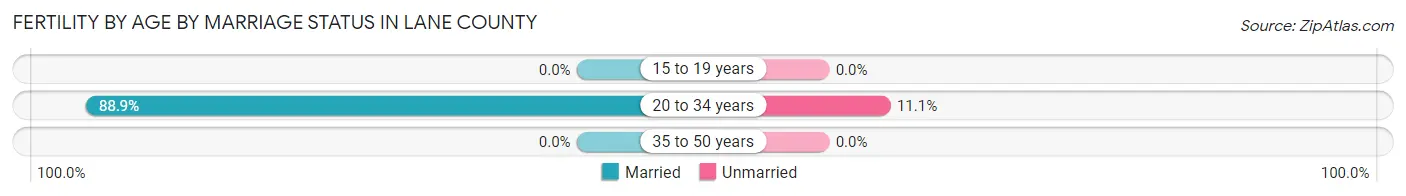
| Age Bracket | Married | Unmarried |
| 15 to 19 years | 0 (0.0%) | 0 (0.0%) |
| 20 to 34 years | 16 (88.9%) | 2 (11.1%) |
| 35 to 50 years | 0 (0.0%) | 0 (0.0%) |
| Total | 16 (88.9%) | 2 (11.1%) |
Fertility by Education in Lane County
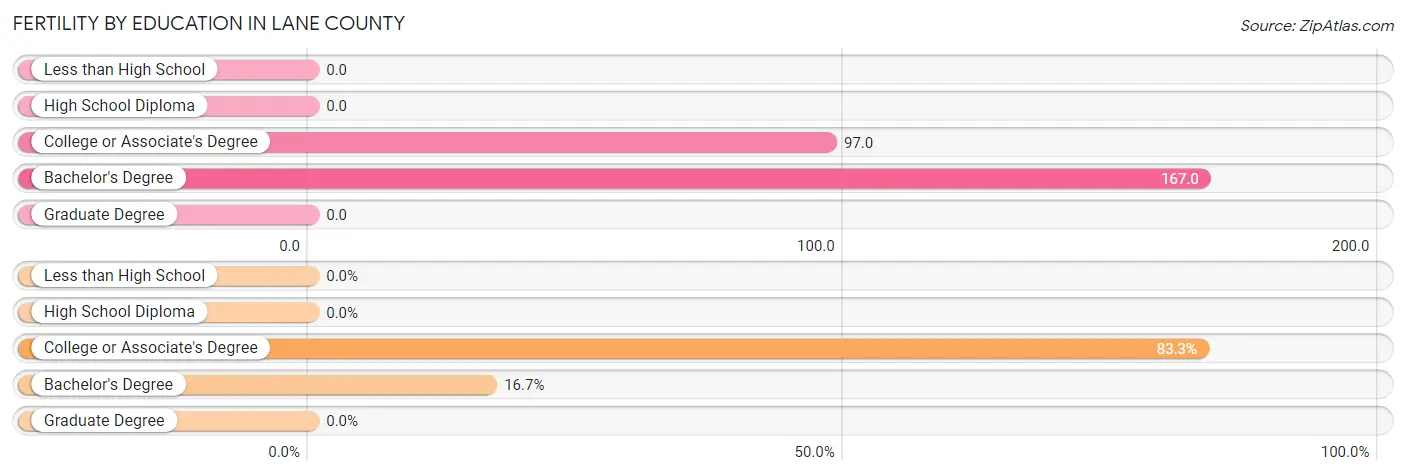
| Educational Attainment | Women with Births | Births / 1,000 Women |
| Less than High School | 0 (0.0%) | 0.0 |
| High School Diploma | 0 (0.0%) | 0.0 |
| College or Associate's Degree | 15 (83.3%) | 97.0 |
| Bachelor's Degree | 3 (16.7%) | 167.0 |
| Graduate Degree | 0 (0.0%) | 0.0 |
| Total | 18 (100.0%) | 54.0 |
Fertility by Education by Marriage Status in Lane County
11.1% of women with births in Lane County are unmarried. Women with the educational attainment of bachelor's degree are most likely to be married with 100.0% of them married at childbirth, while women with the educational attainment of college or associate's degree are least likely to be married with 13.3% of them unmarried at childbirth.
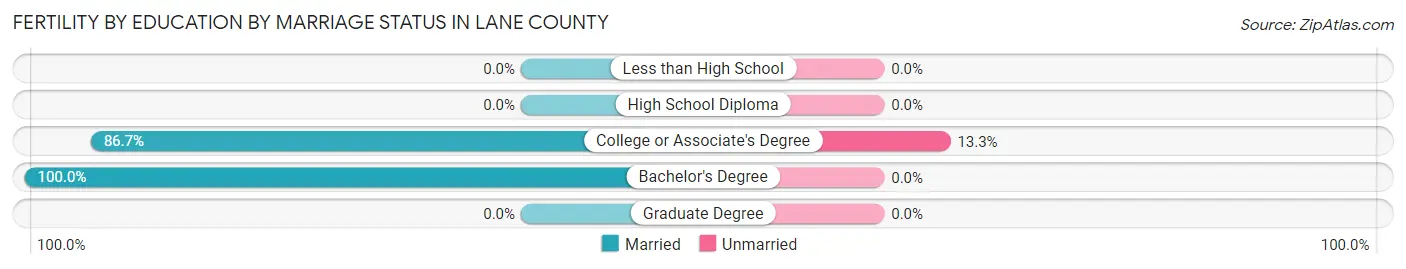
| Educational Attainment | Married | Unmarried |
| Less than High School | 0 (0.0%) | 0 (0.0%) |
| High School Diploma | 0 (0.0%) | 0 (0.0%) |
| College or Associate's Degree | 13 (86.7%) | 2 (13.3%) |
| Bachelor's Degree | 3 (100.0%) | 0 (0.0%) |
| Graduate Degree | 0 (0.0%) | 0 (0.0%) |
| Total | 16 (88.9%) | 2 (11.1%) |
Employment Characteristics in Lane County
Employment by Class of Employer in Lane County
Among the 782 employed individuals in Lane County, private company employees (380 | 48.6%), self-employed (not incorporated) (152 | 19.4%), and local government employees (127 | 16.2%) make up the most common classes of employment.
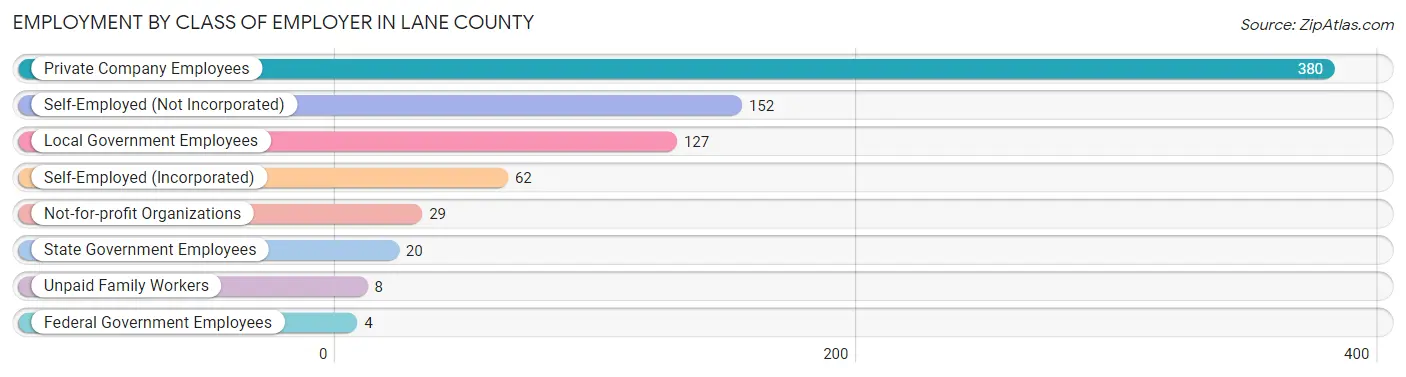
| Employer Class | # Employees | % Employees |
| Private Company Employees | 380 | 48.6% |
| Self-Employed (Incorporated) | 62 | 7.9% |
| Self-Employed (Not Incorporated) | 152 | 19.4% |
| Not-for-profit Organizations | 29 | 3.7% |
| Local Government Employees | 127 | 16.2% |
| State Government Employees | 20 | 2.6% |
| Federal Government Employees | 4 | 0.5% |
| Unpaid Family Workers | 8 | 1.0% |
| Total | 782 | 100.0% |
Employment Status by Age in Lane County
According to the labor force statistics for Lane County, out of the total population over 16 years of age (1,252), 64.1% or 803 individuals are in the labor force, with 0.4% or 3 of them unemployed. The age group with the highest labor force participation rate is 35 to 44 years, with 95.5% or 147 individuals in the labor force. Within the labor force, the 35 to 44 years age range has the highest percentage of unemployed individuals, with 2.0% or 3 of them being unemployed.
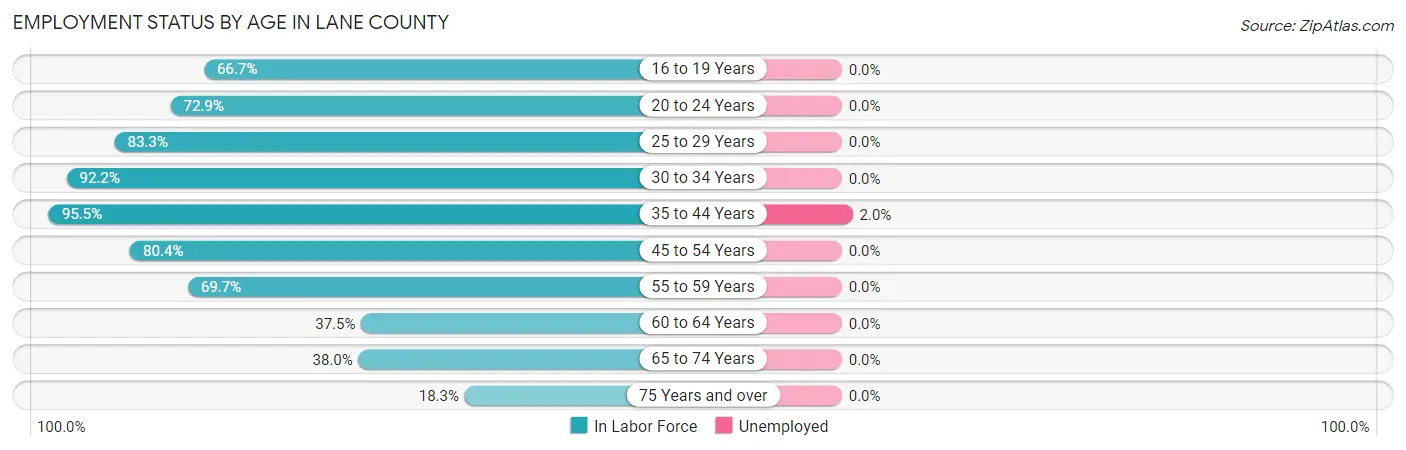
| Age Bracket | In Labor Force | Unemployed |
| 16 to 19 Years | 54 (66.7%) | 0 (0.0%) |
| 20 to 24 Years | 62 (72.9%) | 0 (0.0%) |
| 25 to 29 Years | 65 (83.3%) | 0 (0.0%) |
| 30 to 34 Years | 59 (92.2%) | 0 (0.0%) |
| 35 to 44 Years | 147 (95.5%) | 3 (2.0%) |
| 45 to 54 Years | 164 (80.4%) | 0 (0.0%) |
| 55 to 59 Years | 122 (69.7%) | 0 (0.0%) |
| 60 to 64 Years | 27 (37.5%) | 0 (0.0%) |
| 65 to 74 Years | 79 (38.0%) | 0 (0.0%) |
| 75 Years and over | 24 (18.3%) | 0 (0.0%) |
| Total | 803 (64.1%) | 3 (0.4%) |
Employment Status by Educational Attainment in Lane County
According to labor force statistics for Lane County, 78.2% of individuals (584) out of the total population between 25 and 64 years of age (747) are in the labor force, with 0.5% or 3 of them being unemployed. The group with the highest labor force participation rate are those with the educational attainment of bachelor's degree or higher, with 96.2% or 101 individuals in the labor force. Within the labor force, individuals with bachelor's degree or higher education have the highest percentage of unemployment, with 3.0% or 3 of them being unemployed.
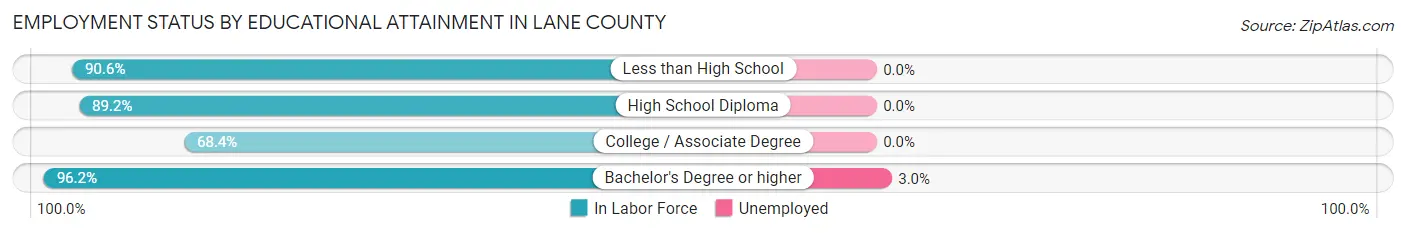
| Educational Attainment | In Labor Force | Unemployed |
| Less than High School | 29 (90.6%) | 0 (0.0%) |
| High School Diploma | 157 (89.2%) | 0 (0.0%) |
| College / Associate Degree | 297 (68.4%) | 0 (0.0%) |
| Bachelor's Degree or higher | 101 (96.2%) | 3 (3.0%) |
| Total | 584 (78.2%) | 4 (0.5%) |
Employment Occupations by Sex in Lane County
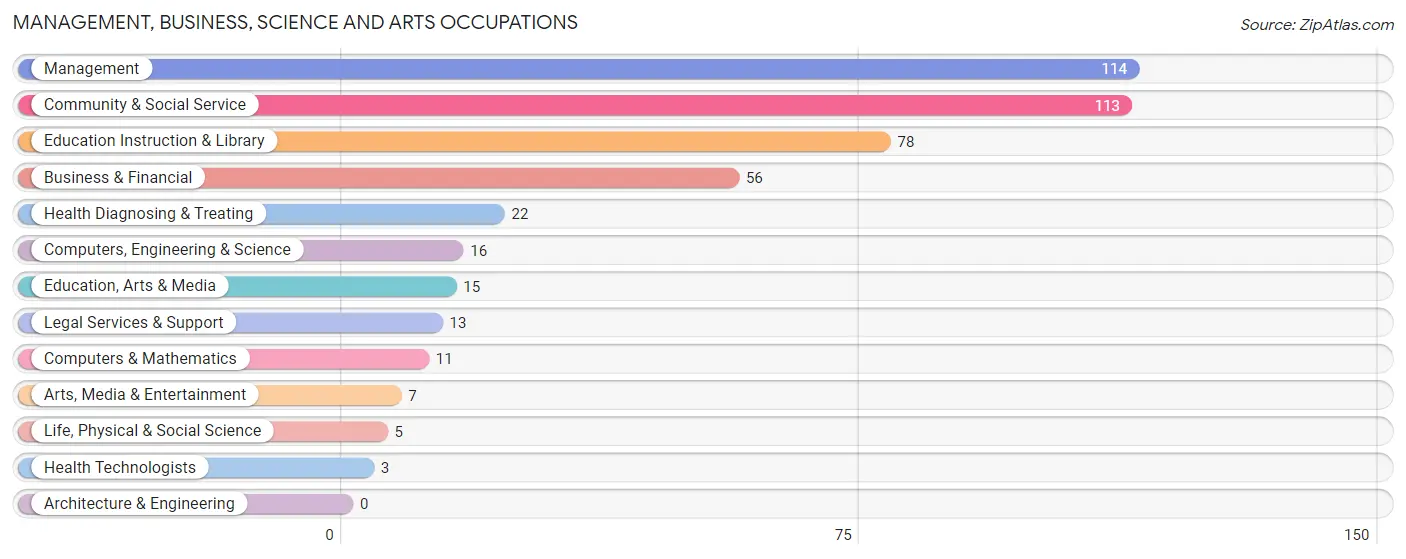
Management, Business, Science and Arts Occupations
The most common Management, Business, Science and Arts occupations in Lane County are Management (114 | 14.2%), Community & Social Service (113 | 14.1%), Education Instruction & Library (78 | 9.8%), Business & Financial (56 | 7.0%), and Health Diagnosing & Treating (22 | 2.8%).
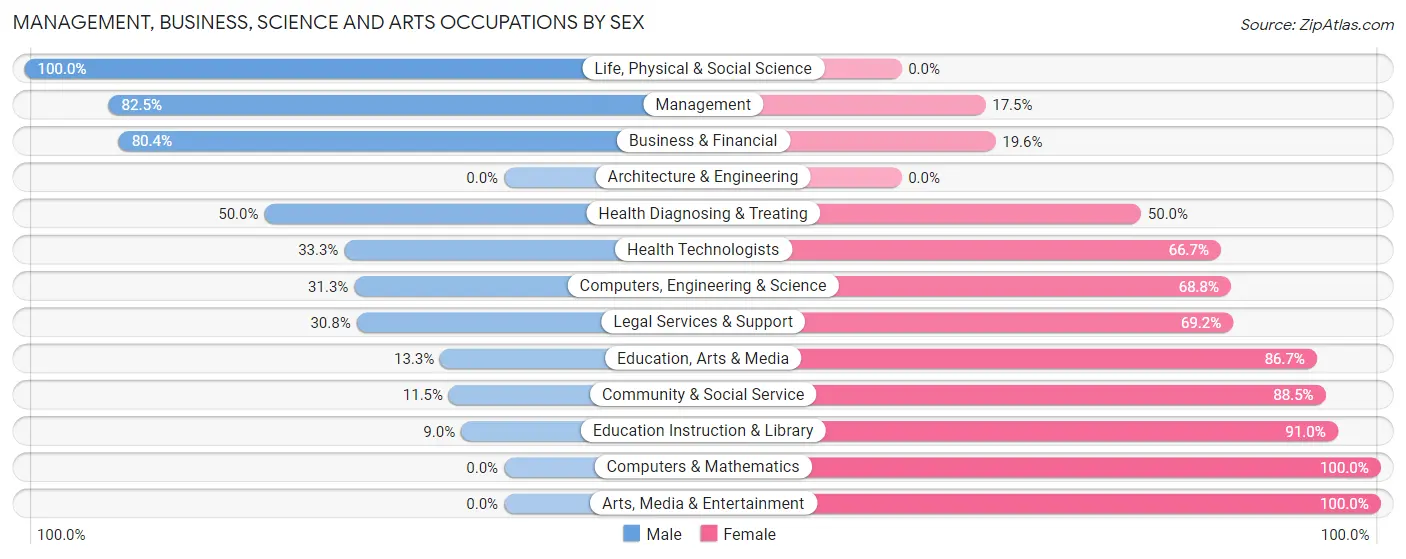
Management, Business, Science and Arts Occupations by Sex
Within the Management, Business, Science and Arts occupations in Lane County, the most male-oriented occupations are Life, Physical & Social Science (100.0%), Management (82.5%), and Business & Financial (80.4%), while the most female-oriented occupations are Computers & Mathematics (100.0%), Arts, Media & Entertainment (100.0%), and Education Instruction & Library (91.0%).
| Occupation | Male | Female |
| Management | 94 (82.5%) | 20 (17.5%) |
| Business & Financial | 45 (80.4%) | 11 (19.6%) |
| Computers, Engineering & Science | 5 (31.2%) | 11 (68.8%) |
| Computers & Mathematics | 0 (0.0%) | 11 (100.0%) |
| Architecture & Engineering | 0 (0.0%) | 0 (0.0%) |
| Life, Physical & Social Science | 5 (100.0%) | 0 (0.0%) |
| Community & Social Service | 13 (11.5%) | 100 (88.5%) |
| Education, Arts & Media | 2 (13.3%) | 13 (86.7%) |
| Legal Services & Support | 4 (30.8%) | 9 (69.2%) |
| Education Instruction & Library | 7 (9.0%) | 71 (91.0%) |
| Arts, Media & Entertainment | 0 (0.0%) | 7 (100.0%) |
| Health Diagnosing & Treating | 11 (50.0%) | 11 (50.0%) |
| Health Technologists | 1 (33.3%) | 2 (66.7%) |
| Total (Category) | 168 (52.3%) | 153 (47.7%) |
| Total (Overall) | 417 (52.1%) | 383 (47.9%) |
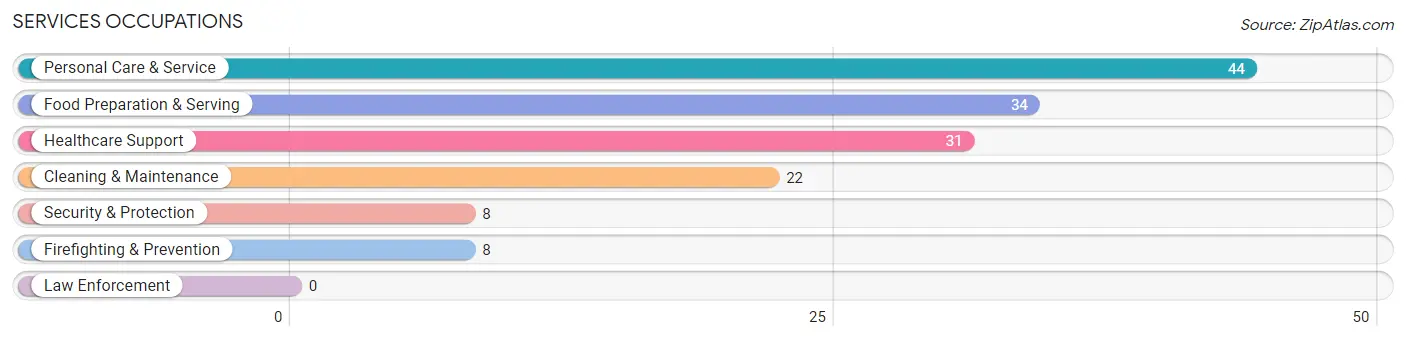
Services Occupations
The most common Services occupations in Lane County are Personal Care & Service (44 | 5.5%), Food Preparation & Serving (34 | 4.3%), Healthcare Support (31 | 3.9%), Cleaning & Maintenance (22 | 2.8%), and Security & Protection (8 | 1.0%).
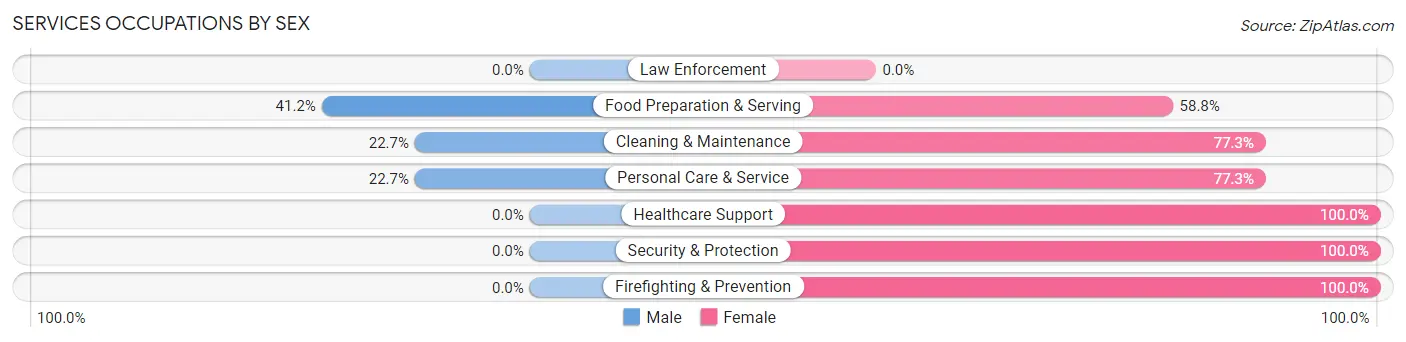
Services Occupations by Sex
Within the Services occupations in Lane County, the most male-oriented occupations are Food Preparation & Serving (41.2%), Cleaning & Maintenance (22.7%), and Personal Care & Service (22.7%), while the most female-oriented occupations are Healthcare Support (100.0%), Security & Protection (100.0%), and Firefighting & Prevention (100.0%).
| Occupation | Male | Female |
| Healthcare Support | 0 (0.0%) | 31 (100.0%) |
| Security & Protection | 0 (0.0%) | 8 (100.0%) |
| Firefighting & Prevention | 0 (0.0%) | 8 (100.0%) |
| Law Enforcement | 0 (0.0%) | 0 (0.0%) |
| Food Preparation & Serving | 14 (41.2%) | 20 (58.8%) |
| Cleaning & Maintenance | 5 (22.7%) | 17 (77.3%) |
| Personal Care & Service | 10 (22.7%) | 34 (77.3%) |
| Total (Category) | 29 (20.9%) | 110 (79.1%) |
| Total (Overall) | 417 (52.1%) | 383 (47.9%) |
Sales and Office Occupations
The most common Sales and Office occupations in Lane County are Sales & Related (72 | 9.0%), and Office & Administration (54 | 6.8%).
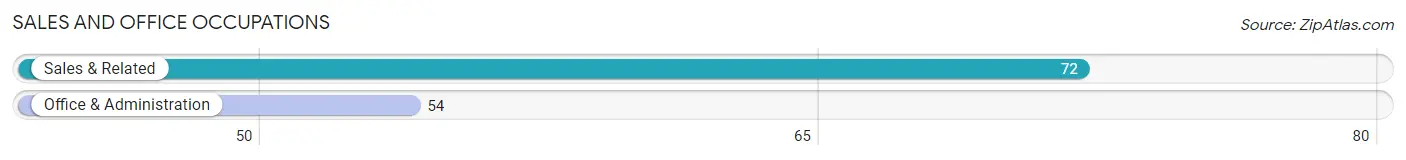
Sales and Office Occupations by Sex
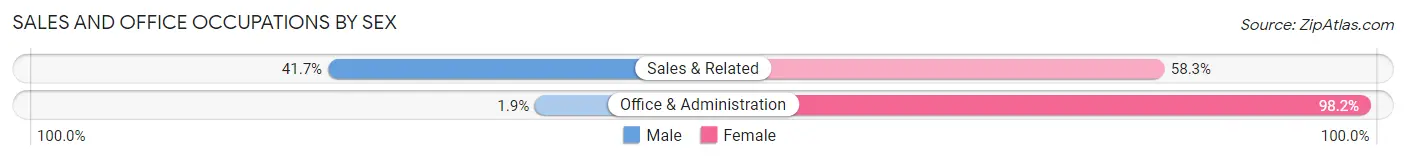
| Occupation | Male | Female |
| Sales & Related | 30 (41.7%) | 42 (58.3%) |
| Office & Administration | 1 (1.8%) | 53 (98.2%) |
| Total (Category) | 31 (24.6%) | 95 (75.4%) |
| Total (Overall) | 417 (52.1%) | 383 (47.9%) |
Natural Resources, Construction and Maintenance Occupations
The most common Natural Resources, Construction and Maintenance occupations in Lane County are Construction & Extraction (54 | 6.8%), Farming, Fishing & Forestry (47 | 5.9%), and Installation, Maintenance & Repair (34 | 4.3%).
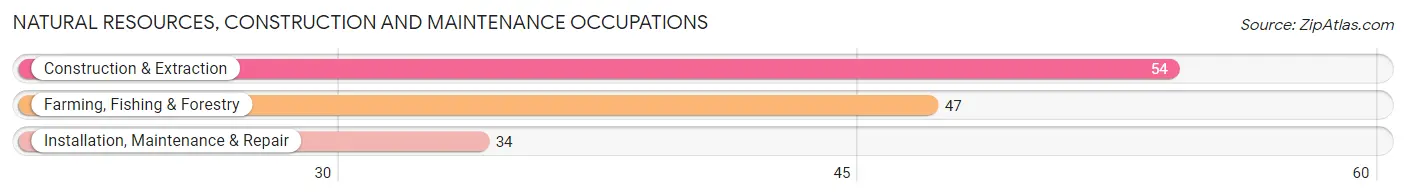
Natural Resources, Construction and Maintenance Occupations by Sex
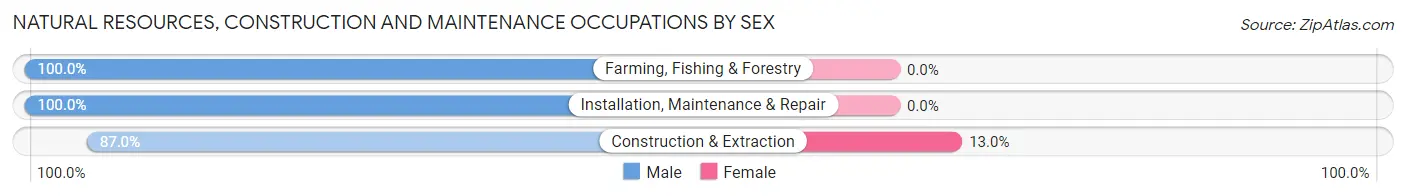
| Occupation | Male | Female |
| Farming, Fishing & Forestry | 47 (100.0%) | 0 (0.0%) |
| Construction & Extraction | 47 (87.0%) | 7 (13.0%) |
| Installation, Maintenance & Repair | 34 (100.0%) | 0 (0.0%) |
| Total (Category) | 128 (94.8%) | 7 (5.2%) |
| Total (Overall) | 417 (52.1%) | 383 (47.9%) |
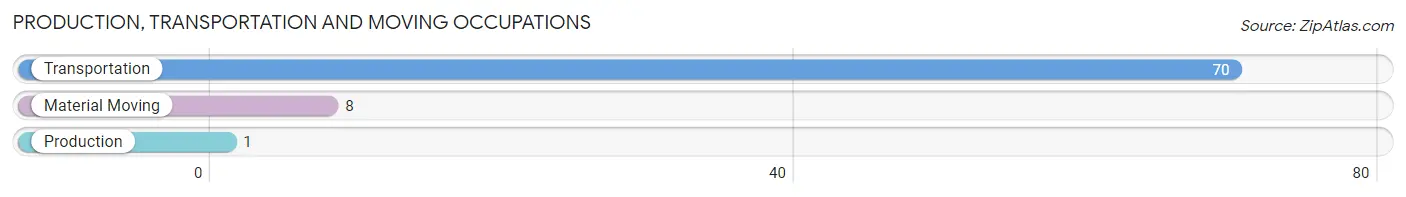
Production, Transportation and Moving Occupations
The most common Production, Transportation and Moving occupations in Lane County are Transportation (70 | 8.7%), Material Moving (8 | 1.0%), and Production (1 | 0.1%).
Production, Transportation and Moving Occupations by Sex
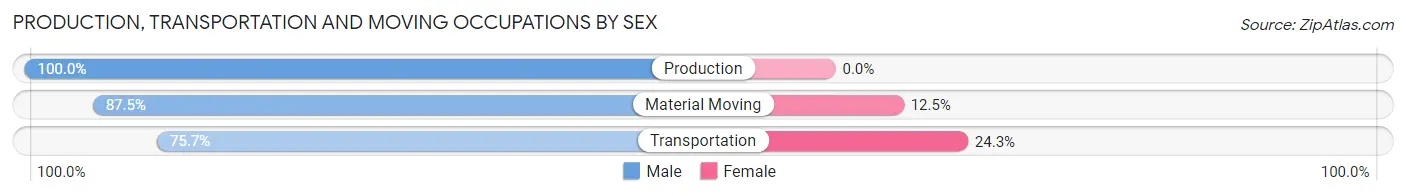
| Occupation | Male | Female |
| Production | 1 (100.0%) | 0 (0.0%) |
| Transportation | 53 (75.7%) | 17 (24.3%) |
| Material Moving | 7 (87.5%) | 1 (12.5%) |
| Total (Category) | 61 (77.2%) | 18 (22.8%) |
| Total (Overall) | 417 (52.1%) | 383 (47.9%) |
Employment Industries by Sex in Lane County
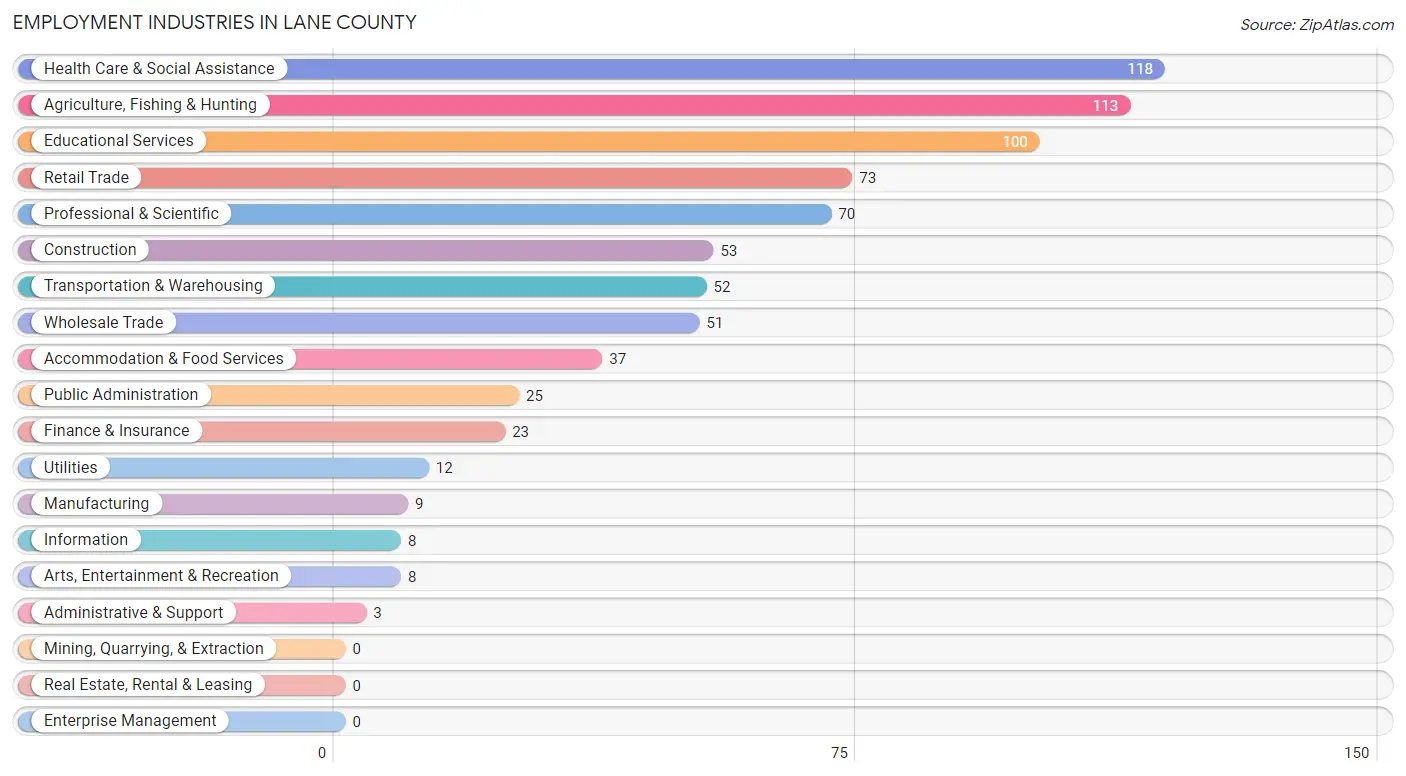
Employment Industries in Lane County
The major employment industries in Lane County include Health Care & Social Assistance (118 | 14.7%), Agriculture, Fishing & Hunting (113 | 14.1%), Educational Services (100 | 12.5%), Retail Trade (73 | 9.1%), and Professional & Scientific (70 | 8.7%).
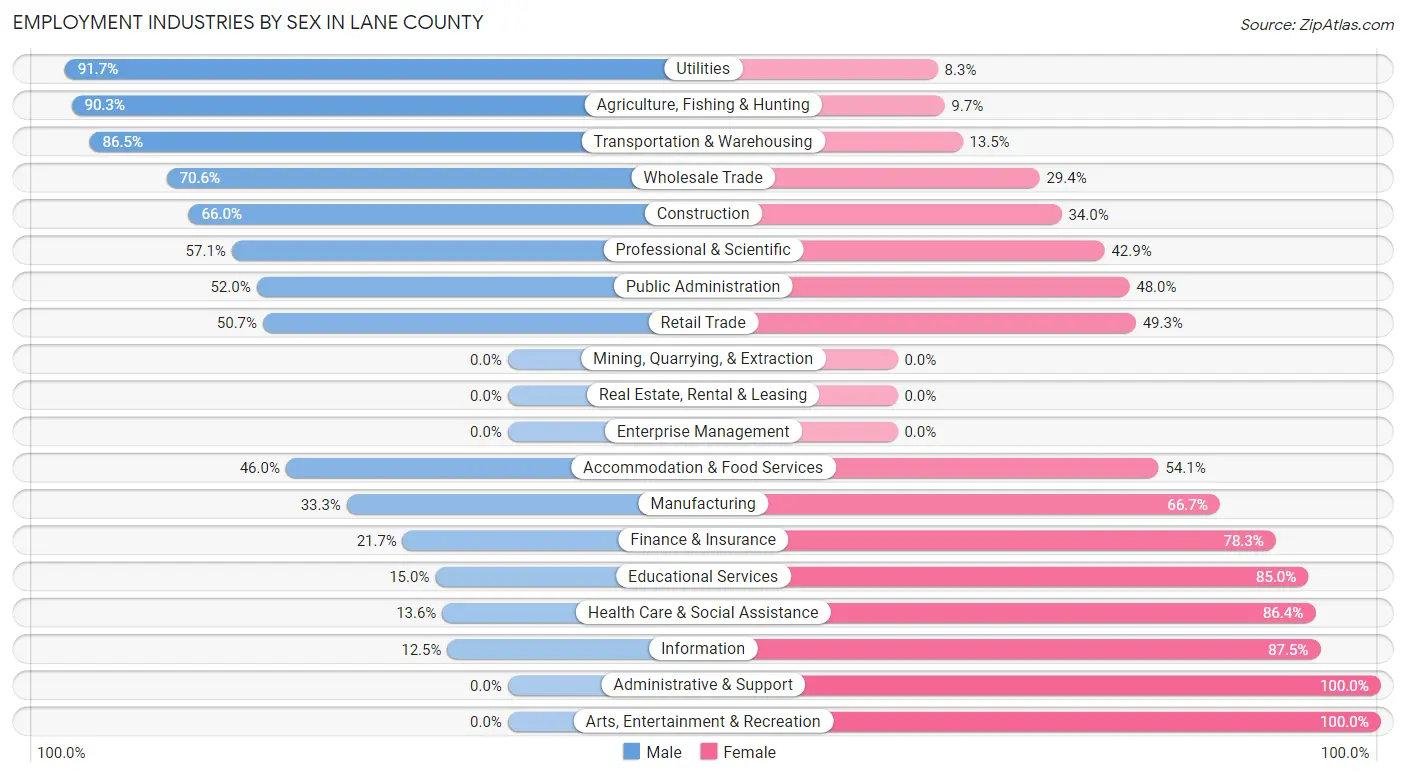
Employment Industries by Sex in Lane County
The Lane County industries that see more men than women are Utilities (91.7%), Agriculture, Fishing & Hunting (90.3%), and Transportation & Warehousing (86.5%), whereas the industries that tend to have a higher number of women are Administrative & Support (100.0%), Arts, Entertainment & Recreation (100.0%), and Information (87.5%).
| Industry | Male | Female |
| Agriculture, Fishing & Hunting | 102 (90.3%) | 11 (9.7%) |
| Mining, Quarrying, & Extraction | 0 (0.0%) | 0 (0.0%) |
| Construction | 35 (66.0%) | 18 (34.0%) |
| Manufacturing | 3 (33.3%) | 6 (66.7%) |
| Wholesale Trade | 36 (70.6%) | 15 (29.4%) |
| Retail Trade | 37 (50.7%) | 36 (49.3%) |
| Transportation & Warehousing | 45 (86.5%) | 7 (13.5%) |
| Utilities | 11 (91.7%) | 1 (8.3%) |
| Information | 1 (12.5%) | 7 (87.5%) |
| Finance & Insurance | 5 (21.7%) | 18 (78.3%) |
| Real Estate, Rental & Leasing | 0 (0.0%) | 0 (0.0%) |
| Professional & Scientific | 40 (57.1%) | 30 (42.9%) |
| Enterprise Management | 0 (0.0%) | 0 (0.0%) |
| Administrative & Support | 0 (0.0%) | 3 (100.0%) |
| Educational Services | 15 (15.0%) | 85 (85.0%) |
| Health Care & Social Assistance | 16 (13.6%) | 102 (86.4%) |
| Arts, Entertainment & Recreation | 0 (0.0%) | 8 (100.0%) |
| Accommodation & Food Services | 17 (46.0%) | 20 (54.0%) |
| Public Administration | 13 (52.0%) | 12 (48.0%) |
| Total | 417 (52.1%) | 383 (47.9%) |
Education in Lane County
School Enrollment in Lane County
The most common levels of schooling among the 343 students in Lane County are high school (109 | 31.8%), elementary school (88 | 25.7%), and middle school (57 | 16.6%).
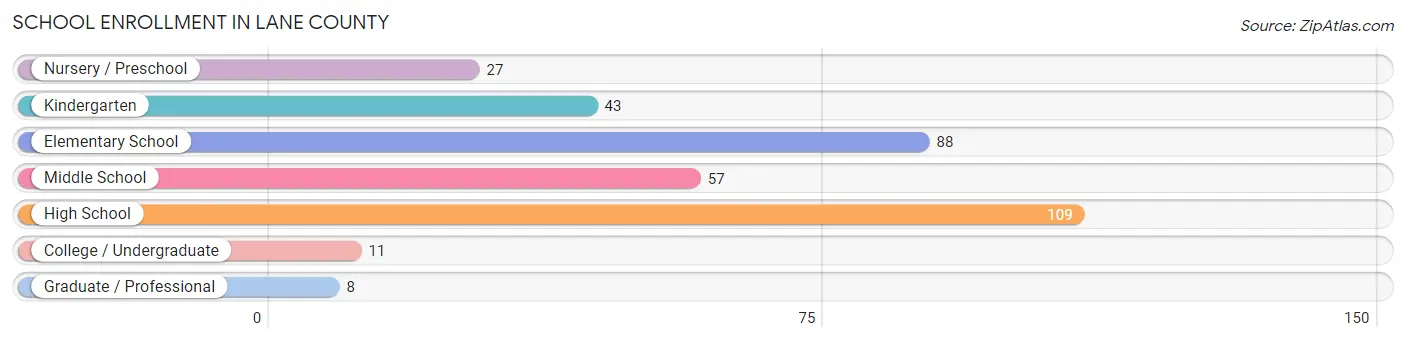
| School Level | # Students | % Students |
| Nursery / Preschool | 27 | 7.9% |
| Kindergarten | 43 | 12.5% |
| Elementary School | 88 | 25.7% |
| Middle School | 57 | 16.6% |
| High School | 109 | 31.8% |
| College / Undergraduate | 11 | 3.2% |
| Graduate / Professional | 8 | 2.3% |
| Total | 343 | 100.0% |
School Enrollment by Age by Funding Source in Lane County
Out of a total of 343 students who are enrolled in schools in Lane County, 11 (3.2%) attend a private institution, while the remaining 332 (96.8%) are enrolled in public schools. The age group of 18 to 19 year olds has the highest likelihood of being enrolled in private schools, with 6 (15.4% in the age bracket) enrolled. Conversely, the age group of 3 to 4 year olds has the lowest likelihood of being enrolled in a private school, with 24 (100.0% in the age bracket) attending a public institution.
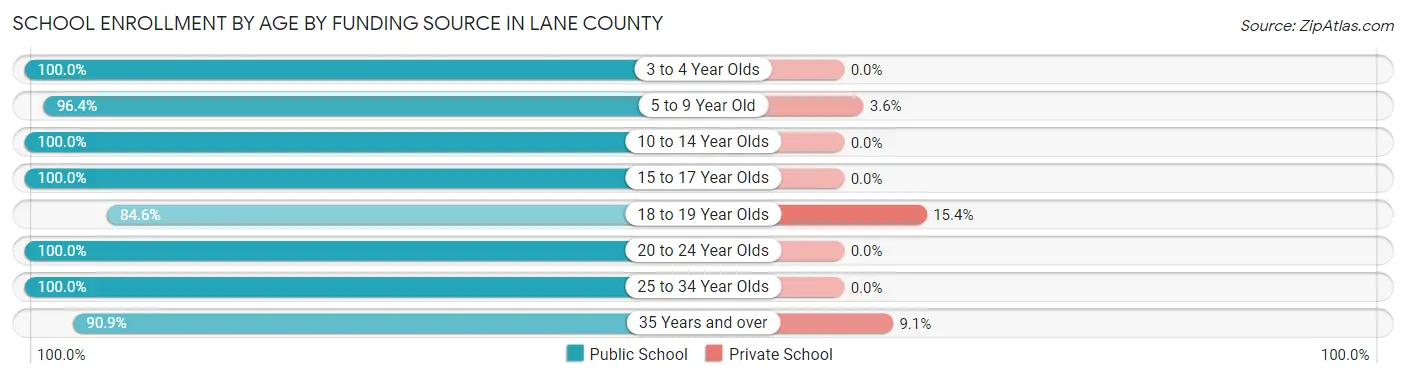
| Age Bracket | Public School | Private School |
| 3 to 4 Year Olds | 24 (100.0%) | 0 (0.0%) |
| 5 to 9 Year Old | 108 (96.4%) | 4 (3.6%) |
| 10 to 14 Year Olds | 79 (100.0%) | 0 (0.0%) |
| 15 to 17 Year Olds | 55 (100.0%) | 0 (0.0%) |
| 18 to 19 Year Olds | 33 (84.6%) | 6 (15.4%) |
| 20 to 24 Year Olds | 6 (100.0%) | 0 (0.0%) |
| 25 to 34 Year Olds | 17 (100.0%) | 0 (0.0%) |
| 35 Years and over | 10 (90.9%) | 1 (9.1%) |
| Total | 332 (96.8%) | 11 (3.2%) |
Educational Attainment by Field of Study in Lane County
Education (51 | 23.4%), bio, nature & agricultural (42 | 19.3%), visual & performing arts (26 | 11.9%), science & technology (18 | 8.3%), and literature & languages (15 | 6.9%) are the most common fields of study among 218 individuals in Lane County who have obtained a bachelor's degree or higher.
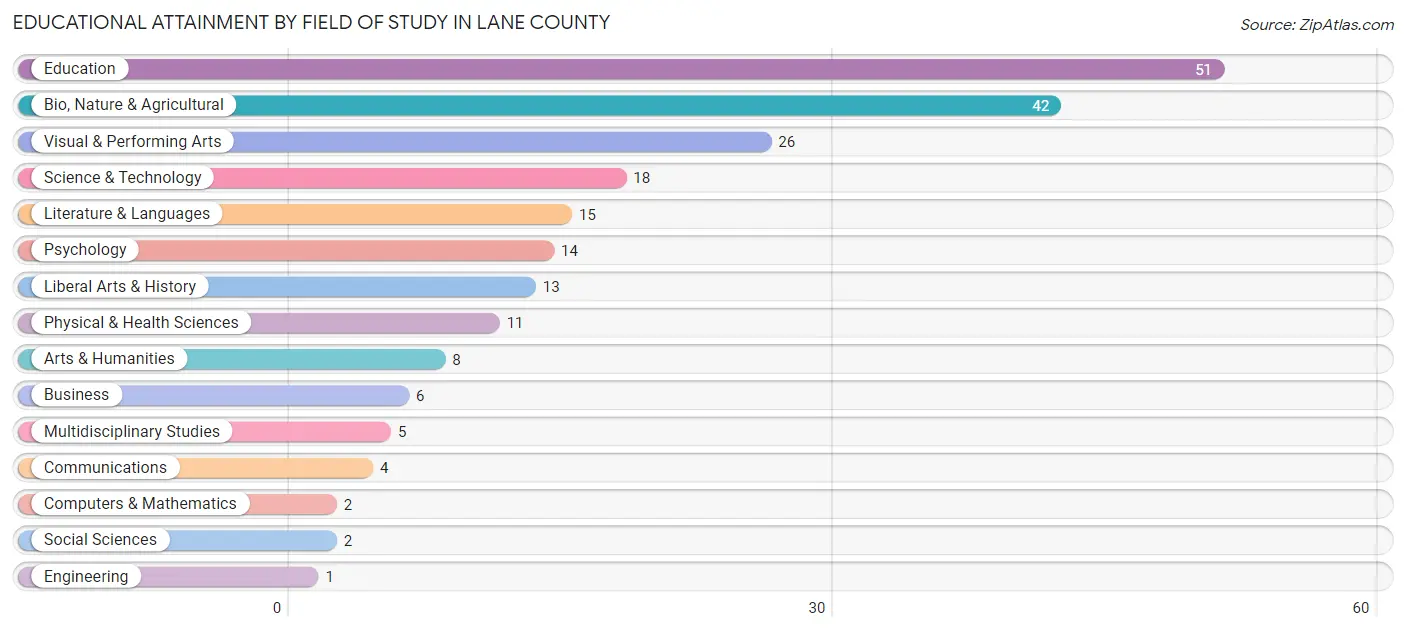
| Field of Study | # Graduates | % Graduates |
| Computers & Mathematics | 2 | 0.9% |
| Bio, Nature & Agricultural | 42 | 19.3% |
| Physical & Health Sciences | 11 | 5.1% |
| Psychology | 14 | 6.4% |
| Social Sciences | 2 | 0.9% |
| Engineering | 1 | 0.5% |
| Multidisciplinary Studies | 5 | 2.3% |
| Science & Technology | 18 | 8.3% |
| Business | 6 | 2.8% |
| Education | 51 | 23.4% |
| Literature & Languages | 15 | 6.9% |
| Liberal Arts & History | 13 | 6.0% |
| Visual & Performing Arts | 26 | 11.9% |
| Communications | 4 | 1.8% |
| Arts & Humanities | 8 | 3.7% |
| Total | 218 | 100.0% |
Transportation & Commute in Lane County
Vehicle Availability by Sex in Lane County
The most prevalent vehicle ownership categories in Lane County are males with 2 vehicles (171, accounting for 41.0%) and females with 2 vehicles (135, making up 46.9%).
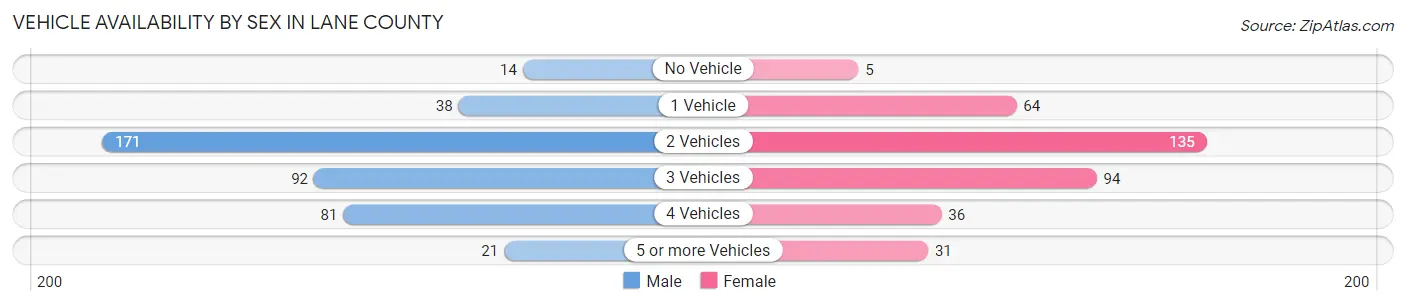
| Vehicles Available | Male | Female |
| No Vehicle | 14 (3.4%) | 5 (1.4%) |
| 1 Vehicle | 38 (9.1%) | 64 (17.5%) |
| 2 Vehicles | 171 (41.0%) | 135 (37.0%) |
| 3 Vehicles | 92 (22.1%) | 94 (25.8%) |
| 4 Vehicles | 81 (19.4%) | 36 (9.9%) |
| 5 or more Vehicles | 21 (5.0%) | 31 (8.5%) |
| Total | 417 (100.0%) | 365 (100.0%) |
Commute Time in Lane County
The most frequently occuring commute durations in Lane County are less than 5 minutes (230 commuters, 32.5%), 5 to 9 minutes (177 commuters, 25.0%), and 15 to 19 minutes (88 commuters, 12.4%).
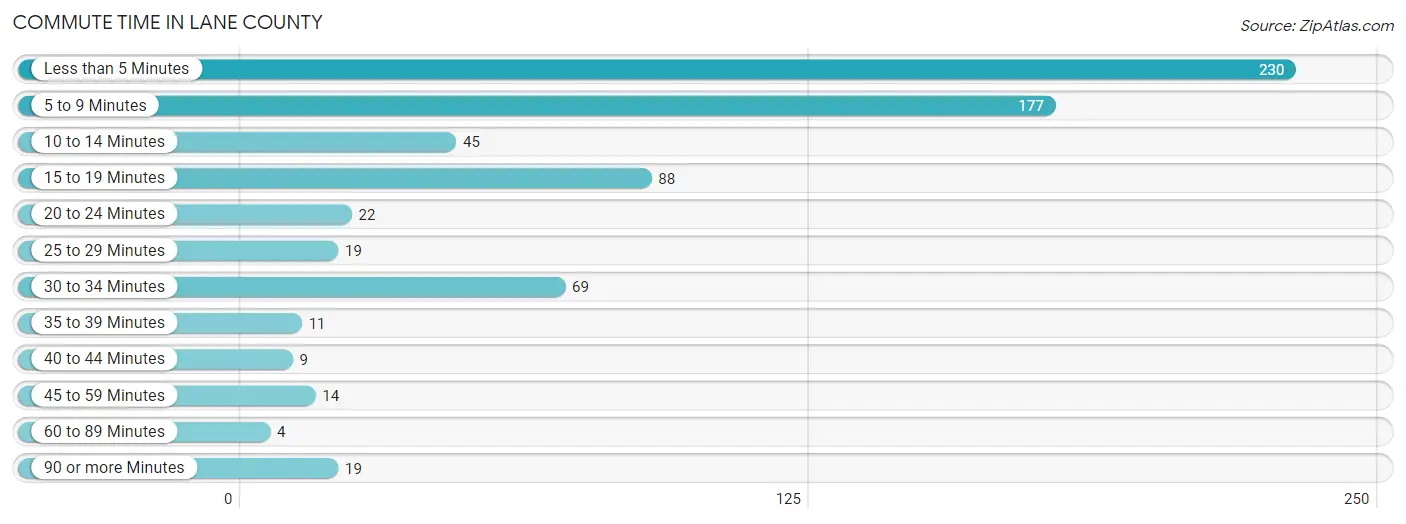
| Commute Time | # Commuters | % Commuters |
| Less than 5 Minutes | 230 | 32.5% |
| 5 to 9 Minutes | 177 | 25.0% |
| 10 to 14 Minutes | 45 | 6.4% |
| 15 to 19 Minutes | 88 | 12.4% |
| 20 to 24 Minutes | 22 | 3.1% |
| 25 to 29 Minutes | 19 | 2.7% |
| 30 to 34 Minutes | 69 | 9.8% |
| 35 to 39 Minutes | 11 | 1.6% |
| 40 to 44 Minutes | 9 | 1.3% |
| 45 to 59 Minutes | 14 | 2.0% |
| 60 to 89 Minutes | 4 | 0.6% |
| 90 or more Minutes | 19 | 2.7% |
Commute Time by Sex in Lane County
The most common commute times in Lane County are less than 5 minutes (113 commuters, 31.2%) for males and less than 5 minutes (117 commuters, 33.9%) for females.
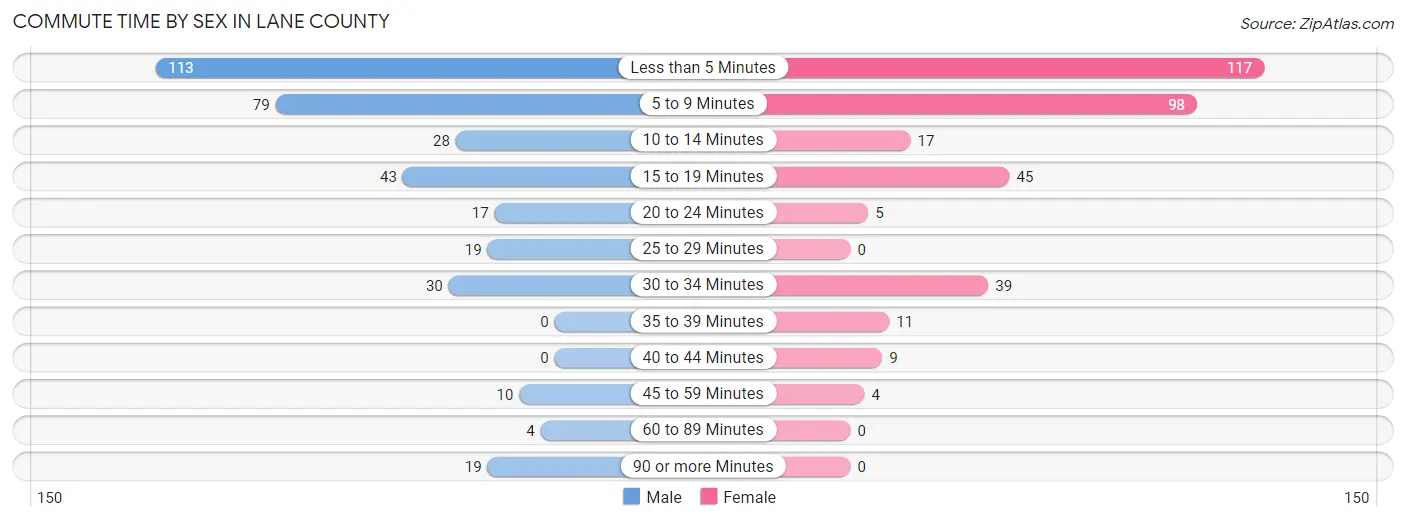
| Commute Time | Male | Female |
| Less than 5 Minutes | 113 (31.2%) | 117 (33.9%) |
| 5 to 9 Minutes | 79 (21.8%) | 98 (28.4%) |
| 10 to 14 Minutes | 28 (7.7%) | 17 (4.9%) |
| 15 to 19 Minutes | 43 (11.9%) | 45 (13.0%) |
| 20 to 24 Minutes | 17 (4.7%) | 5 (1.5%) |
| 25 to 29 Minutes | 19 (5.2%) | 0 (0.0%) |
| 30 to 34 Minutes | 30 (8.3%) | 39 (11.3%) |
| 35 to 39 Minutes | 0 (0.0%) | 11 (3.2%) |
| 40 to 44 Minutes | 0 (0.0%) | 9 (2.6%) |
| 45 to 59 Minutes | 10 (2.8%) | 4 (1.2%) |
| 60 to 89 Minutes | 4 (1.1%) | 0 (0.0%) |
| 90 or more Minutes | 19 (5.2%) | 0 (0.0%) |
Time of Departure to Work by Sex in Lane County
The most frequent times of departure to work in Lane County are 7:30 AM to 7:59 AM (118, 32.6%) for males and 7:30 AM to 7:59 AM (97, 28.1%) for females.
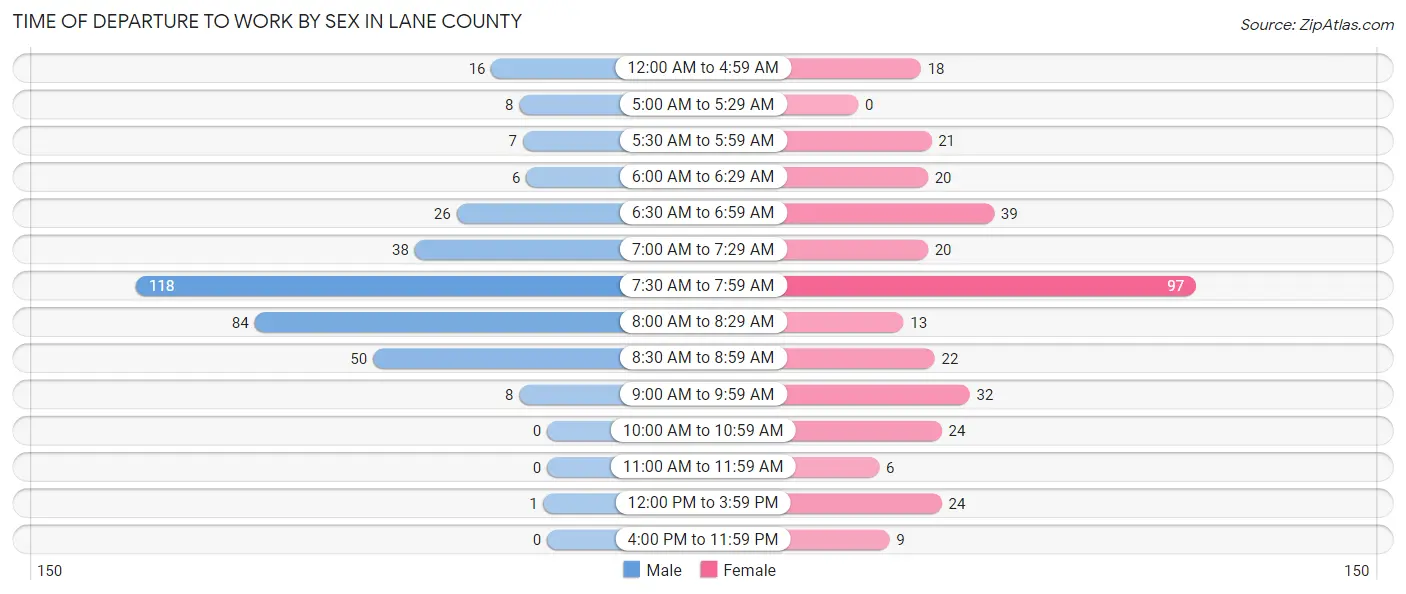
| Time of Departure | Male | Female |
| 12:00 AM to 4:59 AM | 16 (4.4%) | 18 (5.2%) |
| 5:00 AM to 5:29 AM | 8 (2.2%) | 0 (0.0%) |
| 5:30 AM to 5:59 AM | 7 (1.9%) | 21 (6.1%) |
| 6:00 AM to 6:29 AM | 6 (1.7%) | 20 (5.8%) |
| 6:30 AM to 6:59 AM | 26 (7.2%) | 39 (11.3%) |
| 7:00 AM to 7:29 AM | 38 (10.5%) | 20 (5.8%) |
| 7:30 AM to 7:59 AM | 118 (32.6%) | 97 (28.1%) |
| 8:00 AM to 8:29 AM | 84 (23.2%) | 13 (3.8%) |
| 8:30 AM to 8:59 AM | 50 (13.8%) | 22 (6.4%) |
| 9:00 AM to 9:59 AM | 8 (2.2%) | 32 (9.3%) |
| 10:00 AM to 10:59 AM | 0 (0.0%) | 24 (7.0%) |
| 11:00 AM to 11:59 AM | 0 (0.0%) | 6 (1.7%) |
| 12:00 PM to 3:59 PM | 1 (0.3%) | 24 (7.0%) |
| 4:00 PM to 11:59 PM | 0 (0.0%) | 9 (2.6%) |
| Total | 362 (100.0%) | 345 (100.0%) |
Housing Occupancy in Lane County
Occupancy by Ownership in Lane County
Of the total 672 dwellings in Lane County, owner-occupied units account for 522 (77.7%), while renter-occupied units make up 150 (22.3%).
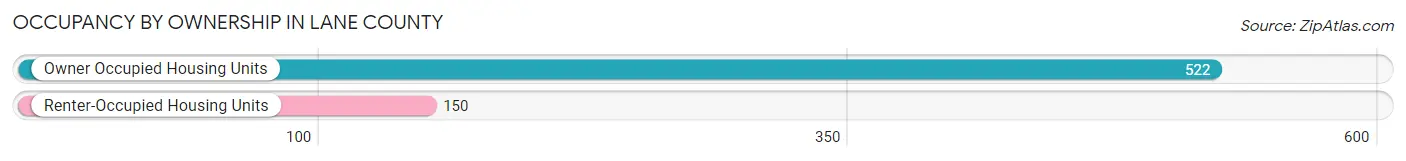
| Occupancy | # Housing Units | % Housing Units |
| Owner Occupied Housing Units | 522 | 77.7% |
| Renter-Occupied Housing Units | 150 | 22.3% |
| Total Occupied Housing Units | 672 | 100.0% |
Occupancy by Household Size in Lane County
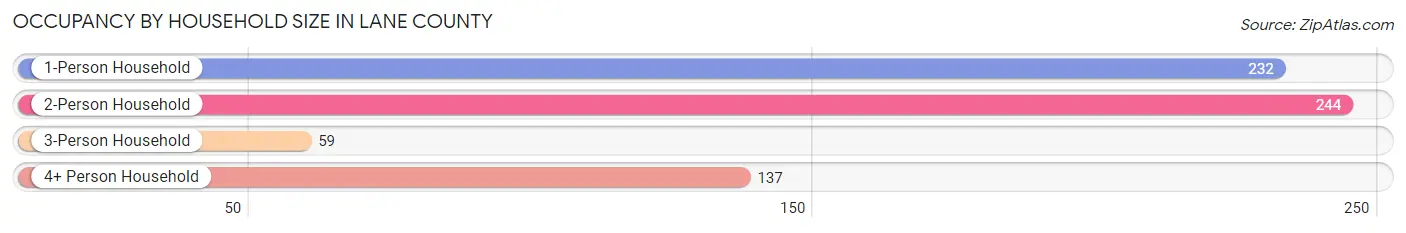
| Household Size | # Housing Units | % Housing Units |
| 1-Person Household | 232 | 34.5% |
| 2-Person Household | 244 | 36.3% |
| 3-Person Household | 59 | 8.8% |
| 4+ Person Household | 137 | 20.4% |
| Total Housing Units | 672 | 100.0% |
Occupancy by Ownership by Household Size in Lane County
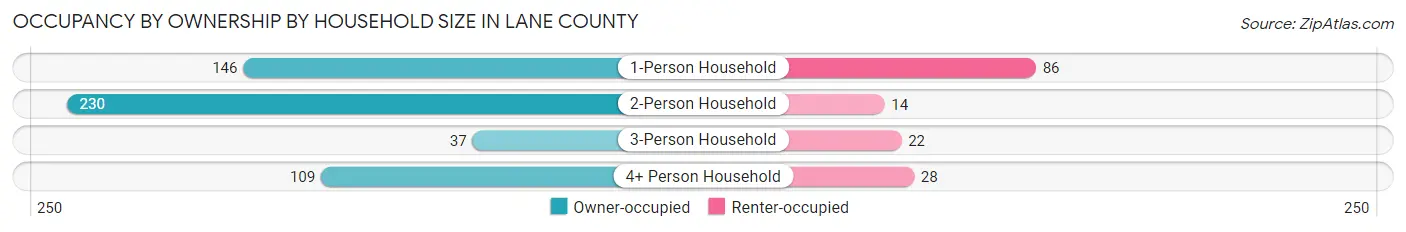
| Household Size | Owner-occupied | Renter-occupied |
| 1-Person Household | 146 (62.9%) | 86 (37.1%) |
| 2-Person Household | 230 (94.3%) | 14 (5.7%) |
| 3-Person Household | 37 (62.7%) | 22 (37.3%) |
| 4+ Person Household | 109 (79.6%) | 28 (20.4%) |
| Total Housing Units | 522 (77.7%) | 150 (22.3%) |
Occupancy by Educational Attainment in Lane County
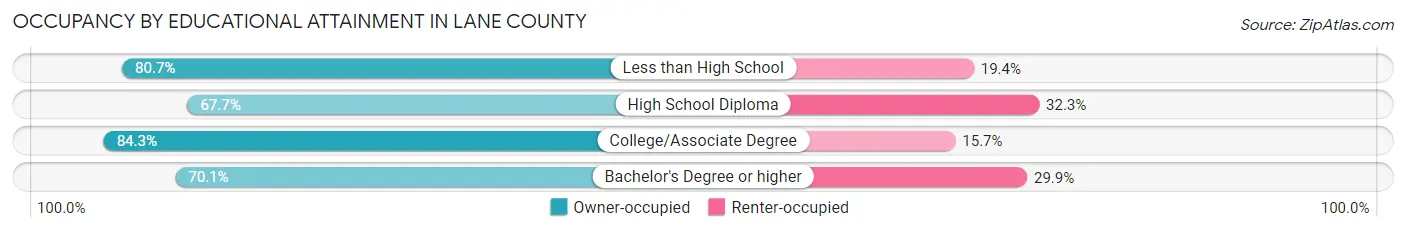
| Household Size | Owner-occupied | Renter-occupied |
| Less than High School | 25 (80.6%) | 6 (19.4%) |
| High School Diploma | 109 (67.7%) | 52 (32.3%) |
| College/Associate Degree | 306 (84.3%) | 57 (15.7%) |
| Bachelor's Degree or higher | 82 (70.1%) | 35 (29.9%) |
Occupancy by Age of Householder in Lane County
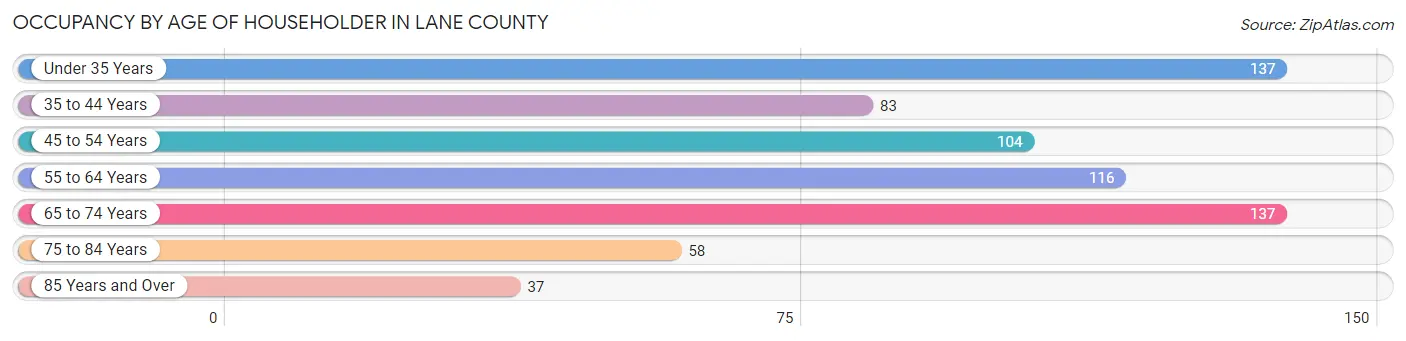
| Age Bracket | # Households | % Households |
| Under 35 Years | 137 | 20.4% |
| 35 to 44 Years | 83 | 12.3% |
| 45 to 54 Years | 104 | 15.5% |
| 55 to 64 Years | 116 | 17.3% |
| 65 to 74 Years | 137 | 20.4% |
| 75 to 84 Years | 58 | 8.6% |
| 85 Years and Over | 37 | 5.5% |
| Total | 672 | 100.0% |
Housing Finances in Lane County
Median Income by Occupancy in Lane County
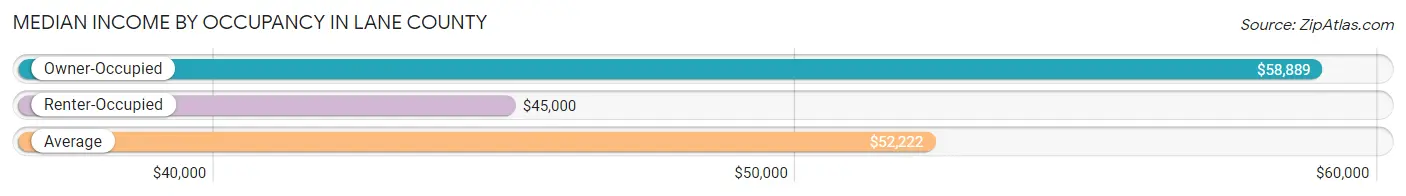
| Occupancy Type | # Households | Median Income |
| Owner-Occupied | 522 (77.7%) | $58,889 |
| Renter-Occupied | 150 (22.3%) | $45,000 |
| Average | 672 (100.0%) | $52,222 |
Occupancy by Householder Income Bracket in Lane County
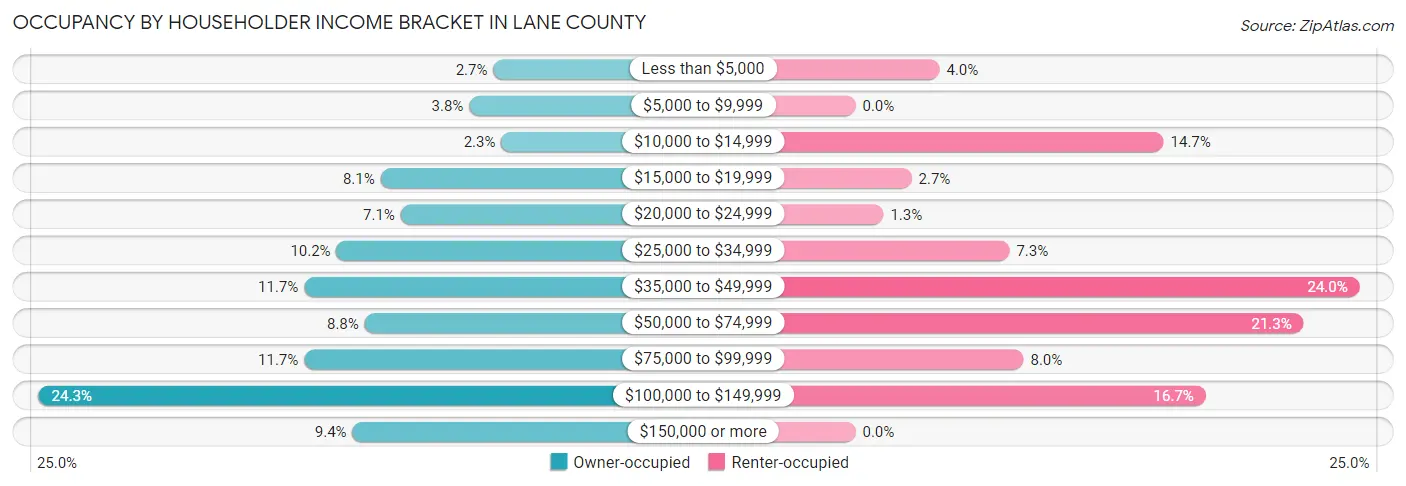
| Income Bracket | Owner-occupied | Renter-occupied |
| Less than $5,000 | 14 (2.7%) | 6 (4.0%) |
| $5,000 to $9,999 | 20 (3.8%) | 0 (0.0%) |
| $10,000 to $14,999 | 12 (2.3%) | 22 (14.7%) |
| $15,000 to $19,999 | 42 (8.1%) | 4 (2.7%) |
| $20,000 to $24,999 | 37 (7.1%) | 2 (1.3%) |
| $25,000 to $34,999 | 53 (10.2%) | 11 (7.3%) |
| $35,000 to $49,999 | 61 (11.7%) | 36 (24.0%) |
| $50,000 to $74,999 | 46 (8.8%) | 32 (21.3%) |
| $75,000 to $99,999 | 61 (11.7%) | 12 (8.0%) |
| $100,000 to $149,999 | 127 (24.3%) | 25 (16.7%) |
| $150,000 or more | 49 (9.4%) | 0 (0.0%) |
| Total | 522 (100.0%) | 150 (100.0%) |
Monthly Housing Cost Tiers in Lane County
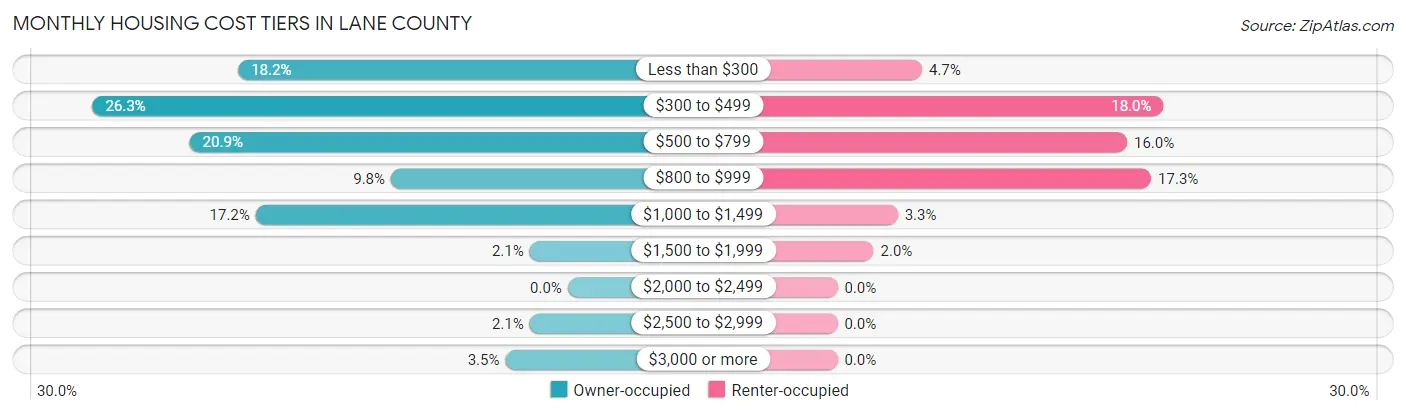
| Monthly Cost | Owner-occupied | Renter-occupied |
| Less than $300 | 95 (18.2%) | 7 (4.7%) |
| $300 to $499 | 137 (26.3%) | 27 (18.0%) |
| $500 to $799 | 109 (20.9%) | 24 (16.0%) |
| $800 to $999 | 51 (9.8%) | 26 (17.3%) |
| $1,000 to $1,499 | 90 (17.2%) | 5 (3.3%) |
| $1,500 to $1,999 | 11 (2.1%) | 3 (2.0%) |
| $2,000 to $2,499 | 0 (0.0%) | 0 (0.0%) |
| $2,500 to $2,999 | 11 (2.1%) | 0 (0.0%) |
| $3,000 or more | 18 (3.5%) | 0 (0.0%) |
| Total | 522 (100.0%) | 150 (100.0%) |
Physical Housing Characteristics in Lane County
Housing Structures in Lane County
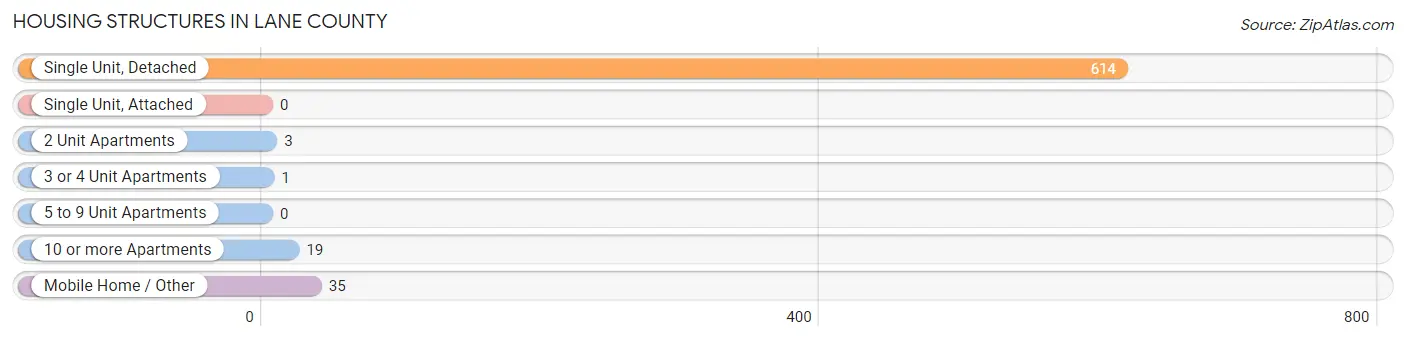
| Structure Type | # Housing Units | % Housing Units |
| Single Unit, Detached | 614 | 91.4% |
| Single Unit, Attached | 0 | 0.0% |
| 2 Unit Apartments | 3 | 0.4% |
| 3 or 4 Unit Apartments | 1 | 0.2% |
| 5 to 9 Unit Apartments | 0 | 0.0% |
| 10 or more Apartments | 19 | 2.8% |
| Mobile Home / Other | 35 | 5.2% |
| Total | 672 | 100.0% |
Housing Structures by Occupancy in Lane County
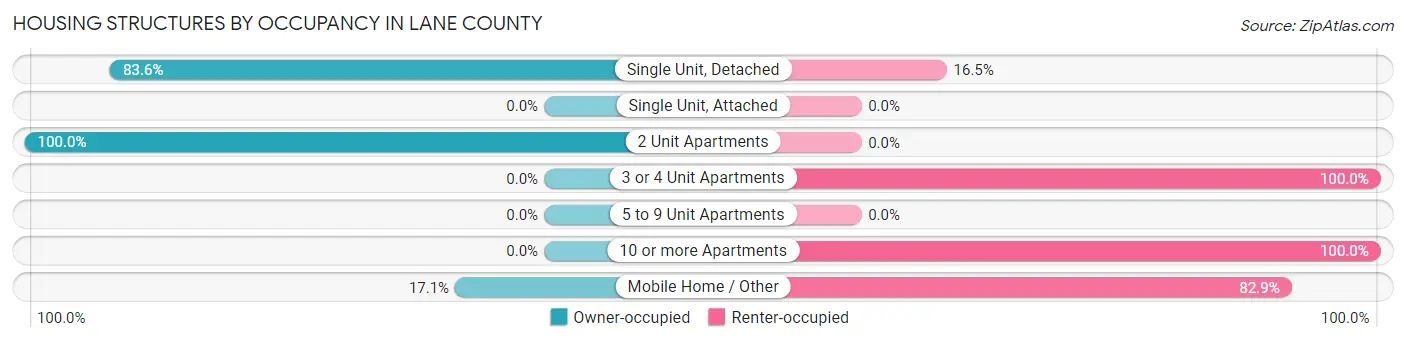
| Structure Type | Owner-occupied | Renter-occupied |
| Single Unit, Detached | 513 (83.6%) | 101 (16.5%) |
| Single Unit, Attached | 0 (0.0%) | 0 (0.0%) |
| 2 Unit Apartments | 3 (100.0%) | 0 (0.0%) |
| 3 or 4 Unit Apartments | 0 (0.0%) | 1 (100.0%) |
| 5 to 9 Unit Apartments | 0 (0.0%) | 0 (0.0%) |
| 10 or more Apartments | 0 (0.0%) | 19 (100.0%) |
| Mobile Home / Other | 6 (17.1%) | 29 (82.9%) |
| Total | 522 (77.7%) | 150 (22.3%) |
Housing Structures by Number of Rooms in Lane County
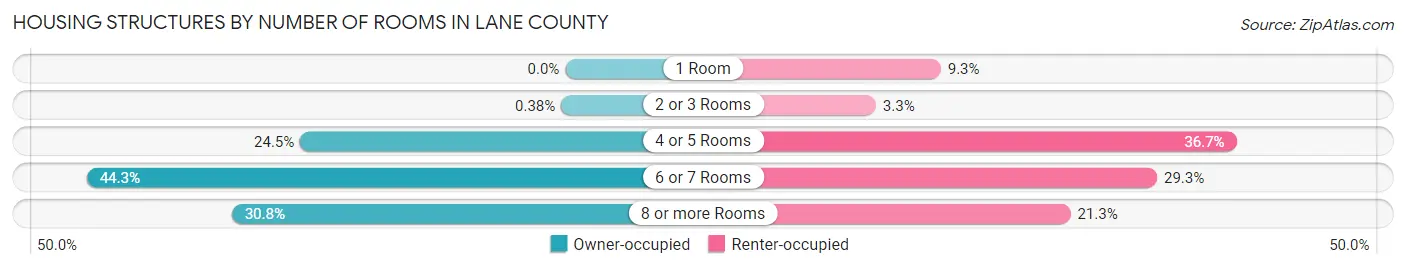
| Number of Rooms | Owner-occupied | Renter-occupied |
| 1 Room | 0 (0.0%) | 14 (9.3%) |
| 2 or 3 Rooms | 2 (0.4%) | 5 (3.3%) |
| 4 or 5 Rooms | 128 (24.5%) | 55 (36.7%) |
| 6 or 7 Rooms | 231 (44.3%) | 44 (29.3%) |
| 8 or more Rooms | 161 (30.8%) | 32 (21.3%) |
| Total | 522 (100.0%) | 150 (100.0%) |
Housing Structure by Heating Type in Lane County
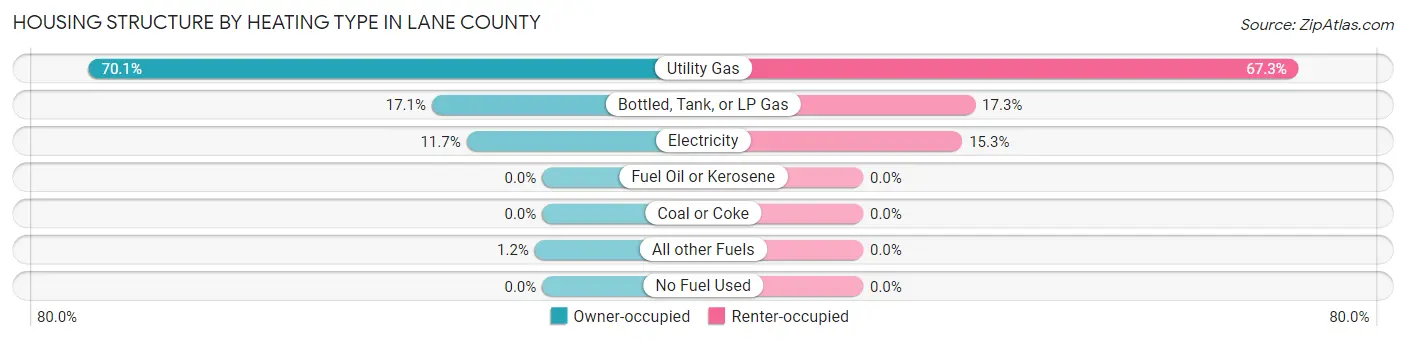
| Heating Type | Owner-occupied | Renter-occupied |
| Utility Gas | 366 (70.1%) | 101 (67.3%) |
| Bottled, Tank, or LP Gas | 89 (17.1%) | 26 (17.3%) |
| Electricity | 61 (11.7%) | 23 (15.3%) |
| Fuel Oil or Kerosene | 0 (0.0%) | 0 (0.0%) |
| Coal or Coke | 0 (0.0%) | 0 (0.0%) |
| All other Fuels | 6 (1.1%) | 0 (0.0%) |
| No Fuel Used | 0 (0.0%) | 0 (0.0%) |
| Total | 522 (100.0%) | 150 (100.0%) |
Household Vehicle Usage in Lane County
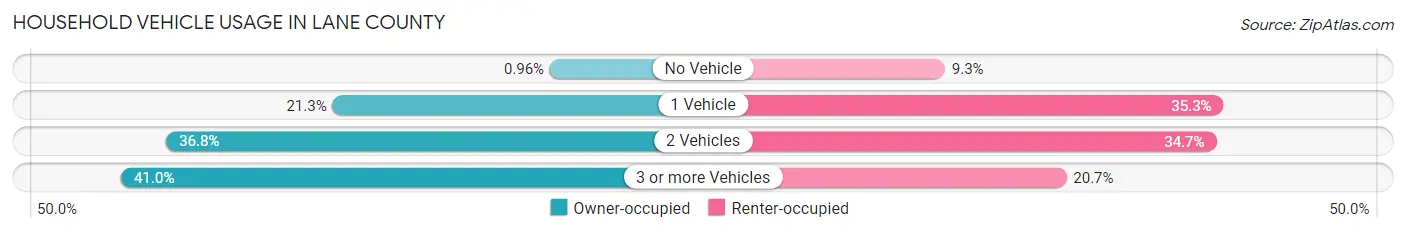
| Vehicles per Household | Owner-occupied | Renter-occupied |
| No Vehicle | 5 (1.0%) | 14 (9.3%) |
| 1 Vehicle | 111 (21.3%) | 53 (35.3%) |
| 2 Vehicles | 192 (36.8%) | 52 (34.7%) |
| 3 or more Vehicles | 214 (41.0%) | 31 (20.7%) |
| Total | 522 (100.0%) | 150 (100.0%) |
Real Estate & Mortgages in Lane County
Real Estate and Mortgage Overview in Lane County
| Characteristic | Without Mortgage | With Mortgage |
| Housing Units | 351 | 171 |
| Median Property Value | $69,200 | $141,300 |
| Median Household Income | $41,406 | $34 |
| Monthly Housing Costs | $417 | $18 |
| Real Estate Taxes | $1,316 | $0 |
Property Value by Mortgage Status in Lane County
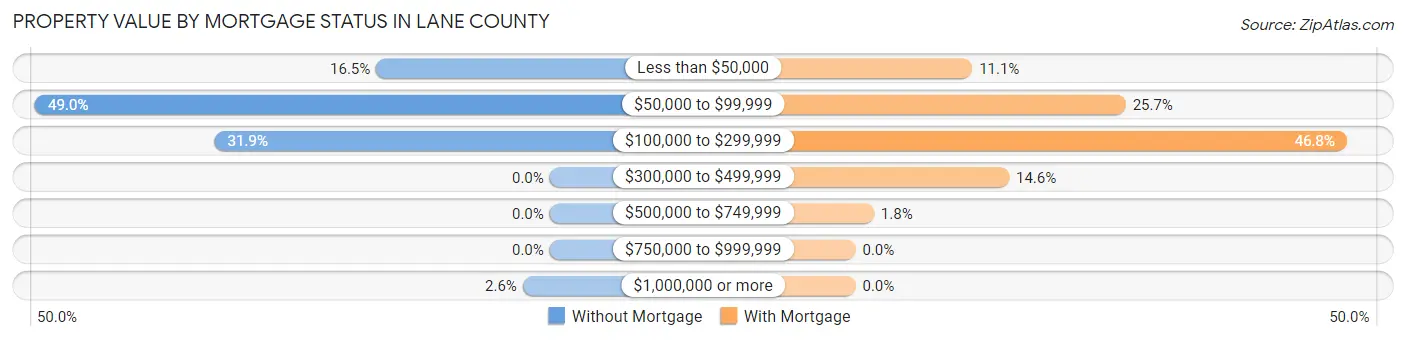
| Property Value | Without Mortgage | With Mortgage |
| Less than $50,000 | 58 (16.5%) | 19 (11.1%) |
| $50,000 to $99,999 | 172 (49.0%) | 44 (25.7%) |
| $100,000 to $299,999 | 112 (31.9%) | 80 (46.8%) |
| $300,000 to $499,999 | 0 (0.0%) | 25 (14.6%) |
| $500,000 to $749,999 | 0 (0.0%) | 3 (1.8%) |
| $750,000 to $999,999 | 0 (0.0%) | 0 (0.0%) |
| $1,000,000 or more | 9 (2.6%) | 0 (0.0%) |
| Total | 351 (100.0%) | 171 (100.0%) |
Household Income by Mortgage Status in Lane County
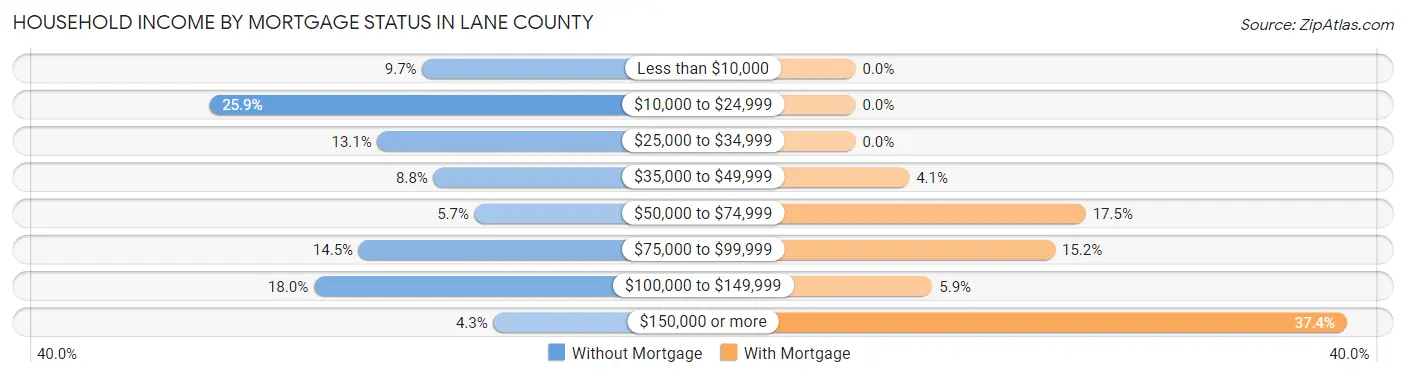
| Household Income | Without Mortgage | With Mortgage |
| Less than $10,000 | 34 (9.7%) | 0 (0.0%) |
| $10,000 to $24,999 | 91 (25.9%) | 0 (0.0%) |
| $25,000 to $34,999 | 46 (13.1%) | 0 (0.0%) |
| $35,000 to $49,999 | 31 (8.8%) | 7 (4.1%) |
| $50,000 to $74,999 | 20 (5.7%) | 30 (17.5%) |
| $75,000 to $99,999 | 51 (14.5%) | 26 (15.2%) |
| $100,000 to $149,999 | 63 (17.9%) | 10 (5.9%) |
| $150,000 or more | 15 (4.3%) | 64 (37.4%) |
| Total | 351 (100.0%) | 171 (100.0%) |
Property Value to Household Income Ratio in Lane County
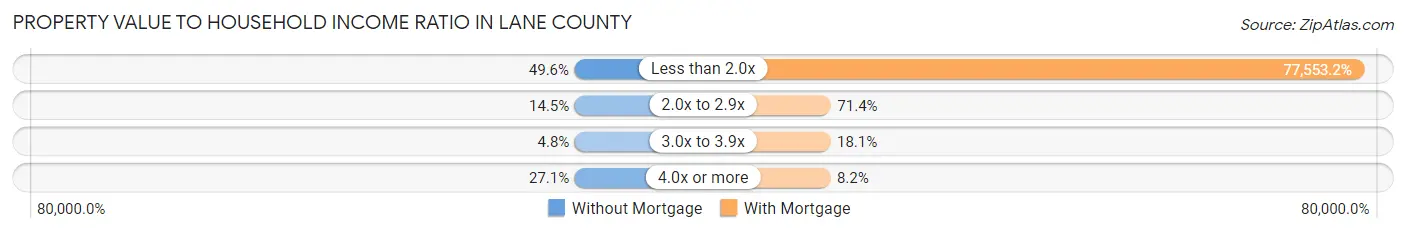
| Value-to-Income Ratio | Without Mortgage | With Mortgage |
| Less than 2.0x | 174 (49.6%) | 132,616 (77,553.2%) |
| 2.0x to 2.9x | 51 (14.5%) | 122 (71.4%) |
| 3.0x to 3.9x | 17 (4.8%) | 31 (18.1%) |
| 4.0x or more | 95 (27.1%) | 14 (8.2%) |
| Total | 351 (100.0%) | 171 (100.0%) |
Real Estate Taxes by Mortgage Status in Lane County
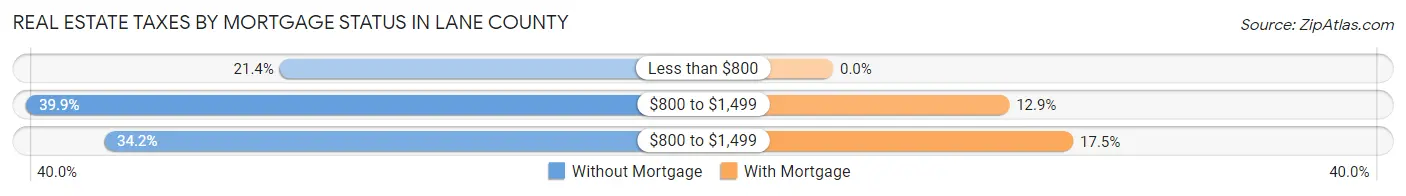
| Property Taxes | Without Mortgage | With Mortgage |
| Less than $800 | 75 (21.4%) | 0 (0.0%) |
| $800 to $1,499 | 140 (39.9%) | 22 (12.9%) |
| $800 to $1,499 | 120 (34.2%) | 30 (17.5%) |
| Total | 351 (100.0%) | 171 (100.0%) |
Health & Disability in Lane County
Health Insurance Coverage by Age in Lane County
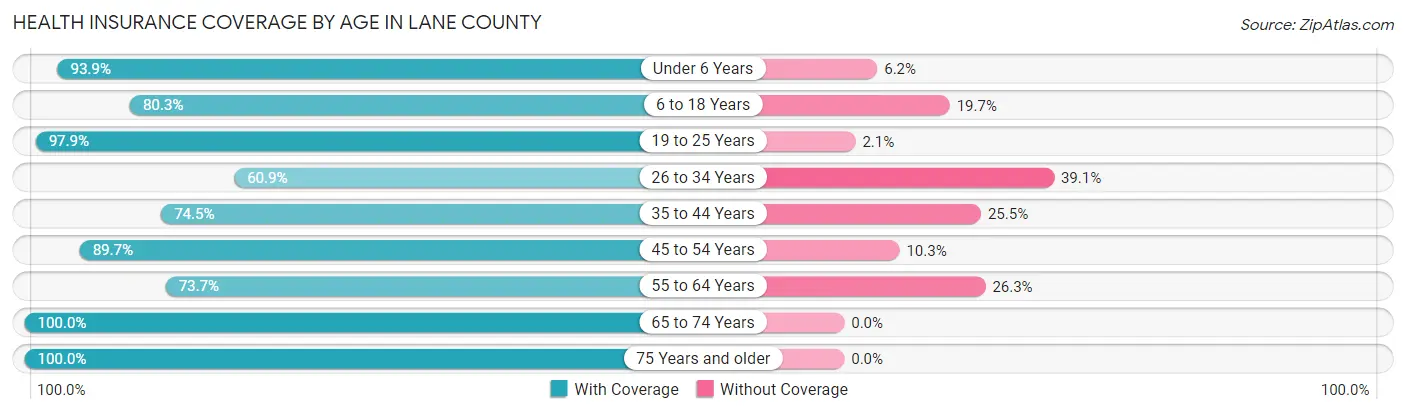
| Age Bracket | With Coverage | Without Coverage |
| Under 6 Years | 61 (93.9%) | 4 (6.1%) |
| 6 to 18 Years | 233 (80.3%) | 57 (19.7%) |
| 19 to 25 Years | 94 (97.9%) | 2 (2.1%) |
| 26 to 34 Years | 81 (60.9%) | 52 (39.1%) |
| 35 to 44 Years | 114 (74.5%) | 39 (25.5%) |
| 45 to 54 Years | 183 (89.7%) | 21 (10.3%) |
| 55 to 64 Years | 182 (73.7%) | 65 (26.3%) |
| 65 to 74 Years | 208 (100.0%) | 0 (0.0%) |
| 75 Years and older | 127 (100.0%) | 0 (0.0%) |
| Total | 1,283 (84.2%) | 240 (15.8%) |
Health Insurance Coverage by Citizenship Status in Lane County
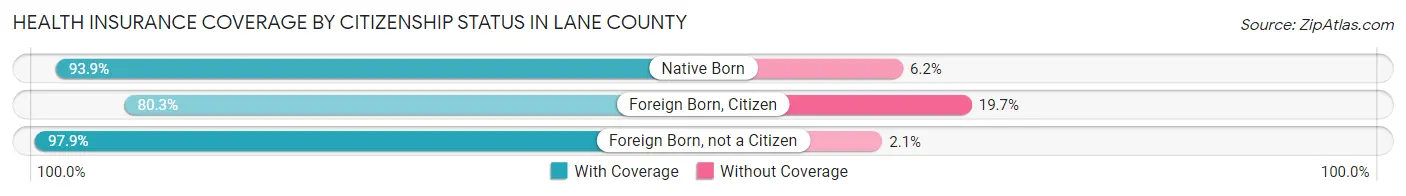
| Citizenship Status | With Coverage | Without Coverage |
| Native Born | 61 (93.9%) | 4 (6.1%) |
| Foreign Born, Citizen | 233 (80.3%) | 57 (19.7%) |
| Foreign Born, not a Citizen | 94 (97.9%) | 2 (2.1%) |
Health Insurance Coverage by Household Income in Lane County
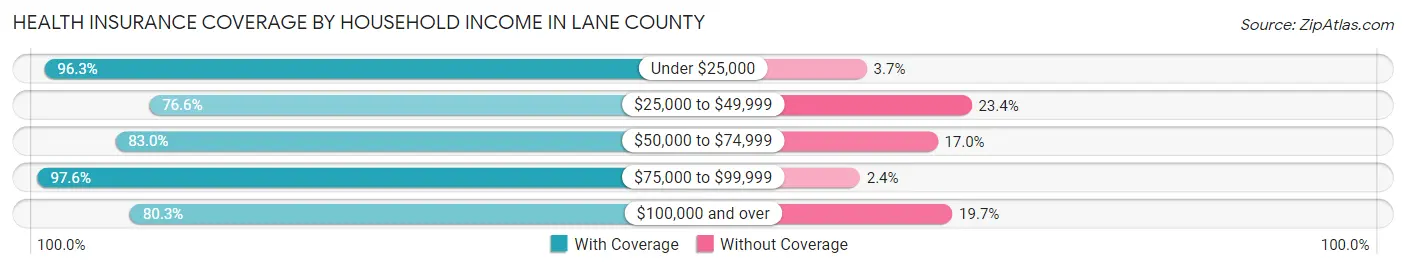
| Household Income | With Coverage | Without Coverage |
| Under $25,000 | 181 (96.3%) | 7 (3.7%) |
| $25,000 to $49,999 | 233 (76.6%) | 71 (23.4%) |
| $50,000 to $74,999 | 176 (83.0%) | 36 (17.0%) |
| $75,000 to $99,999 | 201 (97.6%) | 5 (2.4%) |
| $100,000 and over | 492 (80.3%) | 121 (19.7%) |
Public vs Private Health Insurance Coverage by Age in Lane County
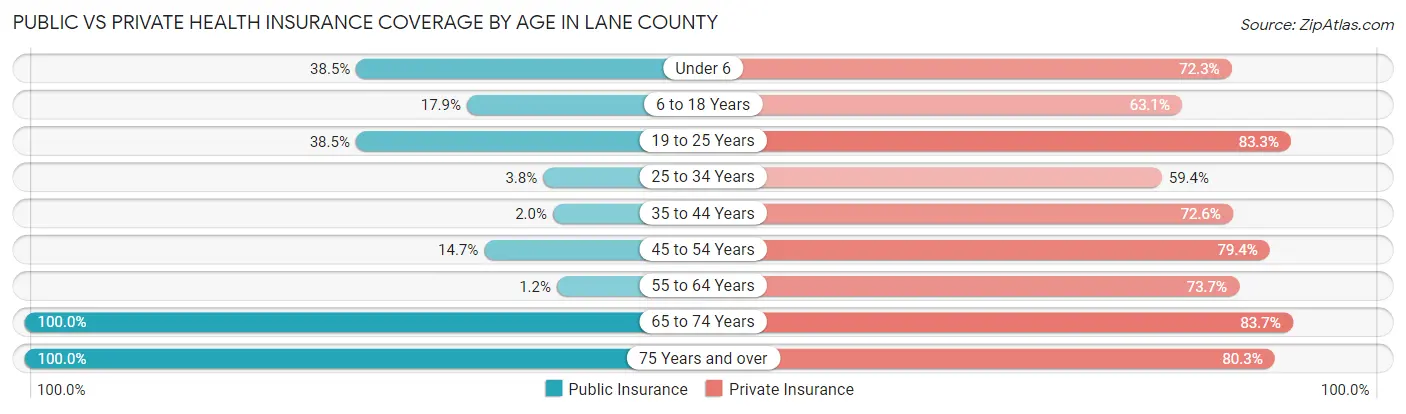
| Age Bracket | Public Insurance | Private Insurance |
| Under 6 | 25 (38.5%) | 47 (72.3%) |
| 6 to 18 Years | 52 (17.9%) | 183 (63.1%) |
| 19 to 25 Years | 37 (38.5%) | 80 (83.3%) |
| 25 to 34 Years | 5 (3.8%) | 79 (59.4%) |
| 35 to 44 Years | 3 (2.0%) | 111 (72.6%) |
| 45 to 54 Years | 30 (14.7%) | 162 (79.4%) |
| 55 to 64 Years | 3 (1.2%) | 182 (73.7%) |
| 65 to 74 Years | 208 (100.0%) | 174 (83.7%) |
| 75 Years and over | 127 (100.0%) | 102 (80.3%) |
| Total | 490 (32.2%) | 1,120 (73.5%) |
Disability Status by Sex by Age in Lane County
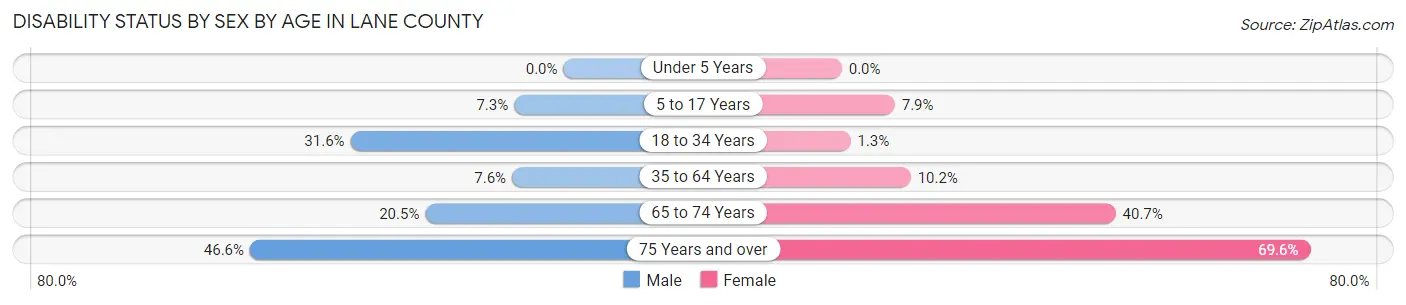
| Age Bracket | Male | Female |
| Under 5 Years | 0 (0.0%) | 0 (0.0%) |
| 5 to 17 Years | 9 (7.3%) | 10 (7.9%) |
| 18 to 34 Years | 37 (31.6%) | 2 (1.3%) |
| 35 to 64 Years | 23 (7.6%) | 31 (10.2%) |
| 65 to 74 Years | 24 (20.5%) | 37 (40.7%) |
| 75 Years and over | 27 (46.6%) | 48 (69.6%) |
Disability Class by Sex by Age in Lane County
Disability Class: Hearing Difficulty
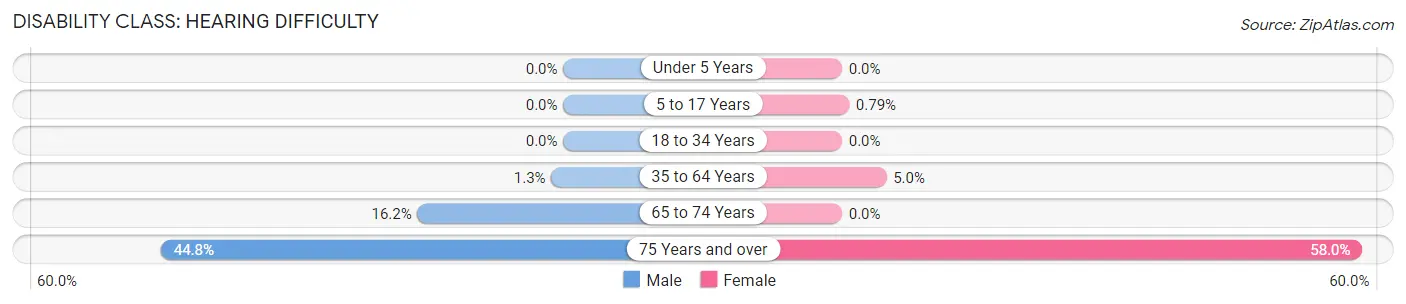
| Age Bracket | Male | Female |
| Under 5 Years | 0 (0.0%) | 0 (0.0%) |
| 5 to 17 Years | 0 (0.0%) | 1 (0.8%) |
| 18 to 34 Years | 0 (0.0%) | 0 (0.0%) |
| 35 to 64 Years | 4 (1.3%) | 15 (5.0%) |
| 65 to 74 Years | 19 (16.2%) | 0 (0.0%) |
| 75 Years and over | 26 (44.8%) | 40 (58.0%) |
Disability Class: Vision Difficulty
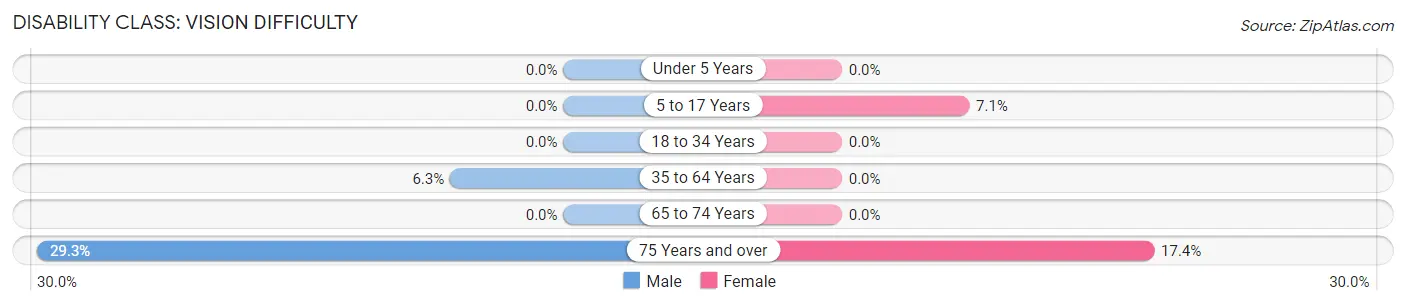
| Age Bracket | Male | Female |
| Under 5 Years | 0 (0.0%) | 0 (0.0%) |
| 5 to 17 Years | 0 (0.0%) | 9 (7.1%) |
| 18 to 34 Years | 0 (0.0%) | 0 (0.0%) |
| 35 to 64 Years | 19 (6.3%) | 0 (0.0%) |
| 65 to 74 Years | 0 (0.0%) | 0 (0.0%) |
| 75 Years and over | 17 (29.3%) | 12 (17.4%) |
Disability Class: Cognitive Difficulty
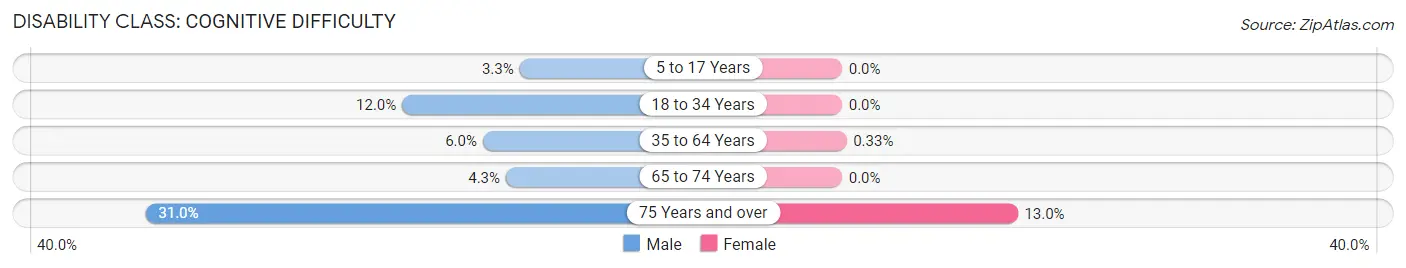
| Age Bracket | Male | Female |
| 5 to 17 Years | 4 (3.3%) | 0 (0.0%) |
| 18 to 34 Years | 14 (12.0%) | 0 (0.0%) |
| 35 to 64 Years | 18 (6.0%) | 1 (0.3%) |
| 65 to 74 Years | 5 (4.3%) | 0 (0.0%) |
| 75 Years and over | 18 (31.0%) | 9 (13.0%) |
Disability Class: Ambulatory Difficulty
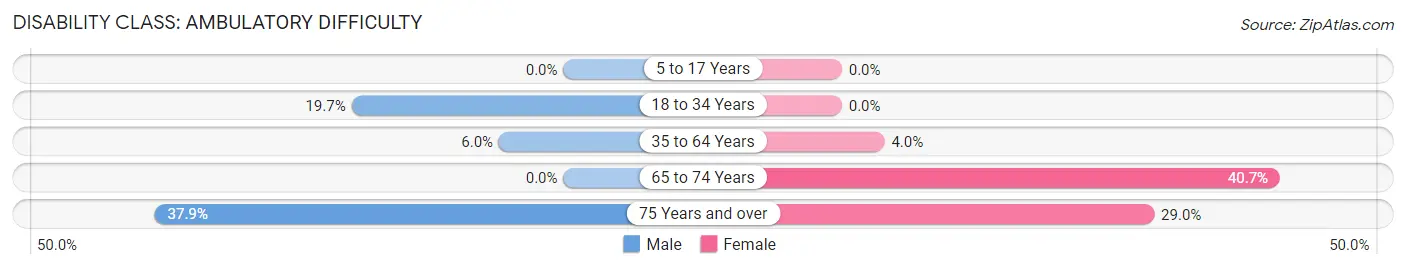
| Age Bracket | Male | Female |
| 5 to 17 Years | 0 (0.0%) | 0 (0.0%) |
| 18 to 34 Years | 23 (19.7%) | 0 (0.0%) |
| 35 to 64 Years | 18 (6.0%) | 12 (4.0%) |
| 65 to 74 Years | 0 (0.0%) | 37 (40.7%) |
| 75 Years and over | 22 (37.9%) | 20 (29.0%) |
Disability Class: Self-Care Difficulty
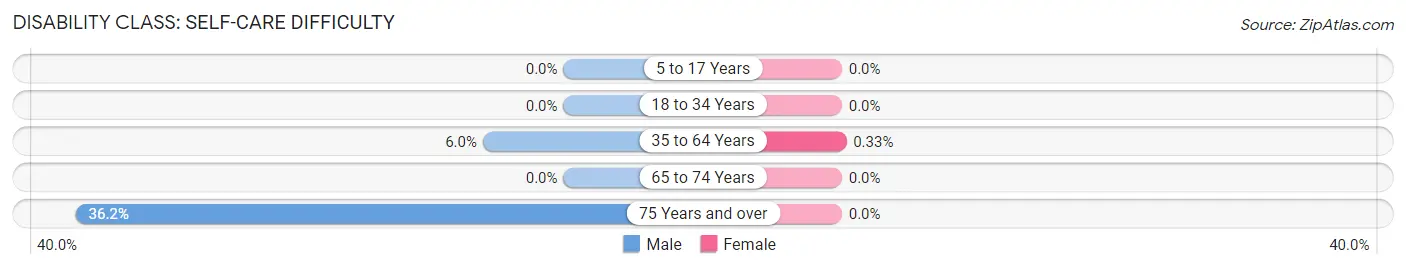
| Age Bracket | Male | Female |
| 5 to 17 Years | 0 (0.0%) | 0 (0.0%) |
| 18 to 34 Years | 0 (0.0%) | 0 (0.0%) |
| 35 to 64 Years | 18 (6.0%) | 1 (0.3%) |
| 65 to 74 Years | 0 (0.0%) | 0 (0.0%) |
| 75 Years and over | 21 (36.2%) | 0 (0.0%) |
Technology Access in Lane County
Computing Device Access in Lane County
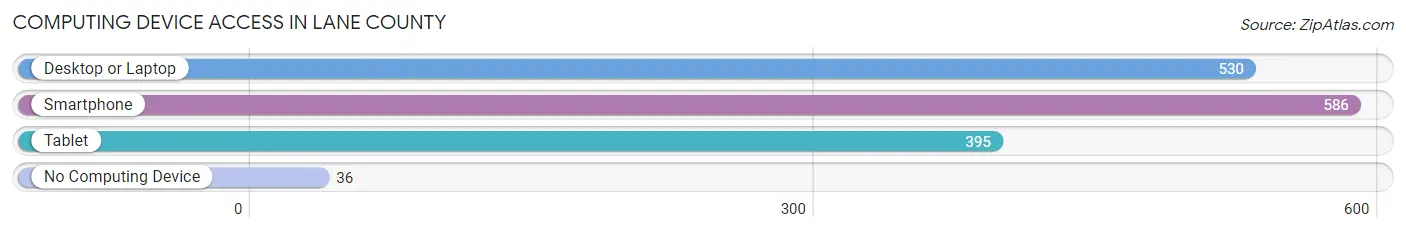
| Device Type | # Households | % Households |
| Desktop or Laptop | 530 | 78.9% |
| Smartphone | 586 | 87.2% |
| Tablet | 395 | 58.8% |
| No Computing Device | 36 | 5.4% |
| Total | 672 | 100.0% |
Internet Access in Lane County
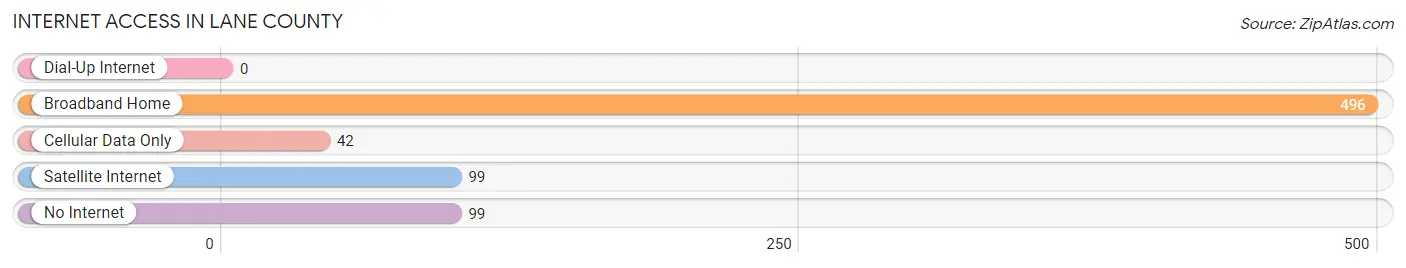
| Internet Type | # Households | % Households |
| Dial-Up Internet | 0 | 0.0% |
| Broadband Home | 496 | 73.8% |
| Cellular Data Only | 42 | 6.2% |
| Satellite Internet | 99 | 14.7% |
| No Internet | 99 | 14.7% |
| Total | 672 | 100.0% |
Lane County Summary
Lane County is located in the southwestern corner of Kansas, and is bordered by Oklahoma to the south, Colorado to the west, and Nebraska to the north. The county seat is Dighton, and the largest city is Scott City. The county was named after James Henry Lane, a Civil War hero and Kansas senator.
Geography
Lane County covers an area of 1,092 square miles, making it the fourth largest county in Kansas. The county is mostly flat, with some rolling hills in the east. The Arkansas River runs through the county, and there are several small lakes and reservoirs. The county is mostly rural, with some small towns and villages scattered throughout. The climate is semi-arid, with hot summers and cold winters.
Demographics
As of the 2010 census, Lane County had a population of 8,845. The population was spread out, with 24.3% under the age of 18, 8.2% from 18 to 24, 25.2% from 25 to 44, 25.2% from 45 to 64, and 17.1% who were 65 years of age or older. The median age was 39.4 years. The gender makeup of the county was 49.7% male and 50.3% female.
Economy
Lane County is largely agricultural, with wheat, corn, and sorghum being the main crops. Cattle and sheep are also raised in the county. The county is also home to several oil and gas fields, and there are several small manufacturing companies in the area. The county also has a large tourism industry, with several state parks and recreational areas.
History
Lane County was established in 1873, and was named after James Henry Lane, a Civil War hero and Kansas senator. The county was originally populated by Native Americans, and the first settlers arrived in the late 1800s. The county was largely agricultural, and the population grew steadily throughout the 20th century. The county was also home to several oil and gas fields, which helped to boost the economy.
Today, Lane County is a largely rural area, with a population of just over 8,000. The county is still largely agricultural, and the economy is bolstered by the oil and gas industry, as well as tourism. The county is home to several state parks and recreational areas, and is a popular destination for outdoor enthusiasts.
Common Questions
What is Per Capita Income in Lane County?
Per Capita income in Lane County is $35,779.
What is the Median Family Income in Lane County?
Median Family Income in Lane County is $84,107.
What is the Median Household income in Lane County?
Median Household Income in Lane County is $52,222.
What is Income or Wage Gap in Lane County?
Income or Wage Gap in Lane County is 35.3%.
Women in Lane County earn 64.7 cents for every dollar earned by a man.
What is Inequality or Gini Index in Lane County?
Inequality or Gini Index in Lane County is 0.45.
What is the Total Population of Lane County?
Total Population of Lane County is 1,528.
What is the Total Male Population of Lane County?
Total Male Population of Lane County is 754.
What is the Total Female Population of Lane County?
Total Female Population of Lane County is 774.
What is the Ratio of Males per 100 Females in Lane County?
There are 97.42 Males per 100 Females in Lane County.
What is the Ratio of Females per 100 Males in Lane County?
There are 102.65 Females per 100 Males in Lane County.
What is the Median Population Age in Lane County?
Median Population Age in Lane County is 47.9 Years.
What is the Average Family Size in Lane County
Average Family Size in Lane County is 2.9 People.
What is the Average Household Size in Lane County
Average Household Size in Lane County is 2.3 People.
How Large is the Labor Force in Lane County?
There are 803 People in the Labor Forcein in Lane County.
What is the Percentage of People in the Labor Force in Lane County?
64.1% of People are in the Labor Force in Lane County.
What is the Unemployment Rate in Lane County?
Unemployment Rate in Lane County is 0.4%.