Zip Codes with the Highest Percentage of Population Employed in Community & Social Service in Hammond, IN
RELATED REPORTS & OPTIONS
Community & Social Service
Hammond
Compare Zip Codes
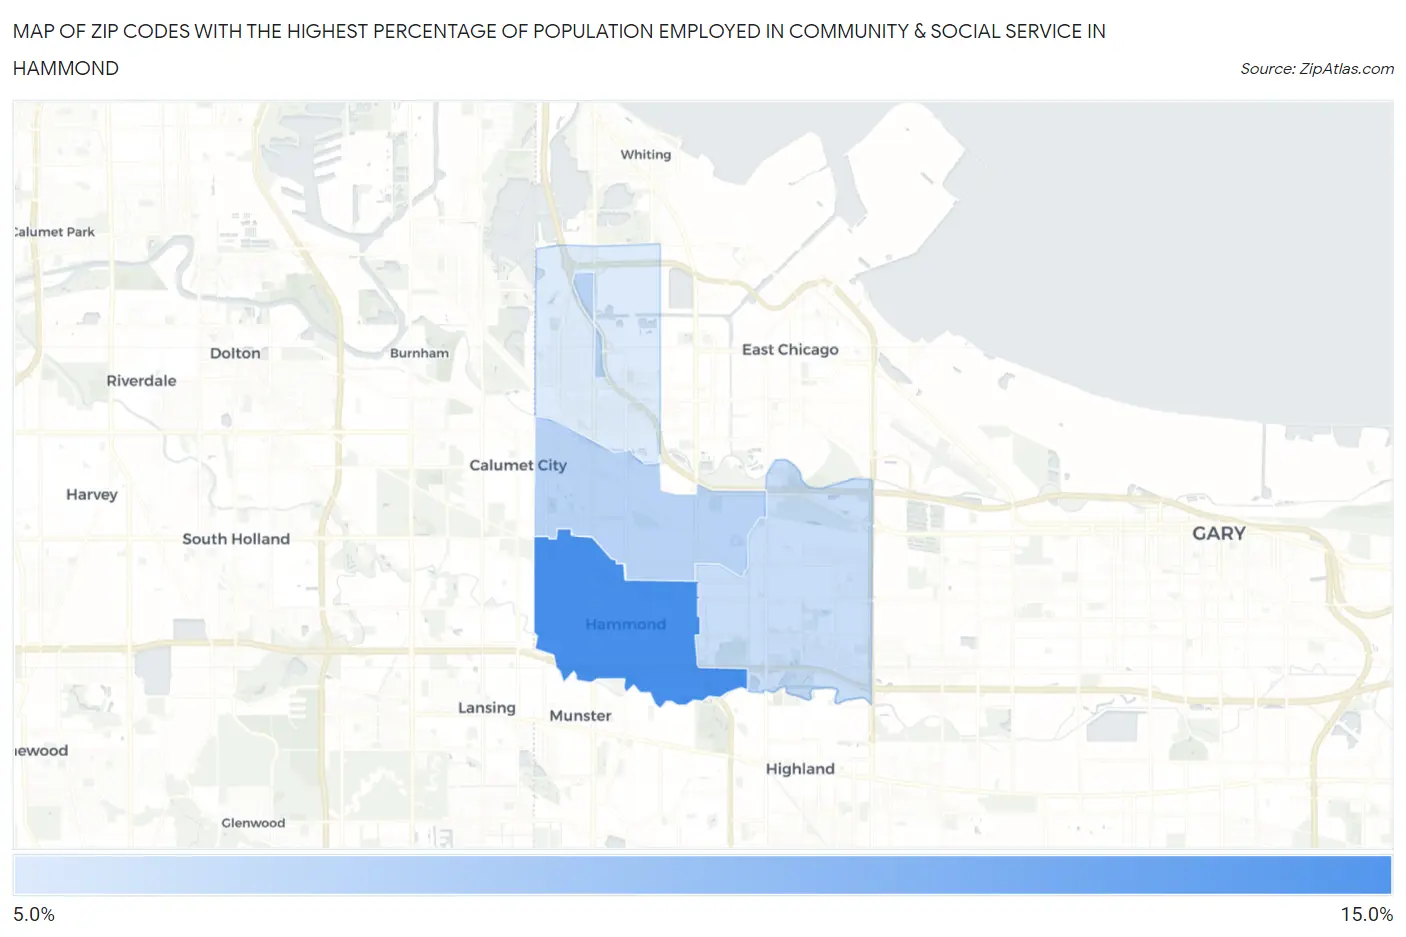
Map of Zip Codes with the Highest Percentage of Population Employed in Community & Social Service in Hammond
5.5%
12.1%
Zip Codes with the Highest Percentage of Population Employed in Community & Social Service in Hammond, IN
| Zip Code | % Employed | vs State | vs National | |
| 1. | 46324 | 12.1% | 9.7%(+2.37)#119 | 11.2%(+0.879)#9,181 |
| 2. | 46320 | 7.0% | 9.7%(-2.68)#434 | 11.2%(-4.17)#22,022 |
| 3. | 46323 | 6.4% | 9.7%(-3.35)#477 | 11.2%(-4.84)#23,553 |
| 4. | 46327 | 5.5% | 9.7%(-4.27)#548 | 11.2%(-5.76)#25,411 |
1
Common Questions
What are the Top 3 Zip Codes with the Highest Percentage of Population Employed in Community & Social Service in Hammond, IN?
Top 3 Zip Codes with the Highest Percentage of Population Employed in Community & Social Service in Hammond, IN are:
What zip code has the Highest Percentage of Population Employed in Community & Social Service in Hammond, IN?
46324 has the Highest Percentage of Population Employed in Community & Social Service in Hammond, IN with 12.1%.
What is the Percentage of Population Employed in Community & Social Service in Hammond, IN?
Percentage of Population Employed in Community & Social Service in Hammond is 7.9%.
What is the Percentage of Population Employed in Community & Social Service in Indiana?
Percentage of Population Employed in Community & Social Service in Indiana is 9.7%.
What is the Percentage of Population Employed in Community & Social Service in the United States?
Percentage of Population Employed in Community & Social Service in the United States is 11.2%.