Zip Codes with the Highest Percentage of Population with a Degree in Science and Engineering in Hammond, IN
RELATED REPORTS & OPTIONS
Science and Engineering
Hammond
Compare Zip Codes
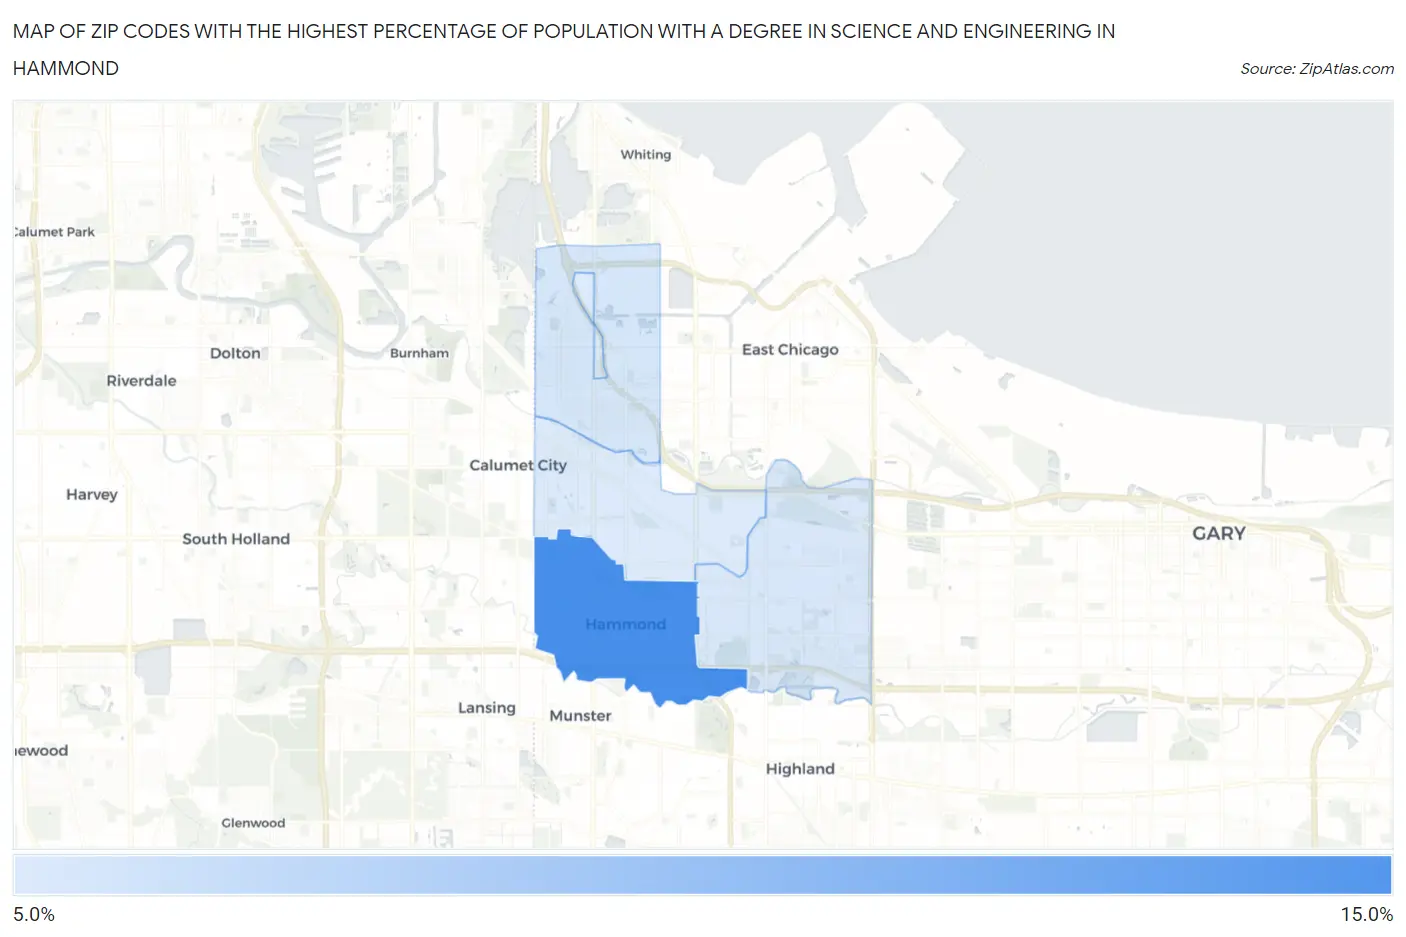
Map of Zip Codes with the Highest Percentage of Population with a Degree in Science and Engineering in Hammond
6.1%
11.6%
Zip Codes with the Highest Percentage of Population with a Degree in Science and Engineering in Hammond, IN
| Zip Code | % Graduates | vs State | vs National | |
| 1. | 46324 | 11.6% | 12.7%(-1.02)#404 | 9.8%(+1.87)#11,572 |
| 2. | 46327 | 6.4% | 12.7%(-6.31)#590 | 9.8%(-3.42)#22,825 |
| 3. | 46323 | 6.3% | 12.7%(-6.40)#594 | 9.8%(-3.51)#22,977 |
| 4. | 46320 | 6.1% | 12.7%(-6.57)#597 | 9.8%(-3.69)#23,298 |
1
Common Questions
What are the Top 3 Zip Codes with the Highest Percentage of Population with a Degree in Science and Engineering in Hammond, IN?
Top 3 Zip Codes with the Highest Percentage of Population with a Degree in Science and Engineering in Hammond, IN are:
What zip code has the Highest Percentage of Population with a Degree in Science and Engineering in Hammond, IN?
46324 has the Highest Percentage of Population with a Degree in Science and Engineering in Hammond, IN with 11.6%.
What is the Percentage of Population with a Degree in Science and Engineering in Hammond, IN?
Percentage of Population with a Degree in Science and Engineering in Hammond is 11.4%.
What is the Percentage of Population with a Degree in Science and Engineering in Indiana?
Percentage of Population with a Degree in Science and Engineering in Indiana is 12.7%.
What is the Percentage of Population with a Degree in Science and Engineering in the United States?
Percentage of Population with a Degree in Science and Engineering in the United States is 9.8%.