Zip Codes with the Highest Percentage of Private Company Employees in Hammond, IN
RELATED REPORTS & OPTIONS
Private Company Employees
Hammond
Compare Zip Codes
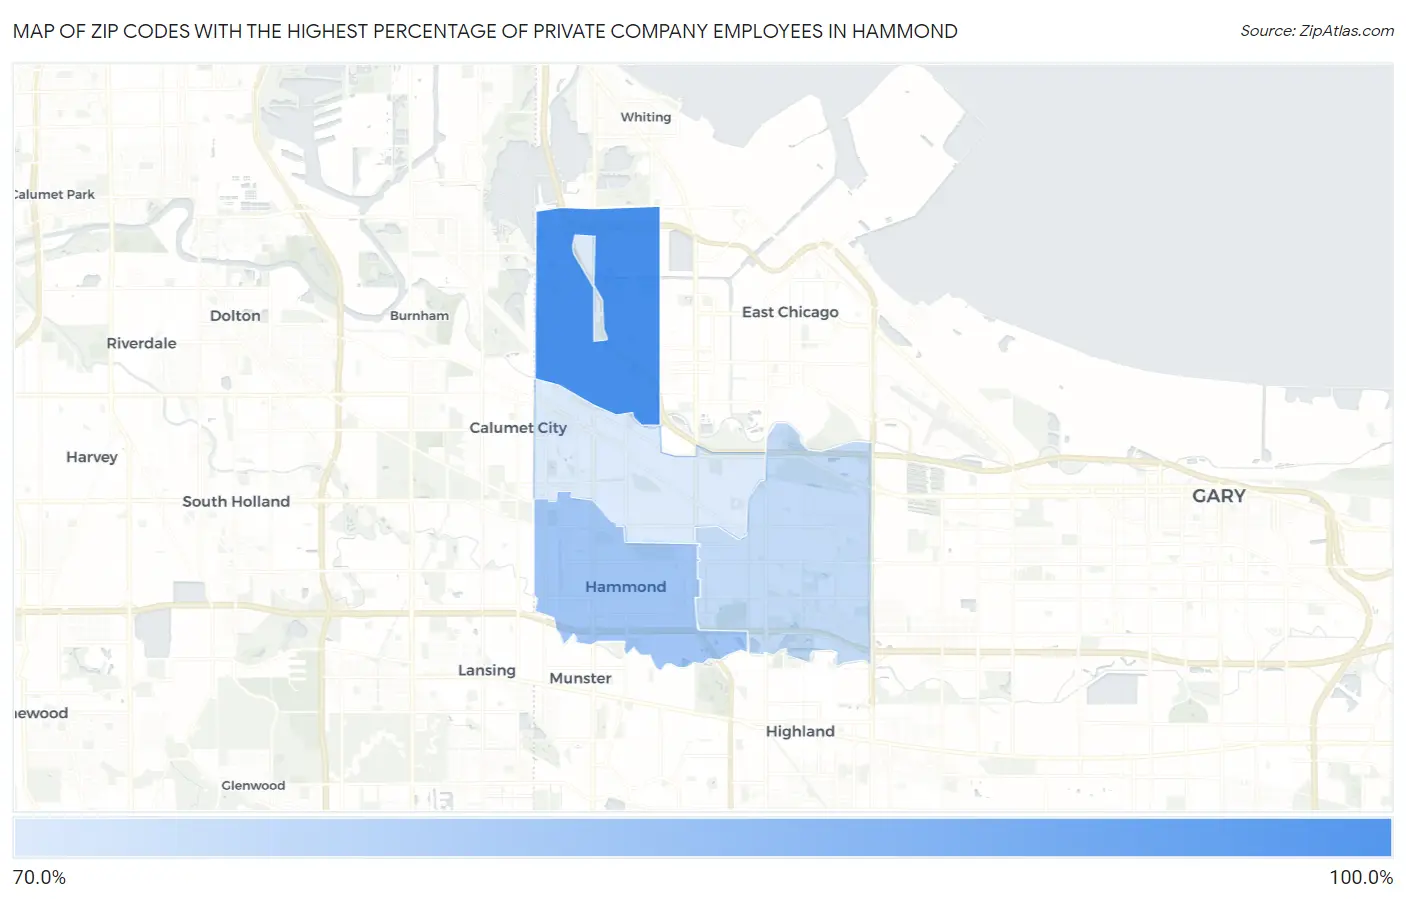
Map of Zip Codes with the Highest Percentage of Private Company Employees in Hammond
72.5%
81.2%
Zip Codes with the Highest Percentage of Private Company Employees in Hammond, IN
| Zip Code | % Private Company Employees | vs State | vs National | |
| 1. | 46327 | 81.2% | 70.9%(+10.2)#67 | 66.9%(+14.3)#1,993 |
| 2. | 46324 | 75.9% | 70.9%(+4.97)#180 | 66.9%(+9.02)#4,235 |
| 3. | 46323 | 73.9% | 70.9%(+3.00)#256 | 66.9%(+7.06)#5,815 |
| 4. | 46320 | 72.5% | 70.9%(+1.59)#332 | 66.9%(+5.65)#7,237 |
1
Common Questions
What are the Top 3 Zip Codes with the Highest Percentage of Private Company Employees in Hammond, IN?
Top 3 Zip Codes with the Highest Percentage of Private Company Employees in Hammond, IN are:
What zip code has the Highest Percentage of Private Company Employees in Hammond, IN?
46327 has the Highest Percentage of Private Company Employees in Hammond, IN with 81.2%.
What is the Percentage of Private Company Employees in Hammond, IN?
Percentage of Private Company Employees in Hammond is 75.5%.
What is the Percentage of Private Company Employees in Indiana?
Percentage of Private Company Employees in Indiana is 70.9%.
What is the Percentage of Private Company Employees in the United States?
Percentage of Private Company Employees in the United States is 66.9%.