Zip Codes with the Highest Percentage of Population Employed in Business & Financial in Hammond, IN
RELATED REPORTS & OPTIONS
Business & Financial
Hammond
Compare Zip Codes
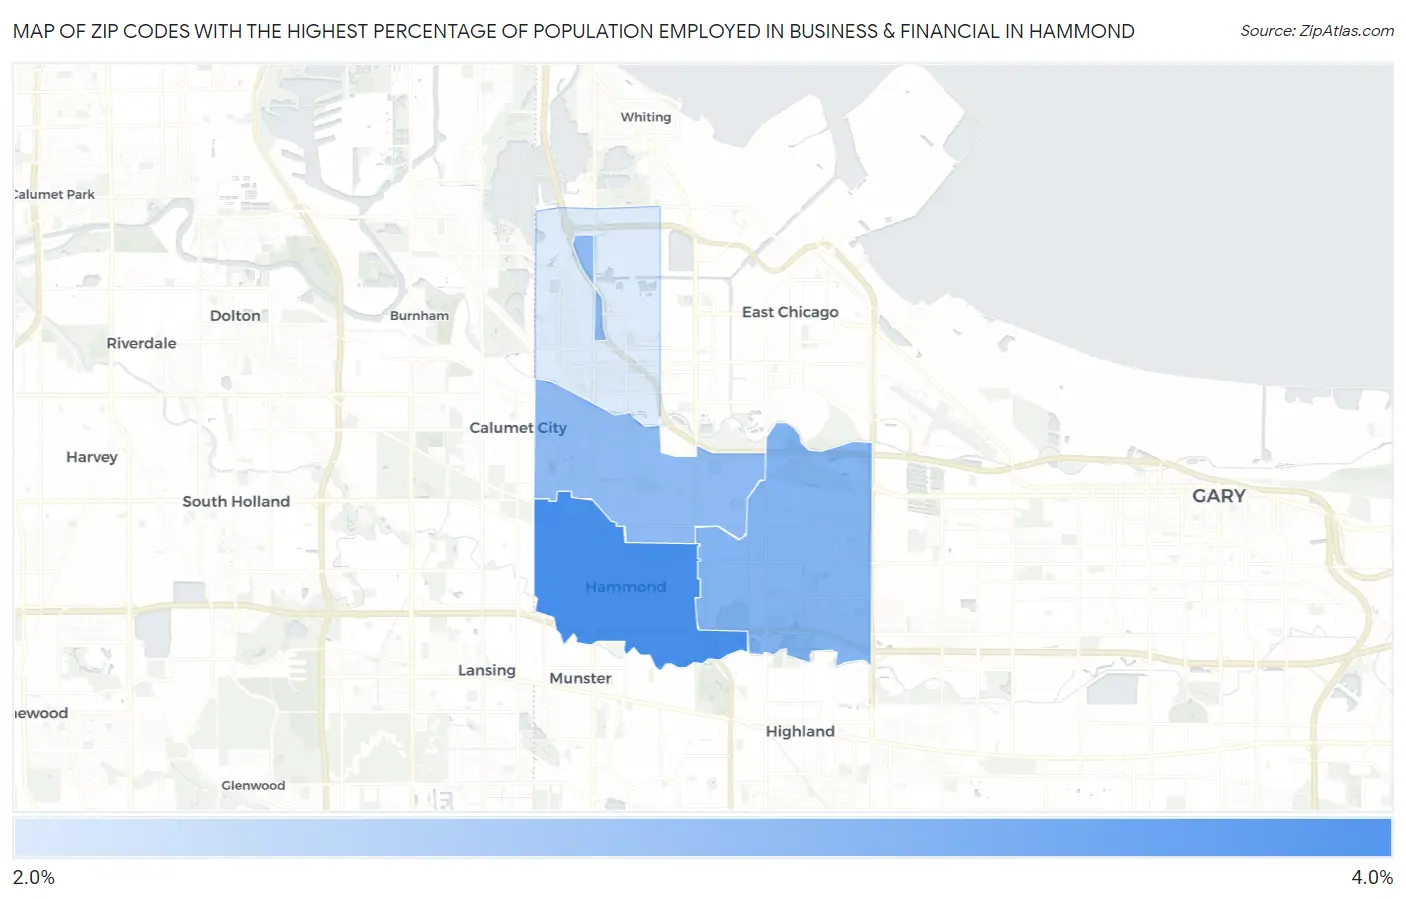
Map of Zip Codes with the Highest Percentage of Population Employed in Business & Financial in Hammond
2.2%
3.5%
Zip Codes with the Highest Percentage of Population Employed in Business & Financial in Hammond, IN
| Zip Code | % Employed | vs State | vs National | |
| 1. | 46324 | 3.5% | 4.8%(-1.30)#331 | 5.8%(-2.29)#15,897 |
| 2. | 46323 | 3.0% | 4.8%(-1.82)#402 | 5.8%(-2.80)#17,984 |
| 3. | 46320 | 2.9% | 4.8%(-1.91)#409 | 5.8%(-2.89)#18,353 |
| 4. | 46327 | 2.2% | 4.8%(-2.59)#494 | 5.8%(-3.58)#21,058 |
1
Common Questions
What are the Top 3 Zip Codes with the Highest Percentage of Population Employed in Business & Financial in Hammond, IN?
Top 3 Zip Codes with the Highest Percentage of Population Employed in Business & Financial in Hammond, IN are:
What zip code has the Highest Percentage of Population Employed in Business & Financial in Hammond, IN?
46324 has the Highest Percentage of Population Employed in Business & Financial in Hammond, IN with 3.5%.
What is the Percentage of Population Employed in Business & Financial in Hammond, IN?
Percentage of Population Employed in Business & Financial in Hammond is 2.8%.
What is the Percentage of Population Employed in Business & Financial in Indiana?
Percentage of Population Employed in Business & Financial in Indiana is 4.8%.
What is the Percentage of Population Employed in Business & Financial in the United States?
Percentage of Population Employed in Business & Financial in the United States is 5.8%.