Zip Codes with the Highest Percentage of Population Employed in Health Diagnosing & Treating in Urbana, IL
RELATED REPORTS & OPTIONS
Health Diagnosing & Treating
Urbana
Compare Zip Codes
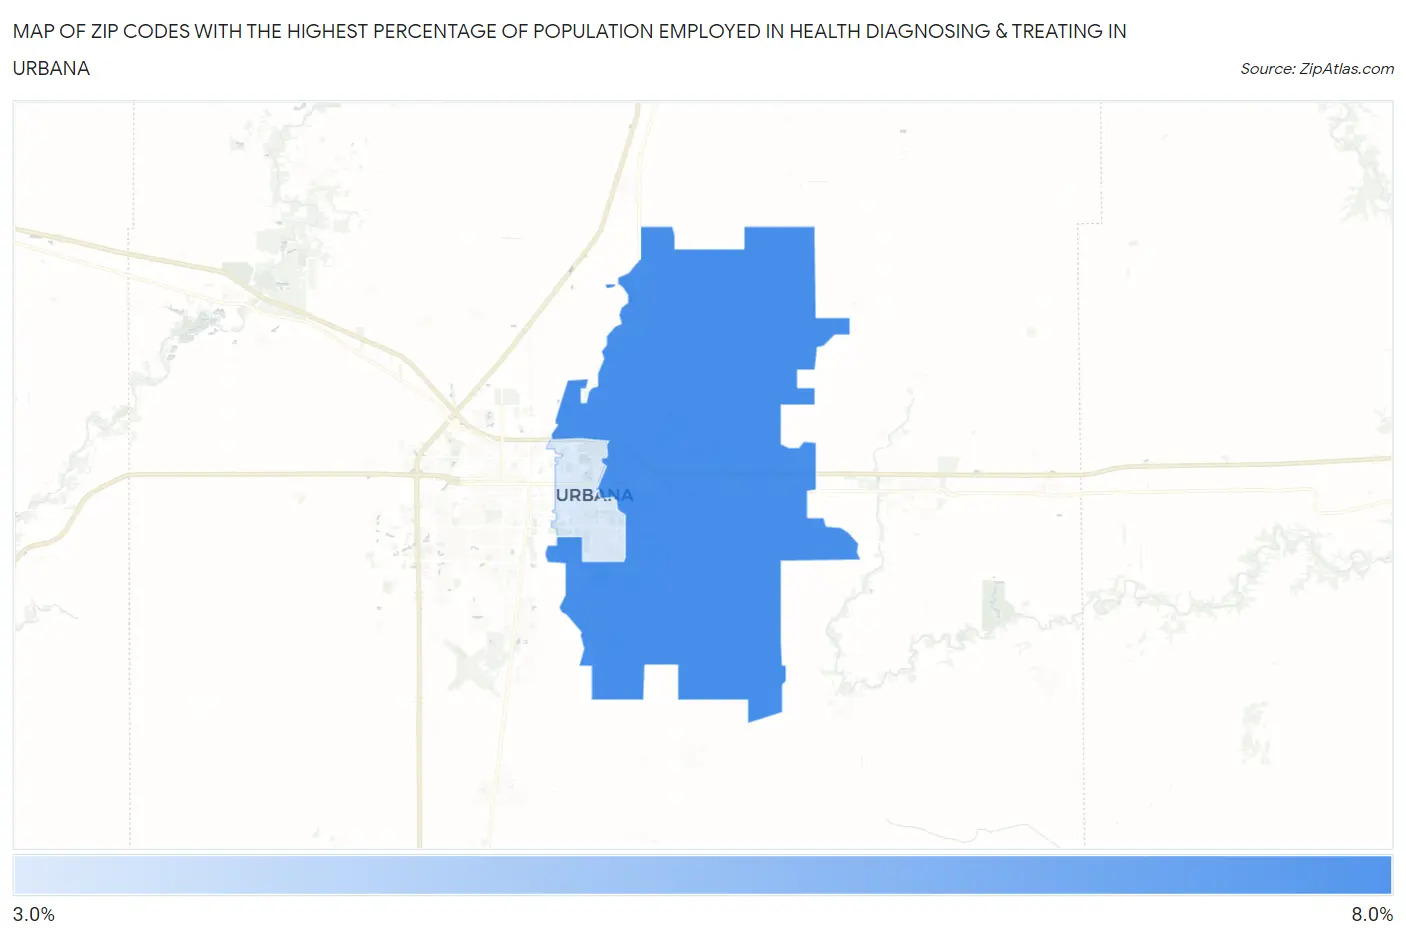
Map of Zip Codes with the Highest Percentage of Population Employed in Health Diagnosing & Treating in Urbana
3.1%
6.1%
Zip Codes with the Highest Percentage of Population Employed in Health Diagnosing & Treating in Urbana, IL
| Zip Code | % Employed | vs State | vs National | |
| 1. | 61802 | 6.1% | 6.2%(-0.121)#627 | 6.2%(-0.129)#13,476 |
| 2. | 61801 | 3.1% | 6.2%(-3.14)#1,122 | 6.2%(-3.15)#24,087 |
1
Common Questions
What are the Top Zip Codes with the Highest Percentage of Population Employed in Health Diagnosing & Treating in Urbana, IL?
Top Zip Codes with the Highest Percentage of Population Employed in Health Diagnosing & Treating in Urbana, IL are:
What zip code has the Highest Percentage of Population Employed in Health Diagnosing & Treating in Urbana, IL?
61802 has the Highest Percentage of Population Employed in Health Diagnosing & Treating in Urbana, IL with 6.1%.
What is the Percentage of Population Employed in Health Diagnosing & Treating in Urbana, IL?
Percentage of Population Employed in Health Diagnosing & Treating in Urbana is 4.5%.
What is the Percentage of Population Employed in Health Diagnosing & Treating in Illinois?
Percentage of Population Employed in Health Diagnosing & Treating in Illinois is 6.2%.
What is the Percentage of Population Employed in Health Diagnosing & Treating in the United States?
Percentage of Population Employed in Health Diagnosing & Treating in the United States is 6.2%.