Zip Codes with the Highest Percentage of Population Employed in Legal Services & Support in Urbana, IL
RELATED REPORTS & OPTIONS
Legal Services & Support
Urbana
Compare Zip Codes
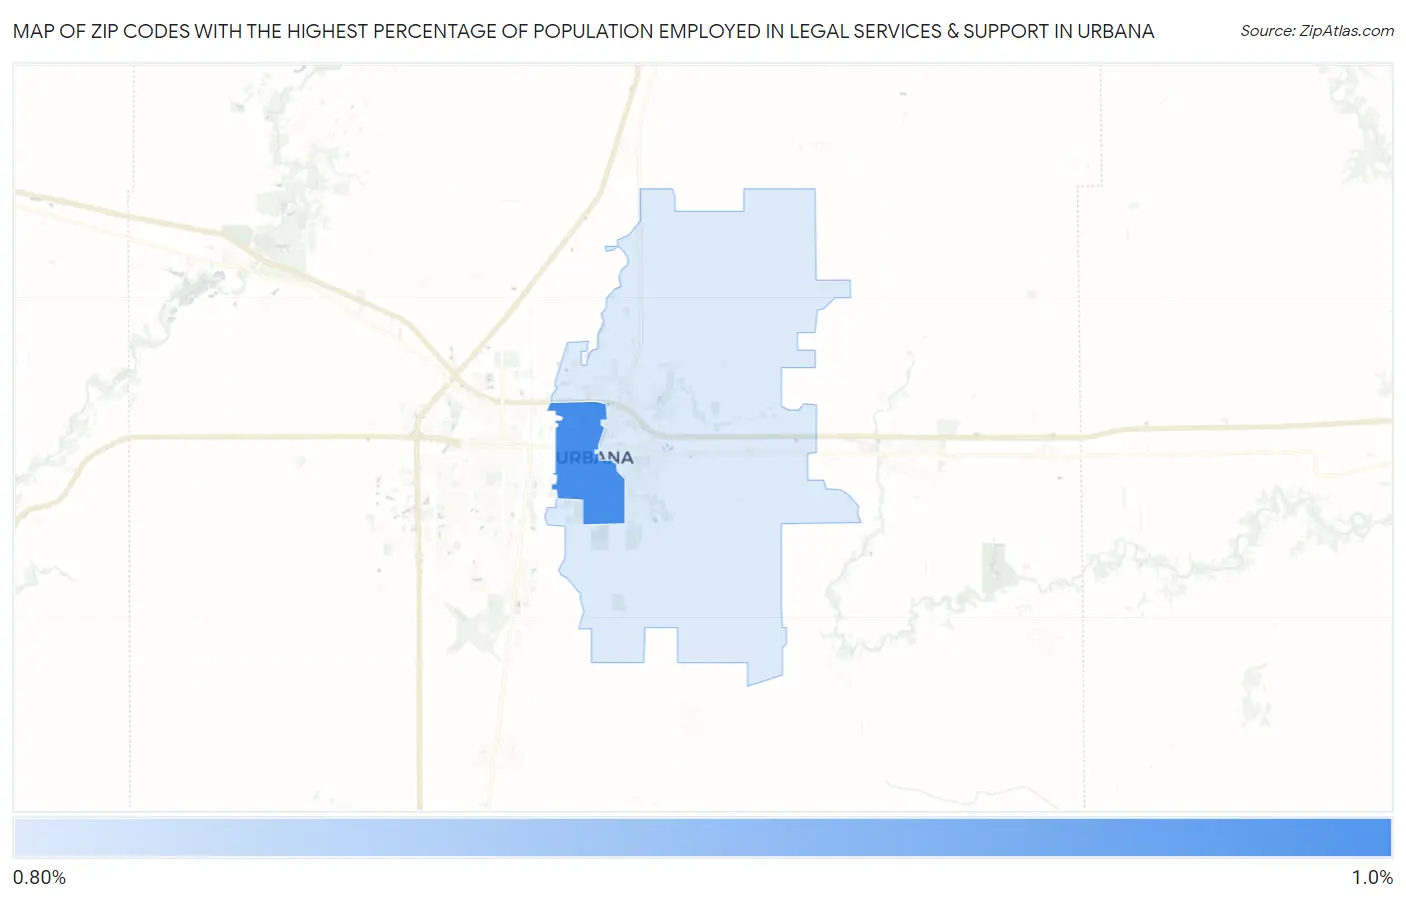
Map of Zip Codes with the Highest Percentage of Population Employed in Legal Services & Support in Urbana
0.84%
0.88%
Zip Codes with the Highest Percentage of Population Employed in Legal Services & Support in Urbana, IL
| Zip Code | % Employed | vs State | vs National | |
| 1. | 61801 | 0.88% | 1.3%(-0.468)#325 | 1.2%(-0.302)#8,769 |
| 2. | 61802 | 0.84% | 1.3%(-0.509)#335 | 1.2%(-0.343)#9,099 |
1
Common Questions
What are the Top Zip Codes with the Highest Percentage of Population Employed in Legal Services & Support in Urbana, IL?
Top Zip Codes with the Highest Percentage of Population Employed in Legal Services & Support in Urbana, IL are:
What zip code has the Highest Percentage of Population Employed in Legal Services & Support in Urbana, IL?
61801 has the Highest Percentage of Population Employed in Legal Services & Support in Urbana, IL with 0.88%.
What is the Percentage of Population Employed in Legal Services & Support in Urbana, IL?
Percentage of Population Employed in Legal Services & Support in Urbana is 1.1%.
What is the Percentage of Population Employed in Legal Services & Support in Illinois?
Percentage of Population Employed in Legal Services & Support in Illinois is 1.3%.
What is the Percentage of Population Employed in Legal Services & Support in the United States?
Percentage of Population Employed in Legal Services & Support in the United States is 1.2%.