Zip Codes with the Highest Percentage of Population Employed in Legal Services & Support in Aurora, IL
RELATED REPORTS & OPTIONS
Legal Services & Support
Aurora
Compare Zip Codes
Map of Zip Codes with the Highest Percentage of Population Employed in Legal Services & Support in Aurora
0.19%
2.0%
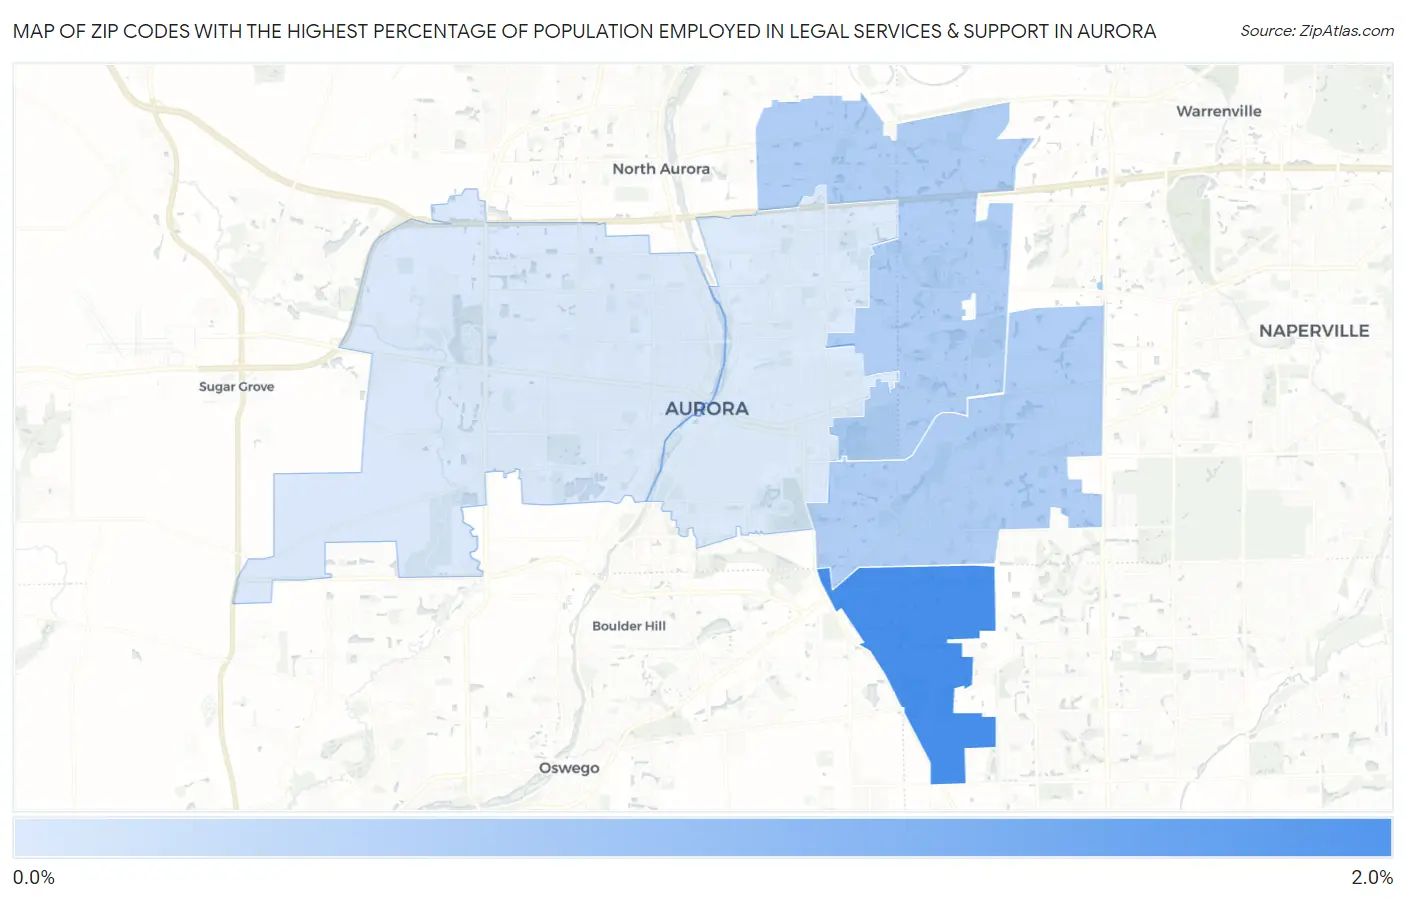
Zip Codes with the Highest Percentage of Population Employed in Legal Services & Support in Aurora, IL
| Zip Code | % Employed | vs State | vs National | |
| 1. | 60503 | 2.0% | 1.3%(+0.622)#142 | 1.2%(+0.787)#3,552 |
| 2. | 60504 | 0.75% | 1.3%(-0.601)#369 | 1.2%(-0.436)#9,947 |
| 3. | 60502 | 0.75% | 1.3%(-0.602)#370 | 1.2%(-0.437)#9,958 |
| 4. | 60506 | 0.20% | 1.3%(-1.14)#658 | 1.2%(-0.979)#16,143 |
| 5. | 60505 | 0.19% | 1.3%(-1.16)#664 | 1.2%(-0.994)#16,298 |
1
Common Questions
What are the Top 3 Zip Codes with the Highest Percentage of Population Employed in Legal Services & Support in Aurora, IL?
Top 3 Zip Codes with the Highest Percentage of Population Employed in Legal Services & Support in Aurora, IL are:
What zip code has the Highest Percentage of Population Employed in Legal Services & Support in Aurora, IL?
60503 has the Highest Percentage of Population Employed in Legal Services & Support in Aurora, IL with 2.0%.
What is the Percentage of Population Employed in Legal Services & Support in Aurora, IL?
Percentage of Population Employed in Legal Services & Support in Aurora is 0.59%.
What is the Percentage of Population Employed in Legal Services & Support in Illinois?
Percentage of Population Employed in Legal Services & Support in Illinois is 1.3%.
What is the Percentage of Population Employed in Legal Services & Support in the United States?
Percentage of Population Employed in Legal Services & Support in the United States is 1.2%.