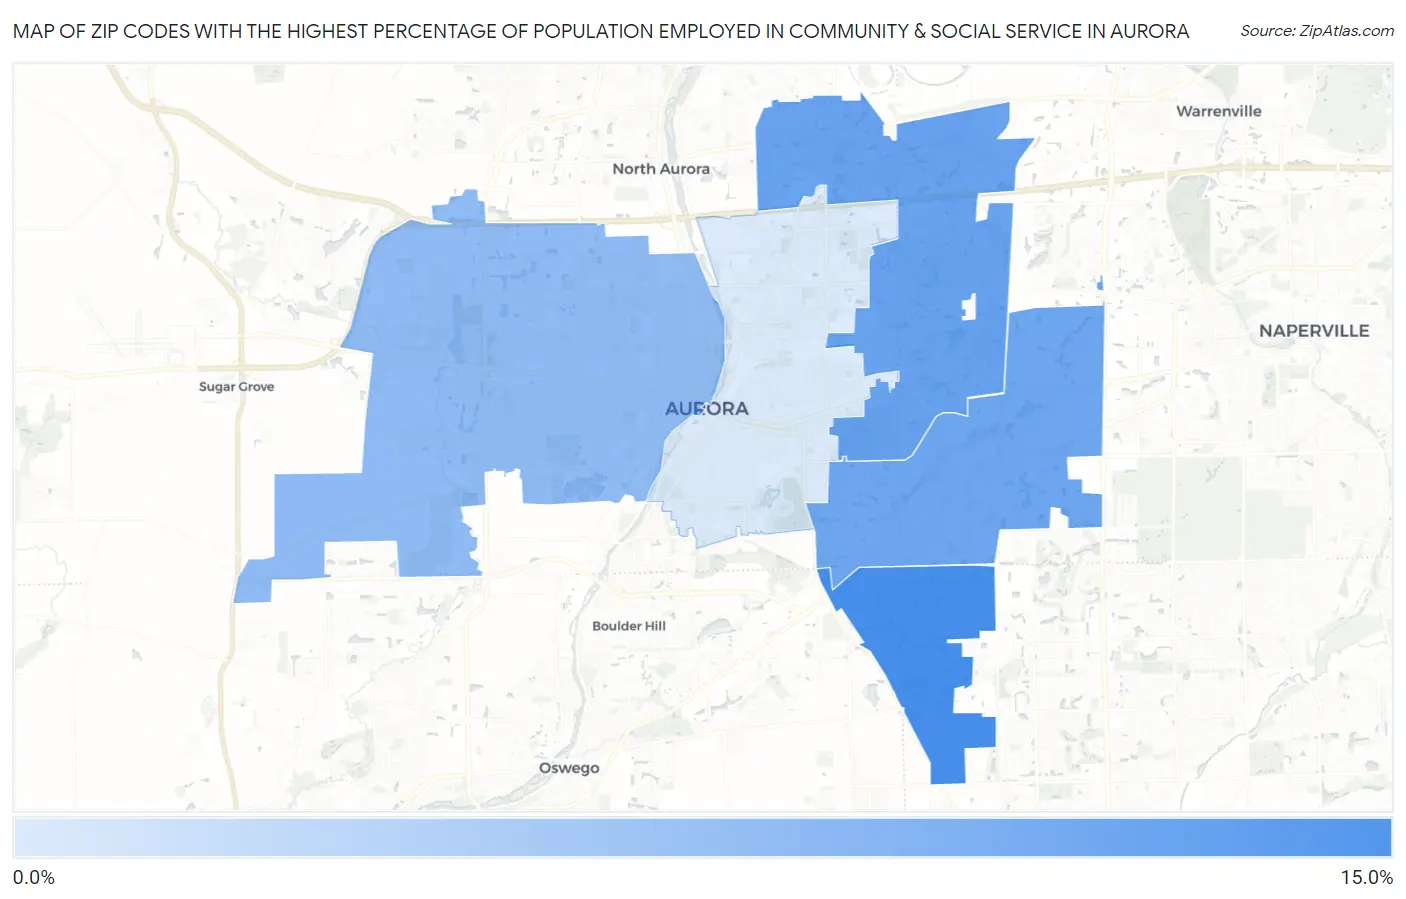
Zip Codes with the Highest Percentage of Population Employed in Community & Social Service in Aurora, IL
RELATED REPORTS & OPTIONS
Community & Social Service
Aurora
Compare Zip Codes
Map of Zip Codes with the Highest Percentage of Population Employed in Community & Social Service in Aurora
4.7%
12.3%
Zip Codes with the Highest Percentage of Population Employed in Community & Social Service in Aurora, IL
| Zip Code | % Employed | vs State | vs National | |
| 1. | 60503 | 12.3% | 11.3%(+1.06)#294 | 11.2%(+1.12)#8,722 |
| 2. | 60502 | 10.6% | 11.3%(-0.692)#454 | 11.2%(-0.627)#12,661 |
| 3. | 60504 | 10.2% | 11.3%(-1.06)#500 | 11.2%(-0.994)#13,557 |
| 4. | 60506 | 8.6% | 11.3%(-2.65)#682 | 11.2%(-2.58)#17,810 |
| 5. | 60505 | 4.7% | 11.3%(-6.61)#1,099 | 11.2%(-6.54)#26,690 |
1
Common Questions
What are the Top 3 Zip Codes with the Highest Percentage of Population Employed in Community & Social Service in Aurora, IL?
Top 3 Zip Codes with the Highest Percentage of Population Employed in Community & Social Service in Aurora, IL are:
What zip code has the Highest Percentage of Population Employed in Community & Social Service in Aurora, IL?
60503 has the Highest Percentage of Population Employed in Community & Social Service in Aurora, IL with 12.3%.
What is the Percentage of Population Employed in Community & Social Service in Aurora, IL?
Percentage of Population Employed in Community & Social Service in Aurora is 8.3%.
What is the Percentage of Population Employed in Community & Social Service in Illinois?
Percentage of Population Employed in Community & Social Service in Illinois is 11.3%.
What is the Percentage of Population Employed in Community & Social Service in the United States?
Percentage of Population Employed in Community & Social Service in the United States is 11.2%.