South American vs Immigrants from Armenia Married-couple Households
COMPARE
South American
Immigrants from Armenia
Married-couple Households
Married-couple Households Comparison
South Americans
Immigrants from Armenia
46.6%
MARRIED-COUPLE HOUSEHOLDS
58.0/ 100
METRIC RATING
170th/ 347
METRIC RANK
44.3%
MARRIED-COUPLE HOUSEHOLDS
0.7/ 100
METRIC RATING
244th/ 347
METRIC RANK
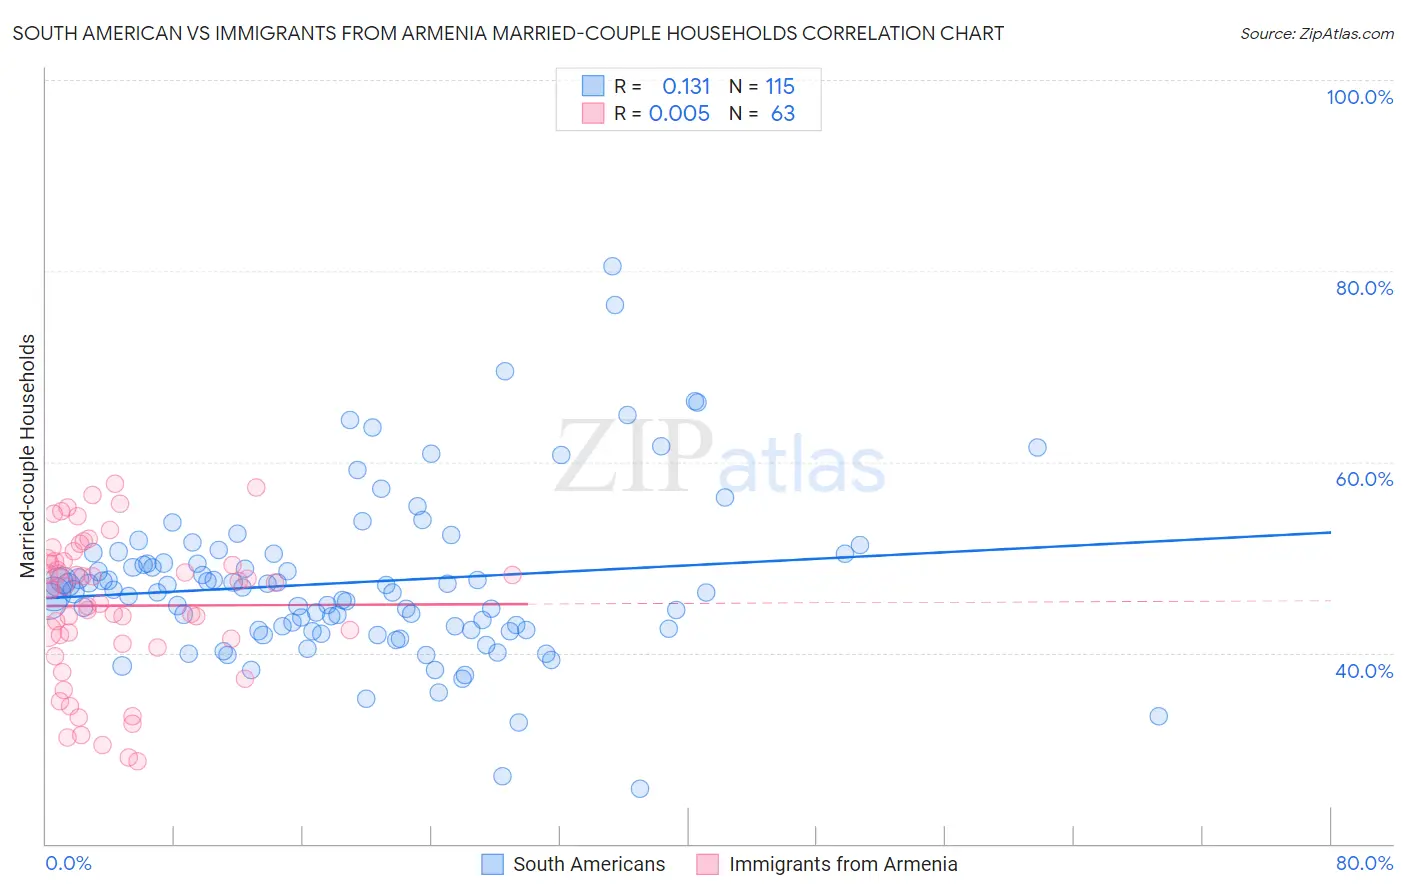
South American vs Immigrants from Armenia Married-couple Households Correlation Chart
The statistical analysis conducted on geographies consisting of 493,615,484 people shows a poor positive correlation between the proportion of South Americans and percentage of married-couple family households in the United States with a correlation coefficient (R) of 0.131 and weighted average of 46.6%. Similarly, the statistical analysis conducted on geographies consisting of 97,683,198 people shows no correlation between the proportion of Immigrants from Armenia and percentage of married-couple family households in the United States with a correlation coefficient (R) of 0.005 and weighted average of 44.3%, a difference of 5.2%.
Married-couple Households Correlation Summary
| Measurement | South American | Immigrants from Armenia |
| Minimum | 25.8% | 28.6% |
| Maximum | 80.5% | 57.7% |
| Range | 54.7% | 29.0% |
| Mean | 47.4% | 44.9% |
| Median | 46.4% | 46.7% |
| Interquartile 25% (IQ1) | 42.4% | 41.0% |
| Interquartile 75% (IQ3) | 50.4% | 49.6% |
| Interquartile Range (IQR) | 7.9% | 8.7% |
| Standard Deviation (Sample) | 8.6% | 7.5% |
| Standard Deviation (Population) | 8.6% | 7.4% |
Similar Demographics by Married-couple Households
Demographics Similar to South Americans by Married-couple Households
In terms of married-couple households, the demographic groups most similar to South Americans are Spanish American Indian (46.6%, a difference of 0.050%), Immigrants from Chile (46.5%, a difference of 0.090%), Immigrants from Australia (46.5%, a difference of 0.13%), Israeli (46.7%, a difference of 0.17%), and Immigrants from Norway (46.5%, a difference of 0.23%).
| Demographics | Rating | Rank | Married-couple Households |
| Immigrants | Turkey | 70.2 /100 | #163 | Good 46.8% |
| Immigrants | Kazakhstan | 70.0 /100 | #164 | Good 46.8% |
| Immigrants | Southern Europe | 69.9 /100 | #165 | Good 46.8% |
| Cherokee | 65.7 /100 | #166 | Good 46.7% |
| Immigrants | Croatia | 64.2 /100 | #167 | Good 46.7% |
| Israelis | 62.3 /100 | #168 | Good 46.7% |
| Spanish American Indians | 59.4 /100 | #169 | Average 46.6% |
| South Americans | 58.0 /100 | #170 | Average 46.6% |
| Immigrants | Chile | 55.7 /100 | #171 | Average 46.5% |
| Immigrants | Australia | 54.6 /100 | #172 | Average 46.5% |
| Immigrants | Norway | 52.0 /100 | #173 | Average 46.5% |
| Immigrants | Mexico | 50.0 /100 | #174 | Average 46.4% |
| Immigrants | Colombia | 46.1 /100 | #175 | Average 46.4% |
| Cajuns | 45.2 /100 | #176 | Average 46.4% |
| Immigrants | Immigrants | 43.8 /100 | #177 | Average 46.3% |
Demographics Similar to Immigrants from Armenia by Married-couple Households
In terms of married-couple households, the demographic groups most similar to Immigrants from Armenia are Immigrants from El Salvador (44.3%, a difference of 0.010%), Immigrants from Cuba (44.2%, a difference of 0.16%), Immigrants from Morocco (44.2%, a difference of 0.16%), Immigrants from Saudi Arabia (44.4%, a difference of 0.28%), and Immigrants from Albania (44.4%, a difference of 0.35%).
| Demographics | Rating | Rank | Married-couple Households |
| Comanche | 1.2 /100 | #237 | Tragic 44.5% |
| Immigrants | Uruguay | 1.1 /100 | #238 | Tragic 44.5% |
| Spanish Americans | 1.1 /100 | #239 | Tragic 44.5% |
| Ute | 1.0 /100 | #240 | Tragic 44.4% |
| Immigrants | Bosnia and Herzegovina | 1.0 /100 | #241 | Tragic 44.4% |
| Immigrants | Albania | 1.0 /100 | #242 | Tragic 44.4% |
| Immigrants | Saudi Arabia | 0.9 /100 | #243 | Tragic 44.4% |
| Immigrants | Armenia | 0.7 /100 | #244 | Tragic 44.3% |
| Immigrants | El Salvador | 0.7 /100 | #245 | Tragic 44.3% |
| Immigrants | Cuba | 0.6 /100 | #246 | Tragic 44.2% |
| Immigrants | Morocco | 0.6 /100 | #247 | Tragic 44.2% |
| Yup'ik | 0.4 /100 | #248 | Tragic 44.1% |
| Immigrants | Kenya | 0.4 /100 | #249 | Tragic 44.1% |
| French American Indians | 0.4 /100 | #250 | Tragic 44.1% |
| German Russians | 0.4 /100 | #251 | Tragic 44.0% |