South American vs Israeli Married-couple Households
COMPARE
South American
Israeli
Married-couple Households
Married-couple Households Comparison
South Americans
Israelis
46.6%
MARRIED-COUPLE HOUSEHOLDS
58.0/ 100
METRIC RATING
170th/ 347
METRIC RANK
46.7%
MARRIED-COUPLE HOUSEHOLDS
62.3/ 100
METRIC RATING
168th/ 347
METRIC RANK
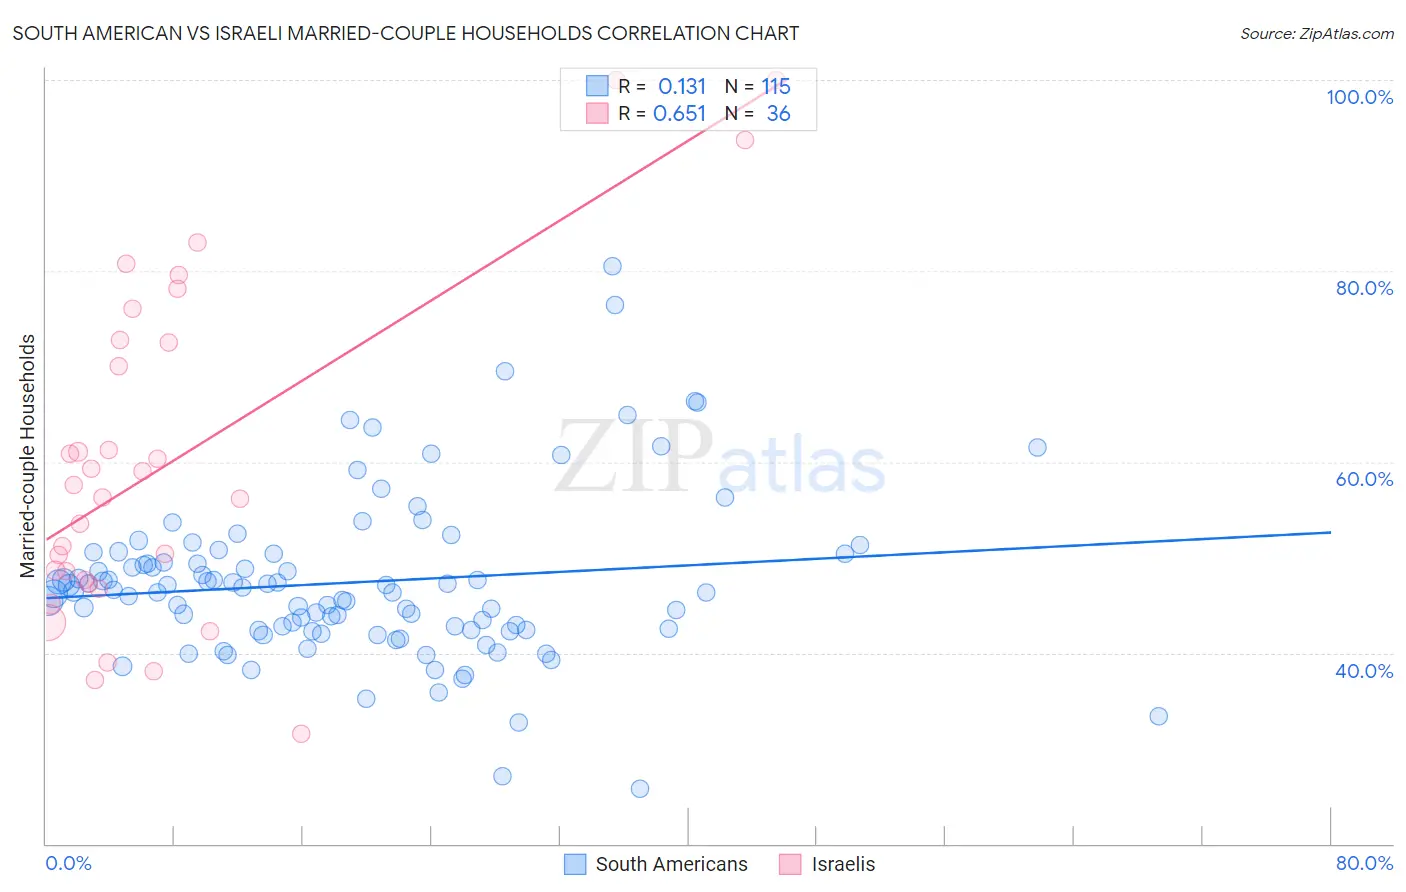
South American vs Israeli Married-couple Households Correlation Chart
The statistical analysis conducted on geographies consisting of 493,615,484 people shows a poor positive correlation between the proportion of South Americans and percentage of married-couple family households in the United States with a correlation coefficient (R) of 0.131 and weighted average of 46.6%. Similarly, the statistical analysis conducted on geographies consisting of 210,993,217 people shows a significant positive correlation between the proportion of Israelis and percentage of married-couple family households in the United States with a correlation coefficient (R) of 0.651 and weighted average of 46.7%, a difference of 0.17%.
Married-couple Households Correlation Summary
| Measurement | South American | Israeli |
| Minimum | 25.8% | 31.6% |
| Maximum | 80.5% | 100.0% |
| Range | 54.7% | 68.4% |
| Mean | 47.4% | 60.0% |
| Median | 46.4% | 57.0% |
| Interquartile 25% (IQ1) | 42.4% | 47.5% |
| Interquartile 75% (IQ3) | 50.4% | 72.7% |
| Interquartile Range (IQR) | 7.9% | 25.2% |
| Standard Deviation (Sample) | 8.6% | 17.6% |
| Standard Deviation (Population) | 8.6% | 17.4% |
Demographics Similar to South Americans and Israelis by Married-couple Households
In terms of married-couple households, the demographic groups most similar to South Americans are Spanish American Indian (46.6%, a difference of 0.050%), Immigrants from Chile (46.5%, a difference of 0.090%), Immigrants from Australia (46.5%, a difference of 0.13%), Immigrants from Norway (46.5%, a difference of 0.23%), and Immigrants from Croatia (46.7%, a difference of 0.25%). Similarly, the demographic groups most similar to Israelis are Immigrants from Croatia (46.7%, a difference of 0.080%), Spanish American Indian (46.6%, a difference of 0.11%), Cherokee (46.7%, a difference of 0.14%), Immigrants from Chile (46.5%, a difference of 0.25%), and Immigrants from Australia (46.5%, a difference of 0.30%).
| Demographics | Rating | Rank | Married-couple Households |
| Osage | 73.2 /100 | #159 | Good 46.9% |
| Iraqis | 71.7 /100 | #160 | Good 46.9% |
| Delaware | 71.2 /100 | #161 | Good 46.8% |
| Colombians | 71.0 /100 | #162 | Good 46.8% |
| Immigrants | Turkey | 70.2 /100 | #163 | Good 46.8% |
| Immigrants | Kazakhstan | 70.0 /100 | #164 | Good 46.8% |
| Immigrants | Southern Europe | 69.9 /100 | #165 | Good 46.8% |
| Cherokee | 65.7 /100 | #166 | Good 46.7% |
| Immigrants | Croatia | 64.2 /100 | #167 | Good 46.7% |
| Israelis | 62.3 /100 | #168 | Good 46.7% |
| Spanish American Indians | 59.4 /100 | #169 | Average 46.6% |
| South Americans | 58.0 /100 | #170 | Average 46.6% |
| Immigrants | Chile | 55.7 /100 | #171 | Average 46.5% |
| Immigrants | Australia | 54.6 /100 | #172 | Average 46.5% |
| Immigrants | Norway | 52.0 /100 | #173 | Average 46.5% |
| Immigrants | Mexico | 50.0 /100 | #174 | Average 46.4% |
| Immigrants | Colombia | 46.1 /100 | #175 | Average 46.4% |
| Cajuns | 45.2 /100 | #176 | Average 46.4% |
| Immigrants | Immigrants | 43.8 /100 | #177 | Average 46.3% |
| Immigrants | Costa Rica | 43.4 /100 | #178 | Average 46.3% |
| Immigrants | Zimbabwe | 43.0 /100 | #179 | Average 46.3% |