Macedonian vs Soviet Union Married-couple Households
COMPARE
Macedonian
Soviet Union
Married-couple Households
Married-couple Households Comparison
Macedonians
Soviet Union
47.6%
MARRIED-COUPLE HOUSEHOLDS
93.9/ 100
METRIC RATING
110th/ 347
METRIC RANK
44.6%
MARRIED-COUPLE HOUSEHOLDS
1.6/ 100
METRIC RATING
230th/ 347
METRIC RANK
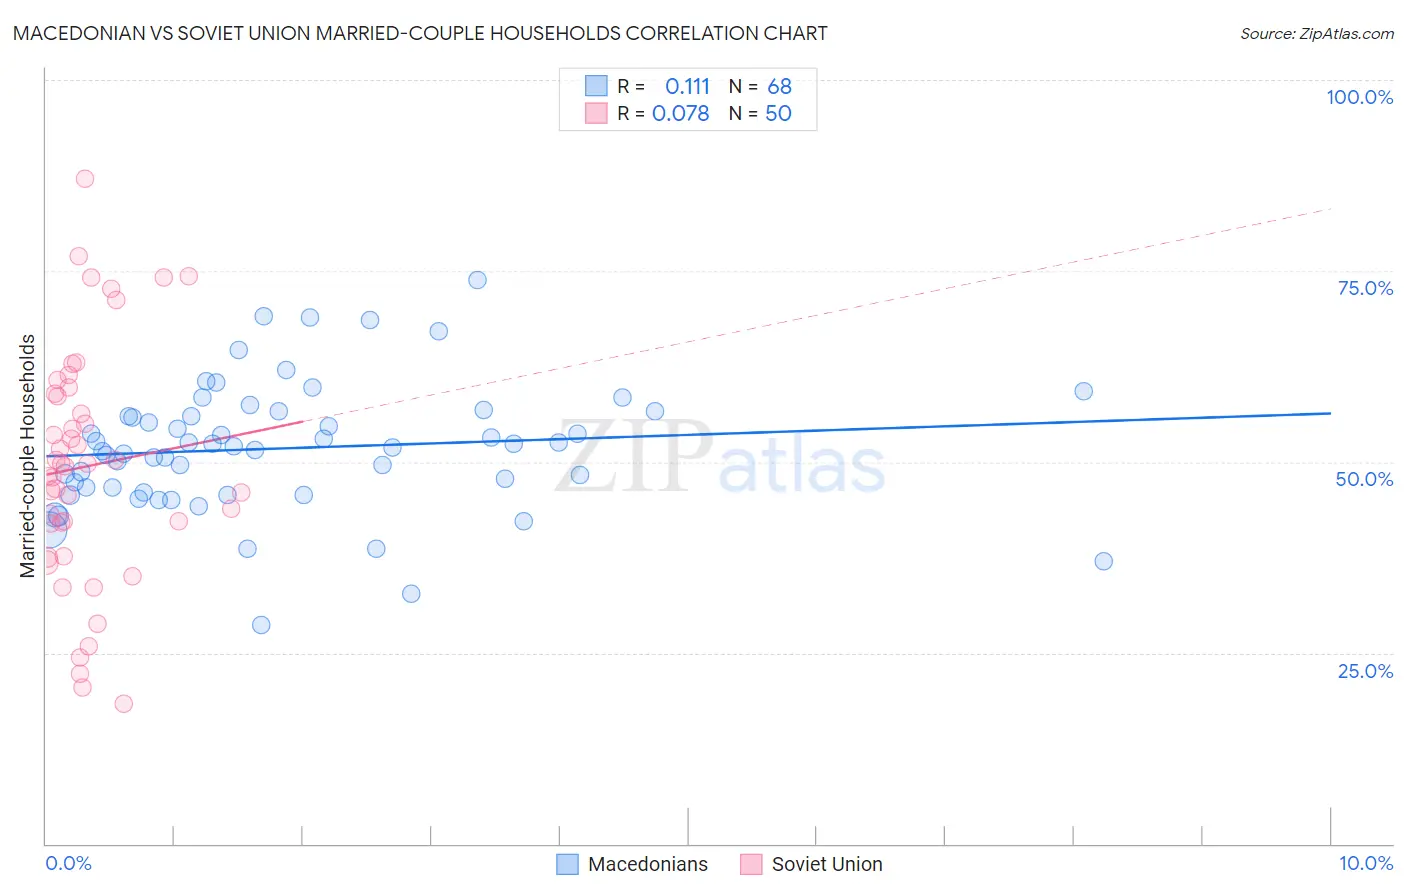
Macedonian vs Soviet Union Married-couple Households Correlation Chart
The statistical analysis conducted on geographies consisting of 132,608,945 people shows a poor positive correlation between the proportion of Macedonians and percentage of married-couple family households in the United States with a correlation coefficient (R) of 0.111 and weighted average of 47.6%. Similarly, the statistical analysis conducted on geographies consisting of 43,509,630 people shows a slight positive correlation between the proportion of Soviet Union and percentage of married-couple family households in the United States with a correlation coefficient (R) of 0.078 and weighted average of 44.6%, a difference of 6.7%.
Married-couple Households Correlation Summary
| Measurement | Macedonian | Soviet Union |
| Minimum | 28.7% | 18.4% |
| Maximum | 73.8% | 87.0% |
| Range | 45.2% | 68.6% |
| Mean | 51.8% | 49.4% |
| Median | 52.0% | 49.6% |
| Interquartile 25% (IQ1) | 46.3% | 41.9% |
| Interquartile 75% (IQ3) | 56.3% | 58.9% |
| Interquartile Range (IQR) | 10.0% | 17.0% |
| Standard Deviation (Sample) | 8.4% | 15.5% |
| Standard Deviation (Population) | 8.3% | 15.3% |
Similar Demographics by Married-couple Households
Demographics Similar to Macedonians by Married-couple Households
In terms of married-couple households, the demographic groups most similar to Macedonians are Syrian (47.6%, a difference of 0.0%), Immigrants from Jordan (47.7%, a difference of 0.020%), Peruvian (47.6%, a difference of 0.020%), Venezuelan (47.6%, a difference of 0.030%), and Immigrants from Europe (47.6%, a difference of 0.030%).
| Demographics | Rating | Rank | Married-couple Households |
| Hawaiians | 96.0 /100 | #103 | Exceptional 47.8% |
| Immigrants | South Africa | 96.0 /100 | #104 | Exceptional 47.8% |
| Immigrants | Czechoslovakia | 95.5 /100 | #105 | Exceptional 47.8% |
| Portuguese | 95.5 /100 | #106 | Exceptional 47.8% |
| Estonians | 94.7 /100 | #107 | Exceptional 47.7% |
| Immigrants | Japan | 94.4 /100 | #108 | Exceptional 47.7% |
| Immigrants | Jordan | 94.1 /100 | #109 | Exceptional 47.7% |
| Macedonians | 93.9 /100 | #110 | Exceptional 47.6% |
| Syrians | 93.9 /100 | #111 | Exceptional 47.6% |
| Peruvians | 93.8 /100 | #112 | Exceptional 47.6% |
| Venezuelans | 93.8 /100 | #113 | Exceptional 47.6% |
| Immigrants | Europe | 93.7 /100 | #114 | Exceptional 47.6% |
| Slovaks | 92.9 /100 | #115 | Exceptional 47.6% |
| Argentineans | 92.5 /100 | #116 | Exceptional 47.5% |
| French Canadians | 92.4 /100 | #117 | Exceptional 47.5% |
Demographics Similar to Soviet Union by Married-couple Households
In terms of married-couple households, the demographic groups most similar to Soviet Union are Houma (44.6%, a difference of 0.010%), Marshallese (44.6%, a difference of 0.010%), Immigrants from Latin America (44.7%, a difference of 0.040%), Immigrants from Uganda (44.6%, a difference of 0.050%), and Kenyan (44.7%, a difference of 0.090%).
| Demographics | Rating | Rank | Married-couple Households |
| Immigrants | Cambodia | 2.7 /100 | #223 | Tragic 44.9% |
| Immigrants | Micronesia | 2.6 /100 | #224 | Tragic 44.9% |
| Dutch West Indians | 2.6 /100 | #225 | Tragic 44.9% |
| Alsatians | 2.3 /100 | #226 | Tragic 44.8% |
| Salvadorans | 1.9 /100 | #227 | Tragic 44.7% |
| Kenyans | 1.7 /100 | #228 | Tragic 44.7% |
| Immigrants | Latin America | 1.6 /100 | #229 | Tragic 44.7% |
| Soviet Union | 1.6 /100 | #230 | Tragic 44.6% |
| Houma | 1.5 /100 | #231 | Tragic 44.6% |
| Marshallese | 1.5 /100 | #232 | Tragic 44.6% |
| Immigrants | Uganda | 1.5 /100 | #233 | Tragic 44.6% |
| Immigrants | Panama | 1.3 /100 | #234 | Tragic 44.6% |
| Immigrants | Nicaragua | 1.2 /100 | #235 | Tragic 44.5% |
| Yaqui | 1.2 /100 | #236 | Tragic 44.5% |
| Comanche | 1.2 /100 | #237 | Tragic 44.5% |