Immigrants from Western Africa vs Bahamian Married-couple Households
COMPARE
Immigrants from Western Africa
Bahamian
Married-couple Households
Married-couple Households Comparison
Immigrants from Western Africa
Bahamians
41.4%
MARRIED-COUPLE HOUSEHOLDS
0.0/ 100
METRIC RATING
307th/ 347
METRIC RANK
40.5%
MARRIED-COUPLE HOUSEHOLDS
0.0/ 100
METRIC RATING
319th/ 347
METRIC RANK
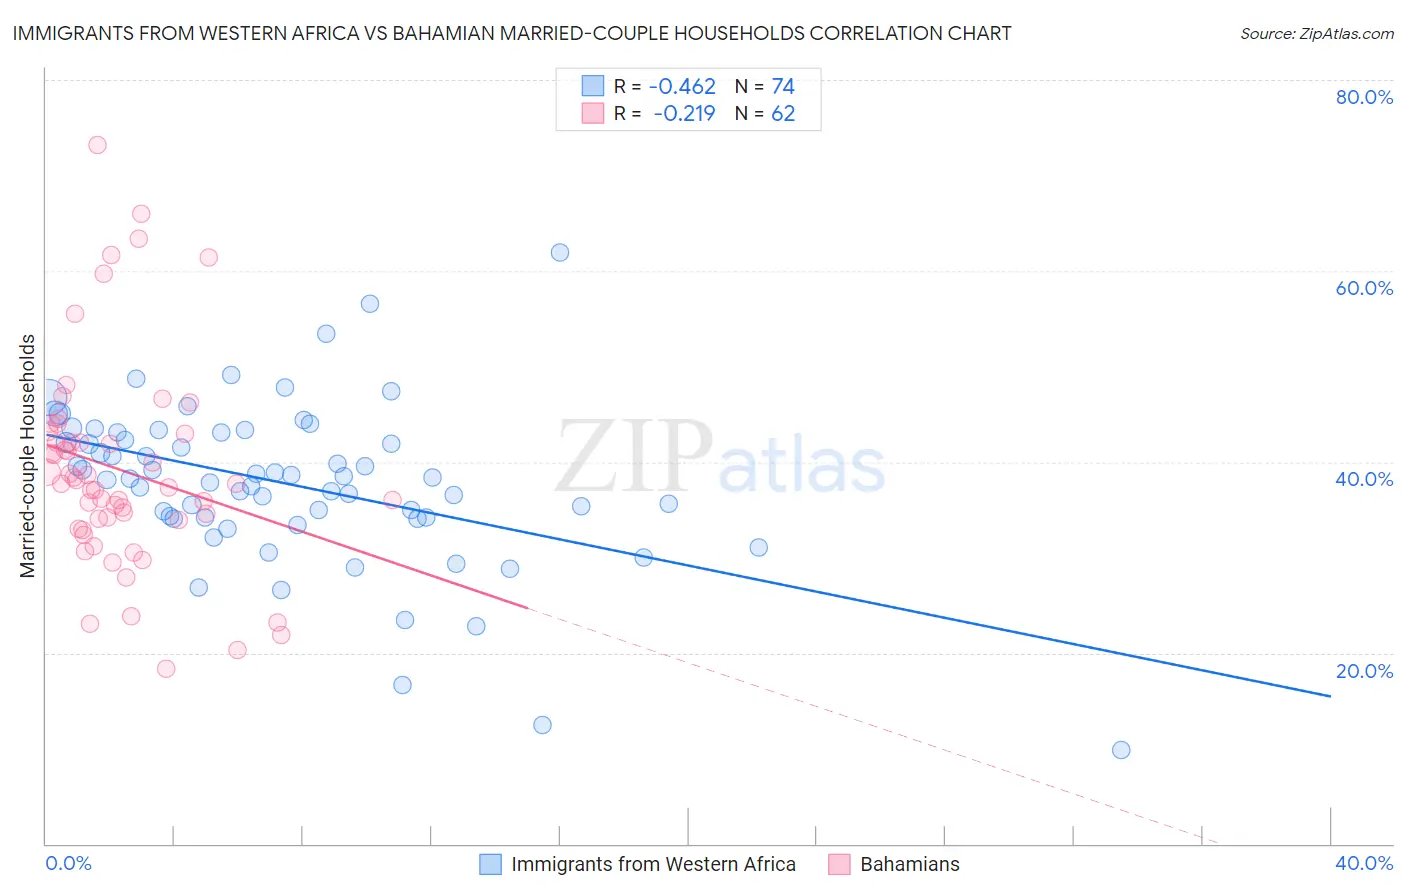
Immigrants from Western Africa vs Bahamian Married-couple Households Correlation Chart
The statistical analysis conducted on geographies consisting of 357,444,819 people shows a moderate negative correlation between the proportion of Immigrants from Western Africa and percentage of married-couple family households in the United States with a correlation coefficient (R) of -0.462 and weighted average of 41.4%. Similarly, the statistical analysis conducted on geographies consisting of 112,634,221 people shows a weak negative correlation between the proportion of Bahamians and percentage of married-couple family households in the United States with a correlation coefficient (R) of -0.219 and weighted average of 40.5%, a difference of 2.1%.
Married-couple Households Correlation Summary
| Measurement | Immigrants from Western Africa | Bahamian |
| Minimum | 9.9% | 18.4% |
| Maximum | 61.9% | 73.1% |
| Range | 52.0% | 54.8% |
| Mean | 37.7% | 39.2% |
| Median | 38.4% | 37.7% |
| Interquartile 25% (IQ1) | 34.2% | 33.9% |
| Interquartile 75% (IQ3) | 43.0% | 42.9% |
| Interquartile Range (IQR) | 8.9% | 9.0% |
| Standard Deviation (Sample) | 8.6% | 10.9% |
| Standard Deviation (Population) | 8.5% | 10.8% |
Demographics Similar to Immigrants from Western Africa and Bahamians by Married-couple Households
In terms of married-couple households, the demographic groups most similar to Immigrants from Western Africa are Guyanese (41.4%, a difference of 0.010%), Crow (41.4%, a difference of 0.010%), Immigrants from Trinidad and Tobago (41.2%, a difference of 0.36%), Sioux (41.5%, a difference of 0.38%), and Haitian (41.2%, a difference of 0.43%). Similarly, the demographic groups most similar to Bahamians are Liberian (40.7%, a difference of 0.35%), Immigrants from Jamaica (40.7%, a difference of 0.36%), West Indian (40.3%, a difference of 0.42%), Immigrants from Liberia (40.3%, a difference of 0.45%), and Immigrants from Caribbean (40.8%, a difference of 0.65%).
| Demographics | Rating | Rank | Married-couple Households |
| Sub-Saharan Africans | 0.0 /100 | #303 | Tragic 41.6% |
| Immigrants | Guyana | 0.0 /100 | #304 | Tragic 41.6% |
| Sioux | 0.0 /100 | #305 | Tragic 41.5% |
| Guyanese | 0.0 /100 | #306 | Tragic 41.4% |
| Immigrants | Western Africa | 0.0 /100 | #307 | Tragic 41.4% |
| Crow | 0.0 /100 | #308 | Tragic 41.4% |
| Immigrants | Trinidad and Tobago | 0.0 /100 | #309 | Tragic 41.2% |
| Haitians | 0.0 /100 | #310 | Tragic 41.2% |
| Colville | 0.0 /100 | #311 | Tragic 41.0% |
| Africans | 0.0 /100 | #312 | Tragic 40.9% |
| Immigrants | Haiti | 0.0 /100 | #313 | Tragic 40.9% |
| Jamaicans | 0.0 /100 | #314 | Tragic 40.9% |
| Trinidadians and Tobagonians | 0.0 /100 | #315 | Tragic 40.9% |
| Immigrants | Caribbean | 0.0 /100 | #316 | Tragic 40.8% |
| Immigrants | Jamaica | 0.0 /100 | #317 | Tragic 40.7% |
| Liberians | 0.0 /100 | #318 | Tragic 40.7% |
| Bahamians | 0.0 /100 | #319 | Tragic 40.5% |
| West Indians | 0.0 /100 | #320 | Tragic 40.3% |
| Immigrants | Liberia | 0.0 /100 | #321 | Tragic 40.3% |
| Immigrants | Zaire | 0.0 /100 | #322 | Tragic 40.1% |
| Puerto Ricans | 0.0 /100 | #323 | Tragic 40.1% |