Immigrants from Turkey vs Salvadoran Married-couple Households
COMPARE
Immigrants from Turkey
Salvadoran
Married-couple Households
Married-couple Households Comparison
Immigrants from Turkey
Salvadorans
46.8%
MARRIED-COUPLE HOUSEHOLDS
70.2/ 100
METRIC RATING
163rd/ 347
METRIC RANK
44.7%
MARRIED-COUPLE HOUSEHOLDS
1.9/ 100
METRIC RATING
227th/ 347
METRIC RANK
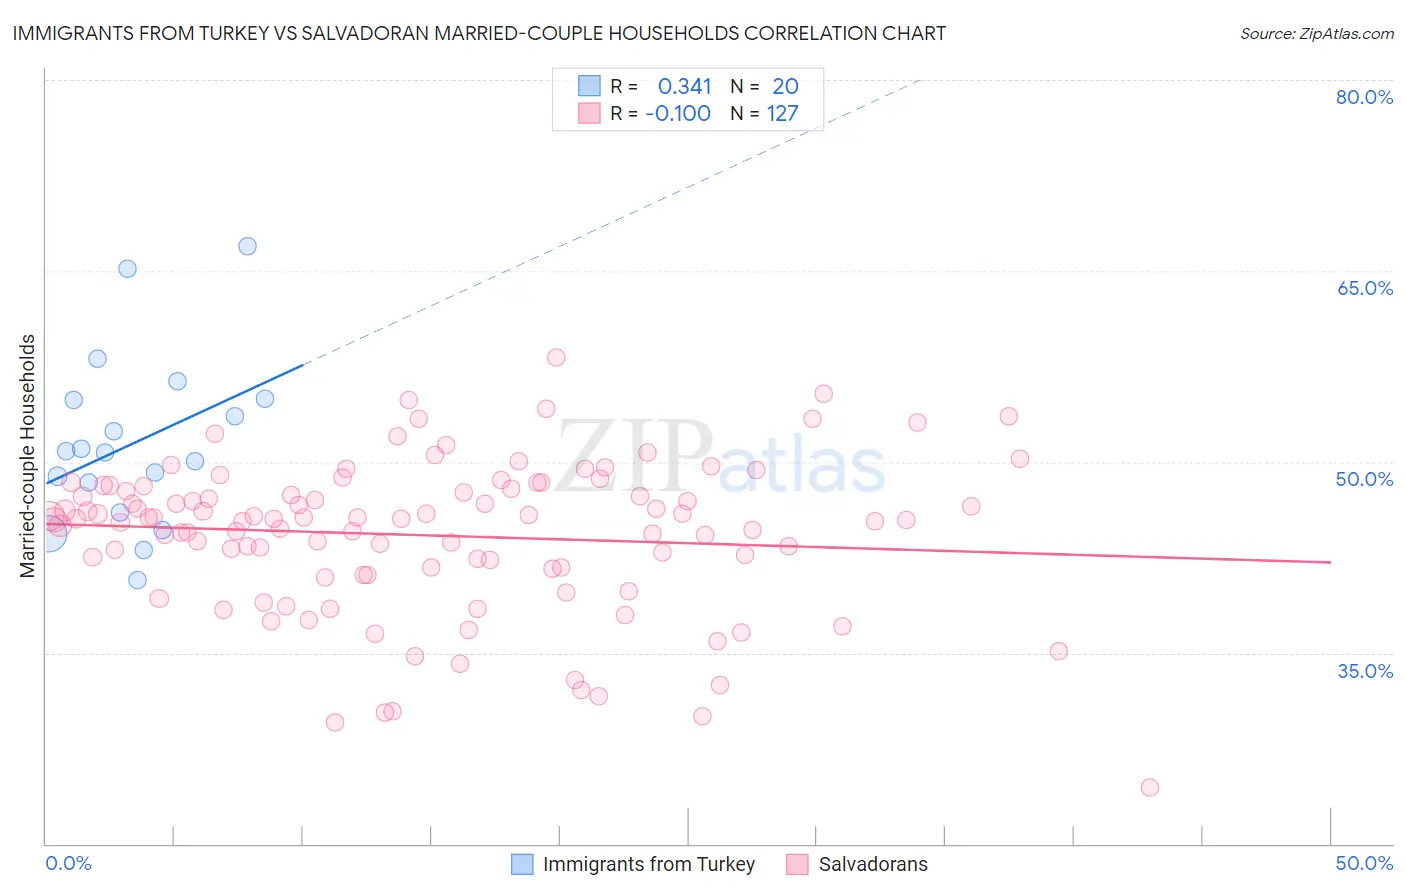
Immigrants from Turkey vs Salvadoran Married-couple Households Correlation Chart
The statistical analysis conducted on geographies consisting of 222,970,695 people shows a mild positive correlation between the proportion of Immigrants from Turkey and percentage of married-couple family households in the United States with a correlation coefficient (R) of 0.341 and weighted average of 46.8%. Similarly, the statistical analysis conducted on geographies consisting of 398,667,012 people shows a poor negative correlation between the proportion of Salvadorans and percentage of married-couple family households in the United States with a correlation coefficient (R) of -0.100 and weighted average of 44.7%, a difference of 4.7%.
Married-couple Households Correlation Summary
| Measurement | Immigrants from Turkey | Salvadoran |
| Minimum | 40.7% | 24.4% |
| Maximum | 67.0% | 58.2% |
| Range | 26.2% | 33.9% |
| Mean | 51.5% | 44.2% |
| Median | 50.8% | 45.5% |
| Interquartile 25% (IQ1) | 47.2% | 41.6% |
| Interquartile 75% (IQ3) | 54.9% | 47.9% |
| Interquartile Range (IQR) | 7.7% | 6.3% |
| Standard Deviation (Sample) | 6.7% | 6.0% |
| Standard Deviation (Population) | 6.6% | 5.9% |
Similar Demographics by Married-couple Households
Demographics Similar to Immigrants from Turkey by Married-couple Households
In terms of married-couple households, the demographic groups most similar to Immigrants from Turkey are Immigrants from Kazakhstan (46.8%, a difference of 0.010%), Immigrants from Southern Europe (46.8%, a difference of 0.010%), Delaware (46.8%, a difference of 0.040%), Colombian (46.8%, a difference of 0.040%), and Iraqi (46.9%, a difference of 0.070%).
| Demographics | Rating | Rank | Married-couple Households |
| Armenians | 75.4 /100 | #156 | Good 46.9% |
| Immigrants | Oceania | 74.8 /100 | #157 | Good 46.9% |
| Immigrants | Nonimmigrants | 73.3 /100 | #158 | Good 46.9% |
| Osage | 73.2 /100 | #159 | Good 46.9% |
| Iraqis | 71.7 /100 | #160 | Good 46.9% |
| Delaware | 71.2 /100 | #161 | Good 46.8% |
| Colombians | 71.0 /100 | #162 | Good 46.8% |
| Immigrants | Turkey | 70.2 /100 | #163 | Good 46.8% |
| Immigrants | Kazakhstan | 70.0 /100 | #164 | Good 46.8% |
| Immigrants | Southern Europe | 69.9 /100 | #165 | Good 46.8% |
| Cherokee | 65.7 /100 | #166 | Good 46.7% |
| Immigrants | Croatia | 64.2 /100 | #167 | Good 46.7% |
| Israelis | 62.3 /100 | #168 | Good 46.7% |
| Spanish American Indians | 59.4 /100 | #169 | Average 46.6% |
| South Americans | 58.0 /100 | #170 | Average 46.6% |
Demographics Similar to Salvadorans by Married-couple Households
In terms of married-couple households, the demographic groups most similar to Salvadorans are Kenyan (44.7%, a difference of 0.13%), Immigrants from Latin America (44.7%, a difference of 0.18%), Alsatian (44.8%, a difference of 0.19%), Soviet Union (44.6%, a difference of 0.22%), and Houma (44.6%, a difference of 0.22%).
| Demographics | Rating | Rank | Married-couple Households |
| Immigrants | Thailand | 5.1 /100 | #220 | Tragic 45.2% |
| Tlingit-Haida | 4.9 /100 | #221 | Tragic 45.1% |
| Immigrants | Laos | 4.6 /100 | #222 | Tragic 45.1% |
| Immigrants | Cambodia | 2.7 /100 | #223 | Tragic 44.9% |
| Immigrants | Micronesia | 2.6 /100 | #224 | Tragic 44.9% |
| Dutch West Indians | 2.6 /100 | #225 | Tragic 44.9% |
| Alsatians | 2.3 /100 | #226 | Tragic 44.8% |
| Salvadorans | 1.9 /100 | #227 | Tragic 44.7% |
| Kenyans | 1.7 /100 | #228 | Tragic 44.7% |
| Immigrants | Latin America | 1.6 /100 | #229 | Tragic 44.7% |
| Soviet Union | 1.6 /100 | #230 | Tragic 44.6% |
| Houma | 1.5 /100 | #231 | Tragic 44.6% |
| Marshallese | 1.5 /100 | #232 | Tragic 44.6% |
| Immigrants | Uganda | 1.5 /100 | #233 | Tragic 44.6% |
| Immigrants | Panama | 1.3 /100 | #234 | Tragic 44.6% |