Croatian vs Immigrants from Jamaica Married-couple Households
COMPARE
Croatian
Immigrants from Jamaica
Married-couple Households
Married-couple Households Comparison
Croatians
Immigrants from Jamaica
48.5%
MARRIED-COUPLE HOUSEHOLDS
99.1/ 100
METRIC RATING
60th/ 347
METRIC RANK
40.7%
MARRIED-COUPLE HOUSEHOLDS
0.0/ 100
METRIC RATING
317th/ 347
METRIC RANK
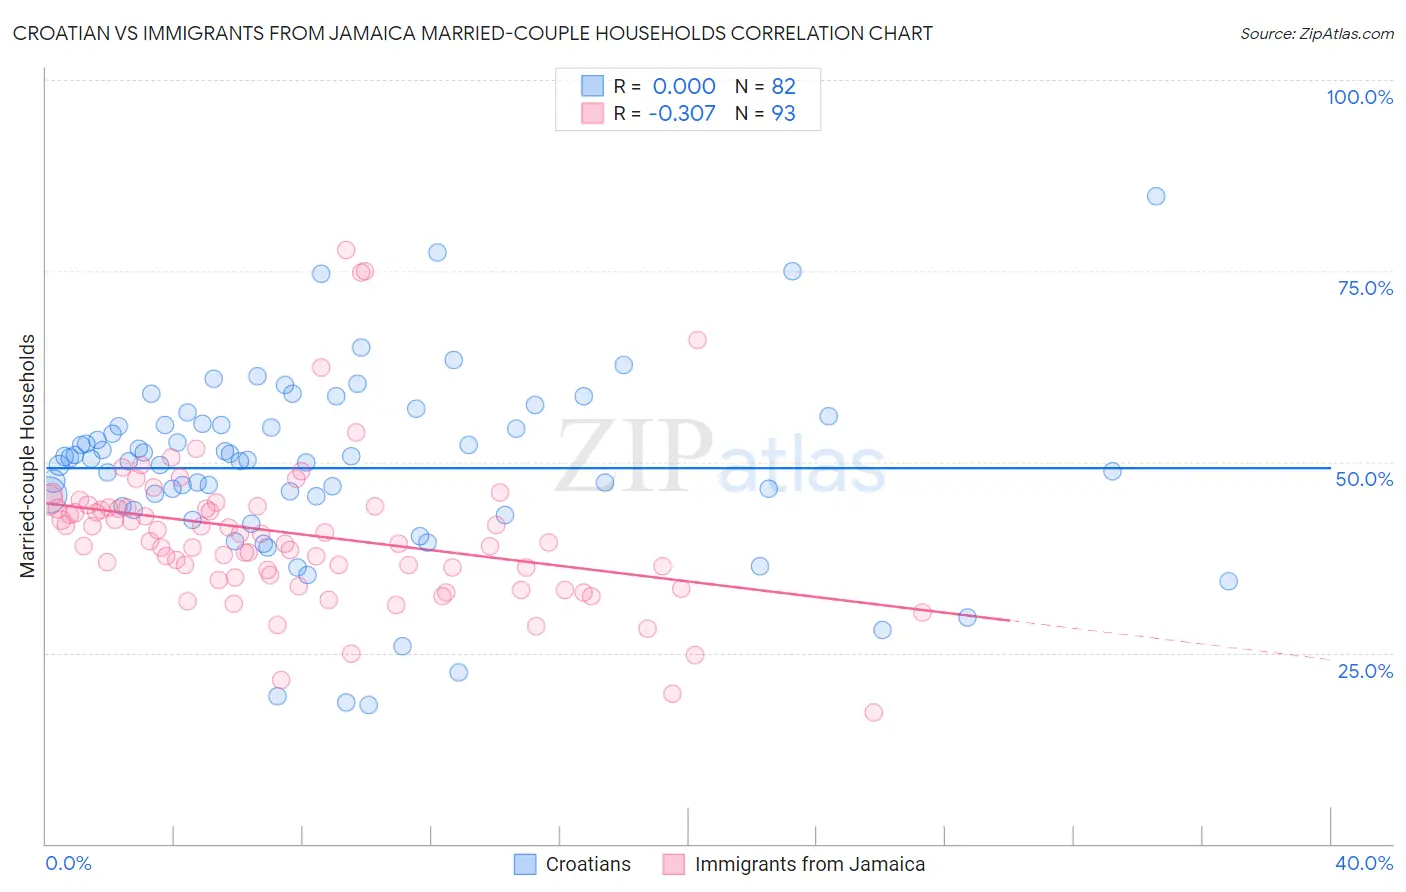
Croatian vs Immigrants from Jamaica Married-couple Households Correlation Chart
The statistical analysis conducted on geographies consisting of 375,518,925 people shows no correlation between the proportion of Croatians and percentage of married-couple family households in the United States with a correlation coefficient (R) of 0.000 and weighted average of 48.5%. Similarly, the statistical analysis conducted on geographies consisting of 301,578,290 people shows a mild negative correlation between the proportion of Immigrants from Jamaica and percentage of married-couple family households in the United States with a correlation coefficient (R) of -0.307 and weighted average of 40.7%, a difference of 19.3%.
Married-couple Households Correlation Summary
| Measurement | Croatian | Immigrants from Jamaica |
| Minimum | 18.1% | 17.2% |
| Maximum | 84.8% | 77.7% |
| Range | 66.7% | 60.5% |
| Mean | 49.2% | 40.6% |
| Median | 50.4% | 39.5% |
| Interquartile 25% (IQ1) | 44.2% | 35.0% |
| Interquartile 75% (IQ3) | 54.8% | 44.1% |
| Interquartile Range (IQR) | 10.6% | 9.1% |
| Standard Deviation (Sample) | 12.1% | 10.1% |
| Standard Deviation (Population) | 12.0% | 10.1% |
Similar Demographics by Married-couple Households
Demographics Similar to Croatians by Married-couple Households
In terms of married-couple households, the demographic groups most similar to Croatians are Bulgarian (48.5%, a difference of 0.050%), Luxembourger (48.5%, a difference of 0.060%), Polish (48.5%, a difference of 0.080%), Immigrants from Indonesia (48.5%, a difference of 0.080%), and Czechoslovakian (48.5%, a difference of 0.080%).
| Demographics | Rating | Rank | Married-couple Households |
| Whites/Caucasians | 99.3 /100 | #53 | Exceptional 48.6% |
| Immigrants | Lithuania | 99.3 /100 | #54 | Exceptional 48.6% |
| Austrians | 99.3 /100 | #55 | Exceptional 48.6% |
| Immigrants | Northern Europe | 99.3 /100 | #56 | Exceptional 48.6% |
| Poles | 99.2 /100 | #57 | Exceptional 48.5% |
| Immigrants | Indonesia | 99.2 /100 | #58 | Exceptional 48.5% |
| Czechoslovakians | 99.2 /100 | #59 | Exceptional 48.5% |
| Croatians | 99.1 /100 | #60 | Exceptional 48.5% |
| Bulgarians | 99.1 /100 | #61 | Exceptional 48.5% |
| Luxembourgers | 99.1 /100 | #62 | Exceptional 48.5% |
| Basques | 99.0 /100 | #63 | Exceptional 48.4% |
| Northern Europeans | 99.0 /100 | #64 | Exceptional 48.4% |
| Immigrants | Canada | 99.0 /100 | #65 | Exceptional 48.4% |
| Jordanians | 98.9 /100 | #66 | Exceptional 48.4% |
| Romanians | 98.9 /100 | #67 | Exceptional 48.4% |
Demographics Similar to Immigrants from Jamaica by Married-couple Households
In terms of married-couple households, the demographic groups most similar to Immigrants from Jamaica are Liberian (40.7%, a difference of 0.010%), Immigrants from Caribbean (40.8%, a difference of 0.29%), Bahamian (40.5%, a difference of 0.36%), Trinidadian and Tobagonian (40.9%, a difference of 0.47%), and Jamaican (40.9%, a difference of 0.55%).
| Demographics | Rating | Rank | Married-couple Households |
| Haitians | 0.0 /100 | #310 | Tragic 41.2% |
| Colville | 0.0 /100 | #311 | Tragic 41.0% |
| Africans | 0.0 /100 | #312 | Tragic 40.9% |
| Immigrants | Haiti | 0.0 /100 | #313 | Tragic 40.9% |
| Jamaicans | 0.0 /100 | #314 | Tragic 40.9% |
| Trinidadians and Tobagonians | 0.0 /100 | #315 | Tragic 40.9% |
| Immigrants | Caribbean | 0.0 /100 | #316 | Tragic 40.8% |
| Immigrants | Jamaica | 0.0 /100 | #317 | Tragic 40.7% |
| Liberians | 0.0 /100 | #318 | Tragic 40.7% |
| Bahamians | 0.0 /100 | #319 | Tragic 40.5% |
| West Indians | 0.0 /100 | #320 | Tragic 40.3% |
| Immigrants | Liberia | 0.0 /100 | #321 | Tragic 40.3% |
| Immigrants | Zaire | 0.0 /100 | #322 | Tragic 40.1% |
| Puerto Ricans | 0.0 /100 | #323 | Tragic 40.1% |
| Navajo | 0.0 /100 | #324 | Tragic 40.1% |