Croatian vs Cuban Married-couple Households
COMPARE
Croatian
Cuban
Married-couple Households
Married-couple Households Comparison
Croatians
Cubans
48.5%
MARRIED-COUPLE HOUSEHOLDS
99.1/ 100
METRIC RATING
60th/ 347
METRIC RANK
45.4%
MARRIED-COUPLE HOUSEHOLDS
7.7/ 100
METRIC RATING
210th/ 347
METRIC RANK
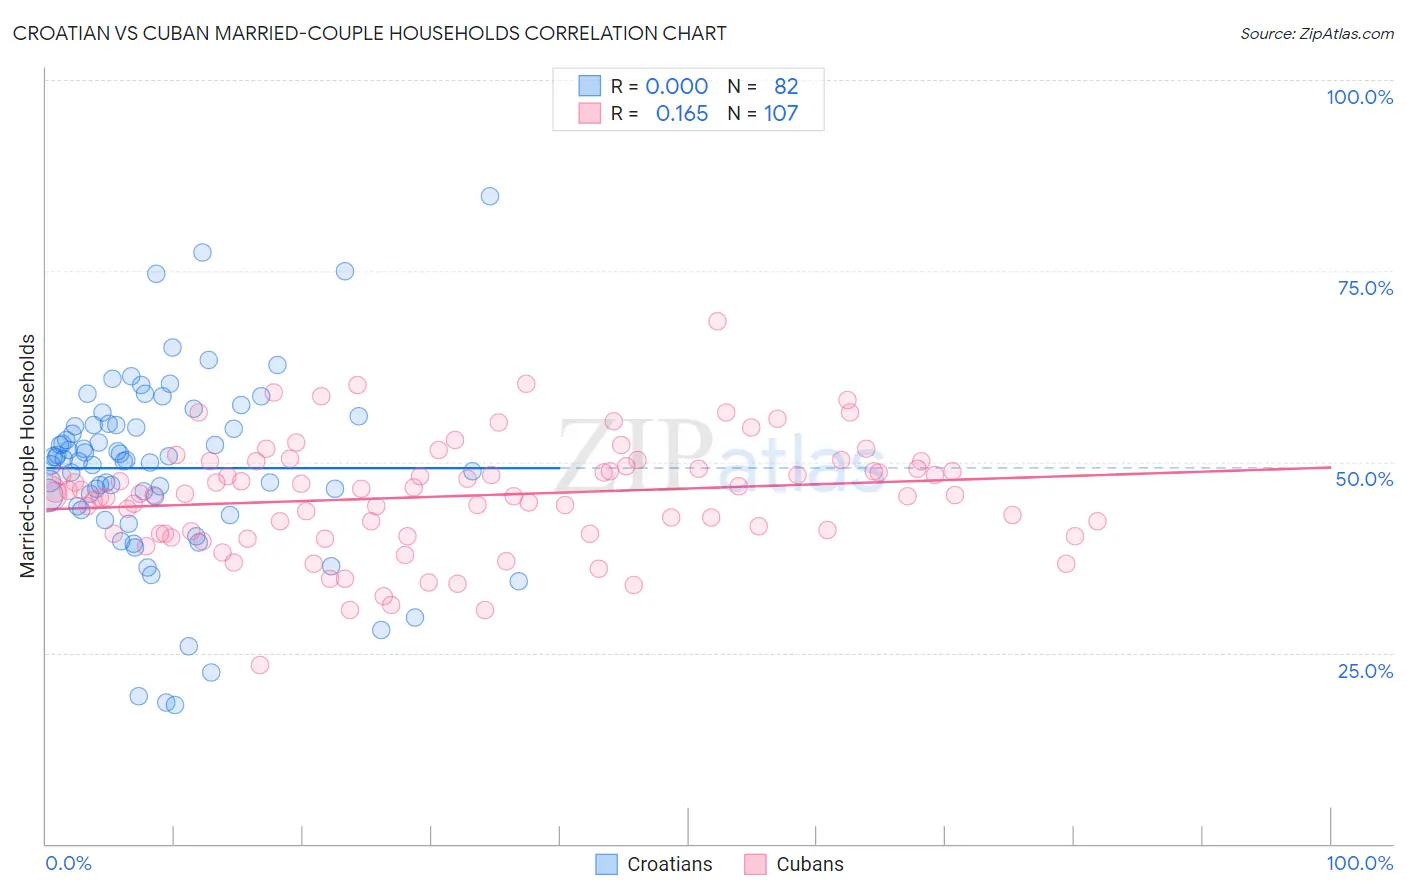
Croatian vs Cuban Married-couple Households Correlation Chart
The statistical analysis conducted on geographies consisting of 375,518,925 people shows no correlation between the proportion of Croatians and percentage of married-couple family households in the United States with a correlation coefficient (R) of 0.000 and weighted average of 48.5%. Similarly, the statistical analysis conducted on geographies consisting of 448,946,522 people shows a poor positive correlation between the proportion of Cubans and percentage of married-couple family households in the United States with a correlation coefficient (R) of 0.165 and weighted average of 45.4%, a difference of 6.9%.
Married-couple Households Correlation Summary
| Measurement | Croatian | Cuban |
| Minimum | 18.1% | 23.5% |
| Maximum | 84.8% | 68.4% |
| Range | 66.7% | 45.0% |
| Mean | 49.2% | 45.5% |
| Median | 50.4% | 45.8% |
| Interquartile 25% (IQ1) | 44.2% | 40.6% |
| Interquartile 75% (IQ3) | 54.8% | 49.4% |
| Interquartile Range (IQR) | 10.6% | 8.8% |
| Standard Deviation (Sample) | 12.1% | 7.3% |
| Standard Deviation (Population) | 12.0% | 7.3% |
Similar Demographics by Married-couple Households
Demographics Similar to Croatians by Married-couple Households
In terms of married-couple households, the demographic groups most similar to Croatians are Bulgarian (48.5%, a difference of 0.050%), Luxembourger (48.5%, a difference of 0.060%), Polish (48.5%, a difference of 0.080%), Immigrants from Indonesia (48.5%, a difference of 0.080%), and Czechoslovakian (48.5%, a difference of 0.080%).
| Demographics | Rating | Rank | Married-couple Households |
| Whites/Caucasians | 99.3 /100 | #53 | Exceptional 48.6% |
| Immigrants | Lithuania | 99.3 /100 | #54 | Exceptional 48.6% |
| Austrians | 99.3 /100 | #55 | Exceptional 48.6% |
| Immigrants | Northern Europe | 99.3 /100 | #56 | Exceptional 48.6% |
| Poles | 99.2 /100 | #57 | Exceptional 48.5% |
| Immigrants | Indonesia | 99.2 /100 | #58 | Exceptional 48.5% |
| Czechoslovakians | 99.2 /100 | #59 | Exceptional 48.5% |
| Croatians | 99.1 /100 | #60 | Exceptional 48.5% |
| Bulgarians | 99.1 /100 | #61 | Exceptional 48.5% |
| Luxembourgers | 99.1 /100 | #62 | Exceptional 48.5% |
| Basques | 99.0 /100 | #63 | Exceptional 48.4% |
| Northern Europeans | 99.0 /100 | #64 | Exceptional 48.4% |
| Immigrants | Canada | 99.0 /100 | #65 | Exceptional 48.4% |
| Jordanians | 98.9 /100 | #66 | Exceptional 48.4% |
| Romanians | 98.9 /100 | #67 | Exceptional 48.4% |
Demographics Similar to Cubans by Married-couple Households
In terms of married-couple households, the demographic groups most similar to Cubans are Immigrants from Spain (45.3%, a difference of 0.050%), Immigrants from Uzbekistan (45.4%, a difference of 0.090%), Hispanic or Latino (45.4%, a difference of 0.13%), Immigrants from France (45.4%, a difference of 0.14%), and Creek (45.3%, a difference of 0.18%).
| Demographics | Rating | Rank | Married-couple Households |
| Alaska Natives | 13.0 /100 | #203 | Poor 45.6% |
| Aleuts | 12.5 /100 | #204 | Poor 45.6% |
| Nepalese | 11.9 /100 | #205 | Poor 45.6% |
| Uruguayans | 10.4 /100 | #206 | Poor 45.5% |
| Immigrants | France | 8.8 /100 | #207 | Tragic 45.4% |
| Hispanics or Latinos | 8.7 /100 | #208 | Tragic 45.4% |
| Immigrants | Uzbekistan | 8.4 /100 | #209 | Tragic 45.4% |
| Cubans | 7.7 /100 | #210 | Tragic 45.4% |
| Immigrants | Spain | 7.3 /100 | #211 | Tragic 45.3% |
| Creek | 6.4 /100 | #212 | Tragic 45.3% |
| Yakama | 5.8 /100 | #213 | Tragic 45.2% |
| Japanese | 5.7 /100 | #214 | Tragic 45.2% |
| Immigrants | Nepal | 5.6 /100 | #215 | Tragic 45.2% |
| Immigrants | Portugal | 5.6 /100 | #216 | Tragic 45.2% |
| Panamanians | 5.5 /100 | #217 | Tragic 45.2% |