Osage vs Immigrants from Cuba GED/Equivalency
COMPARE
Osage
Immigrants from Cuba
GED/Equivalency
GED/Equivalency Comparison
Osage
Immigrants from Cuba
84.8%
GED/EQUIVALENCY
9.5/ 100
METRIC RATING
214th/ 347
METRIC RANK
80.2%
GED/EQUIVALENCY
0.0/ 100
METRIC RATING
320th/ 347
METRIC RANK
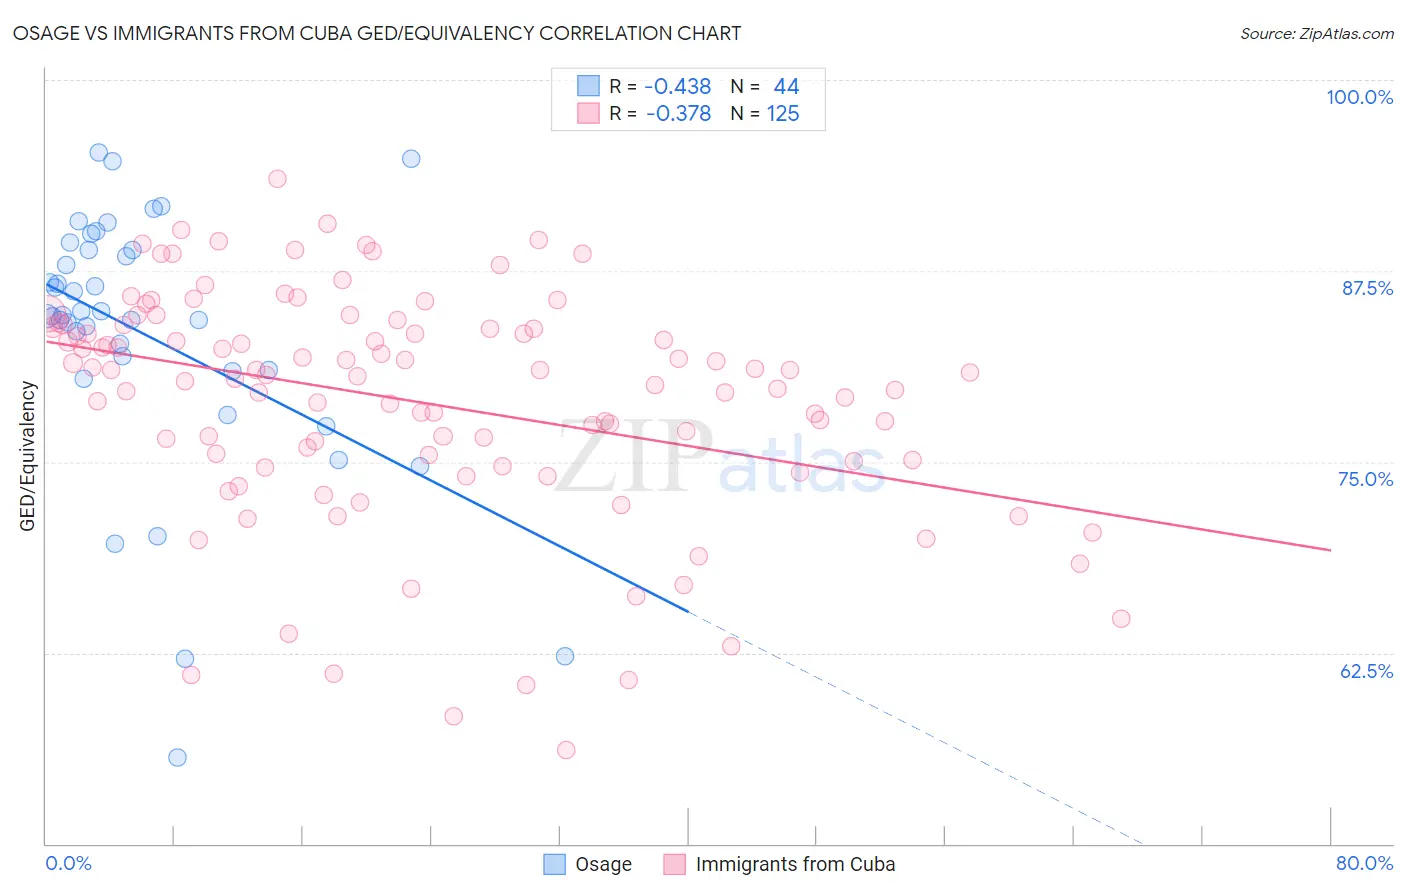
Osage vs Immigrants from Cuba GED/Equivalency Correlation Chart
The statistical analysis conducted on geographies consisting of 91,808,913 people shows a moderate negative correlation between the proportion of Osage and percentage of population with at least ged/equivalency education in the United States with a correlation coefficient (R) of -0.438 and weighted average of 84.8%. Similarly, the statistical analysis conducted on geographies consisting of 326,030,400 people shows a mild negative correlation between the proportion of Immigrants from Cuba and percentage of population with at least ged/equivalency education in the United States with a correlation coefficient (R) of -0.378 and weighted average of 80.2%, a difference of 5.7%.
GED/Equivalency Correlation Summary
| Measurement | Osage | Immigrants from Cuba |
| Minimum | 55.6% | 56.2% |
| Maximum | 95.3% | 93.5% |
| Range | 39.6% | 37.3% |
| Mean | 83.3% | 79.0% |
| Median | 84.6% | 80.7% |
| Interquartile 25% (IQ1) | 81.0% | 75.1% |
| Interquartile 75% (IQ3) | 88.9% | 83.9% |
| Interquartile Range (IQR) | 7.9% | 8.8% |
| Standard Deviation (Sample) | 8.6% | 7.5% |
| Standard Deviation (Population) | 8.5% | 7.5% |
Similar Demographics by GED/Equivalency
Demographics Similar to Osage by GED/Equivalency
In terms of ged/equivalency, the demographic groups most similar to Osage are Peruvian (84.7%, a difference of 0.020%), Immigrants from Philippines (84.8%, a difference of 0.030%), Immigrants from Micronesia (84.7%, a difference of 0.050%), Nigerian (84.7%, a difference of 0.050%), and Immigrants from Somalia (84.8%, a difference of 0.060%).
| Demographics | Rating | Rank | GED/Equivalency |
| Hmong | 13.1 /100 | #207 | Poor 84.9% |
| Marshallese | 12.5 /100 | #208 | Poor 84.9% |
| Colombians | 12.3 /100 | #209 | Poor 84.9% |
| Immigrants | Cameroon | 12.1 /100 | #210 | Poor 84.9% |
| South Americans | 10.9 /100 | #211 | Poor 84.8% |
| Immigrants | Somalia | 10.6 /100 | #212 | Poor 84.8% |
| Immigrants | Philippines | 10.0 /100 | #213 | Poor 84.8% |
| Osage | 9.5 /100 | #214 | Tragic 84.8% |
| Peruvians | 9.2 /100 | #215 | Tragic 84.7% |
| Immigrants | Micronesia | 8.7 /100 | #216 | Tragic 84.7% |
| Nigerians | 8.6 /100 | #217 | Tragic 84.7% |
| Alaska Natives | 8.6 /100 | #218 | Tragic 84.7% |
| Potawatomi | 8.2 /100 | #219 | Tragic 84.7% |
| Americans | 8.2 /100 | #220 | Tragic 84.7% |
| Taiwanese | 8.1 /100 | #221 | Tragic 84.7% |
Demographics Similar to Immigrants from Cuba by GED/Equivalency
In terms of ged/equivalency, the demographic groups most similar to Immigrants from Cuba are Yup'ik (80.0%, a difference of 0.17%), Lumbee (80.0%, a difference of 0.24%), Immigrants from Nicaragua (79.9%, a difference of 0.36%), Yaqui (80.5%, a difference of 0.41%), and Immigrants from Belize (80.5%, a difference of 0.41%).
| Demographics | Rating | Rank | GED/Equivalency |
| Cape Verdeans | 0.0 /100 | #313 | Tragic 80.9% |
| Belizeans | 0.0 /100 | #314 | Tragic 80.9% |
| Apache | 0.0 /100 | #315 | Tragic 80.7% |
| Central American Indians | 0.0 /100 | #316 | Tragic 80.6% |
| Immigrants | Caribbean | 0.0 /100 | #317 | Tragic 80.5% |
| Yaqui | 0.0 /100 | #318 | Tragic 80.5% |
| Immigrants | Belize | 0.0 /100 | #319 | Tragic 80.5% |
| Immigrants | Cuba | 0.0 /100 | #320 | Tragic 80.2% |
| Yup'ik | 0.0 /100 | #321 | Tragic 80.0% |
| Lumbee | 0.0 /100 | #322 | Tragic 80.0% |
| Immigrants | Nicaragua | 0.0 /100 | #323 | Tragic 79.9% |
| Mexican American Indians | 0.0 /100 | #324 | Tragic 79.4% |
| Hondurans | 0.0 /100 | #325 | Tragic 79.3% |
| Yuman | 0.0 /100 | #326 | Tragic 79.2% |
| Central Americans | 0.0 /100 | #327 | Tragic 79.2% |