Immigrants from Kenya vs Turkish GED/Equivalency
COMPARE
Immigrants from Kenya
Turkish
GED/Equivalency
GED/Equivalency Comparison
Immigrants from Kenya
Turks
86.2%
GED/EQUIVALENCY
71.8/ 100
METRIC RATING
159th/ 347
METRIC RANK
88.5%
GED/EQUIVALENCY
99.8/ 100
METRIC RATING
30th/ 347
METRIC RANK
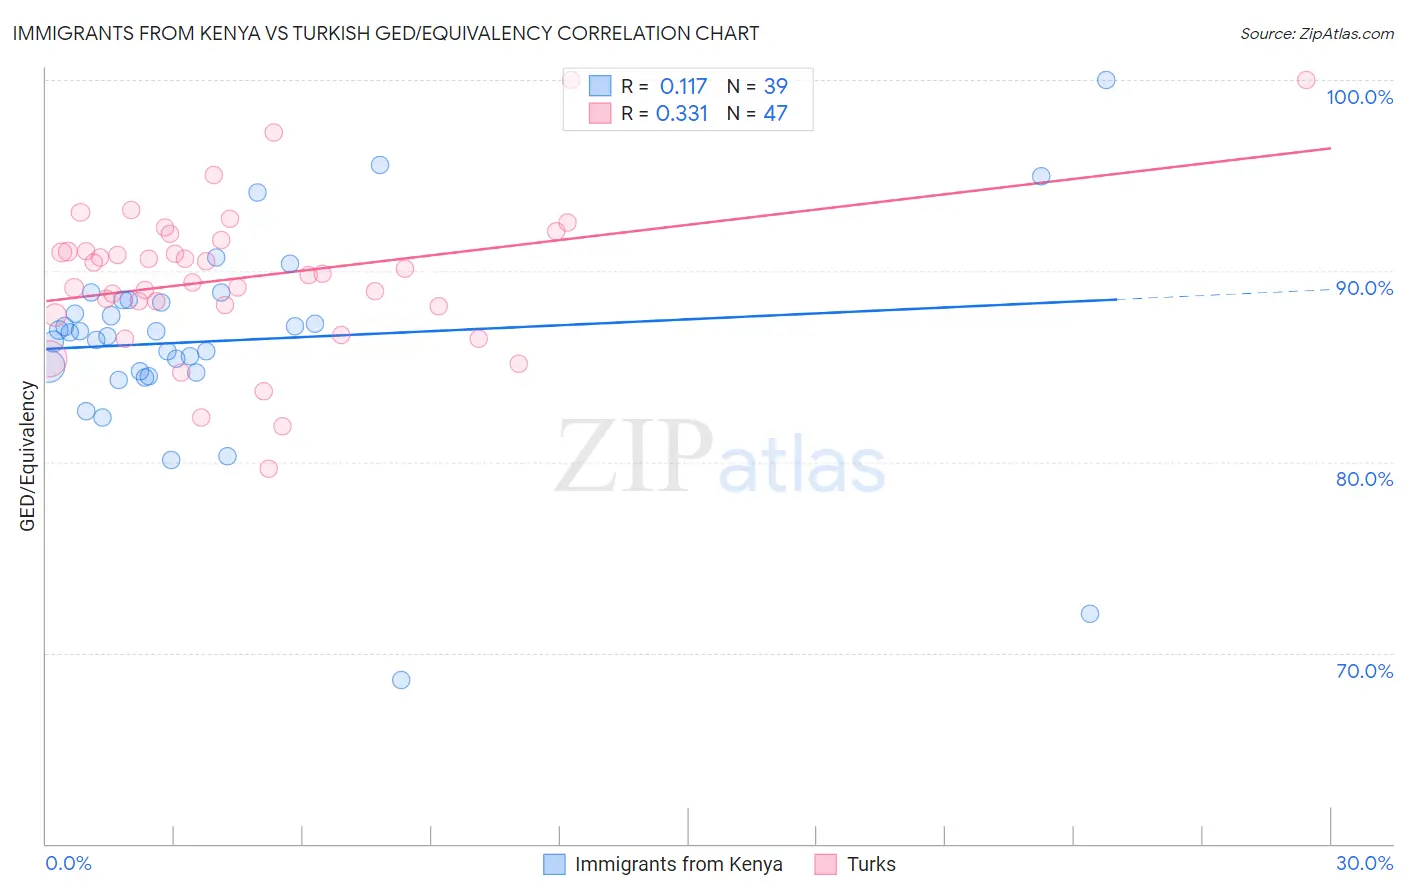
Immigrants from Kenya vs Turkish GED/Equivalency Correlation Chart
The statistical analysis conducted on geographies consisting of 218,076,690 people shows a poor positive correlation between the proportion of Immigrants from Kenya and percentage of population with at least ged/equivalency education in the United States with a correlation coefficient (R) of 0.117 and weighted average of 86.2%. Similarly, the statistical analysis conducted on geographies consisting of 271,864,133 people shows a mild positive correlation between the proportion of Turks and percentage of population with at least ged/equivalency education in the United States with a correlation coefficient (R) of 0.331 and weighted average of 88.5%, a difference of 2.7%.
GED/Equivalency Correlation Summary
| Measurement | Immigrants from Kenya | Turkish |
| Minimum | 68.6% | 79.7% |
| Maximum | 100.0% | 100.0% |
| Range | 31.4% | 20.3% |
| Mean | 86.4% | 89.7% |
| Median | 86.8% | 89.9% |
| Interquartile 25% (IQ1) | 84.7% | 88.1% |
| Interquartile 75% (IQ3) | 88.5% | 91.7% |
| Interquartile Range (IQR) | 3.8% | 3.5% |
| Standard Deviation (Sample) | 5.4% | 4.0% |
| Standard Deviation (Population) | 5.4% | 4.0% |
Similar Demographics by GED/Equivalency
Demographics Similar to Immigrants from Kenya by GED/Equivalency
In terms of ged/equivalency, the demographic groups most similar to Immigrants from Kenya are White/Caucasian (86.2%, a difference of 0.010%), German Russian (86.2%, a difference of 0.010%), Immigrants from Nepal (86.2%, a difference of 0.040%), Immigrants from Morocco (86.1%, a difference of 0.060%), and Immigrants from Syria (86.1%, a difference of 0.060%).
| Demographics | Rating | Rank | GED/Equivalency |
| Brazilians | 77.2 /100 | #152 | Good 86.3% |
| Kenyans | 76.6 /100 | #153 | Good 86.3% |
| Armenians | 76.4 /100 | #154 | Good 86.3% |
| Iraqis | 75.2 /100 | #155 | Good 86.2% |
| Immigrants | Nepal | 73.3 /100 | #156 | Good 86.2% |
| Whites/Caucasians | 72.2 /100 | #157 | Good 86.2% |
| German Russians | 72.1 /100 | #158 | Good 86.2% |
| Immigrants | Kenya | 71.8 /100 | #159 | Good 86.2% |
| Immigrants | Morocco | 69.5 /100 | #160 | Good 86.1% |
| Immigrants | Syria | 69.3 /100 | #161 | Good 86.1% |
| Immigrants | Iraq | 68.1 /100 | #162 | Good 86.1% |
| Ugandans | 66.3 /100 | #163 | Good 86.1% |
| Venezuelans | 65.5 /100 | #164 | Good 86.0% |
| Alsatians | 64.3 /100 | #165 | Good 86.0% |
| Immigrants | Albania | 64.2 /100 | #166 | Good 86.0% |
Demographics Similar to Turks by GED/Equivalency
In terms of ged/equivalency, the demographic groups most similar to Turks are Polish (88.5%, a difference of 0.020%), Bhutanese (88.4%, a difference of 0.030%), Immigrants from Northern Europe (88.5%, a difference of 0.050%), Danish (88.4%, a difference of 0.050%), and Immigrants from Lithuania (88.6%, a difference of 0.090%).
| Demographics | Rating | Rank | GED/Equivalency |
| Russians | 99.8 /100 | #23 | Exceptional 88.6% |
| Slovaks | 99.8 /100 | #24 | Exceptional 88.6% |
| Estonians | 99.8 /100 | #25 | Exceptional 88.6% |
| Immigrants | Australia | 99.8 /100 | #26 | Exceptional 88.6% |
| Immigrants | Lithuania | 99.8 /100 | #27 | Exceptional 88.6% |
| Immigrants | Northern Europe | 99.8 /100 | #28 | Exceptional 88.5% |
| Poles | 99.8 /100 | #29 | Exceptional 88.5% |
| Turks | 99.8 /100 | #30 | Exceptional 88.5% |
| Bhutanese | 99.8 /100 | #31 | Exceptional 88.4% |
| Danes | 99.8 /100 | #32 | Exceptional 88.4% |
| Immigrants | Sweden | 99.7 /100 | #33 | Exceptional 88.4% |
| Immigrants | Japan | 99.7 /100 | #34 | Exceptional 88.4% |
| Immigrants | South Central Asia | 99.7 /100 | #35 | Exceptional 88.4% |
| Immigrants | Belgium | 99.7 /100 | #36 | Exceptional 88.3% |
| Immigrants | Austria | 99.7 /100 | #37 | Exceptional 88.3% |