Immigrants from Kenya vs Syrian GED/Equivalency
COMPARE
Immigrants from Kenya
Syrian
GED/Equivalency
GED/Equivalency Comparison
Immigrants from Kenya
Syrians
86.2%
GED/EQUIVALENCY
71.8/ 100
METRIC RATING
159th/ 347
METRIC RANK
87.2%
GED/EQUIVALENCY
96.6/ 100
METRIC RATING
101st/ 347
METRIC RANK
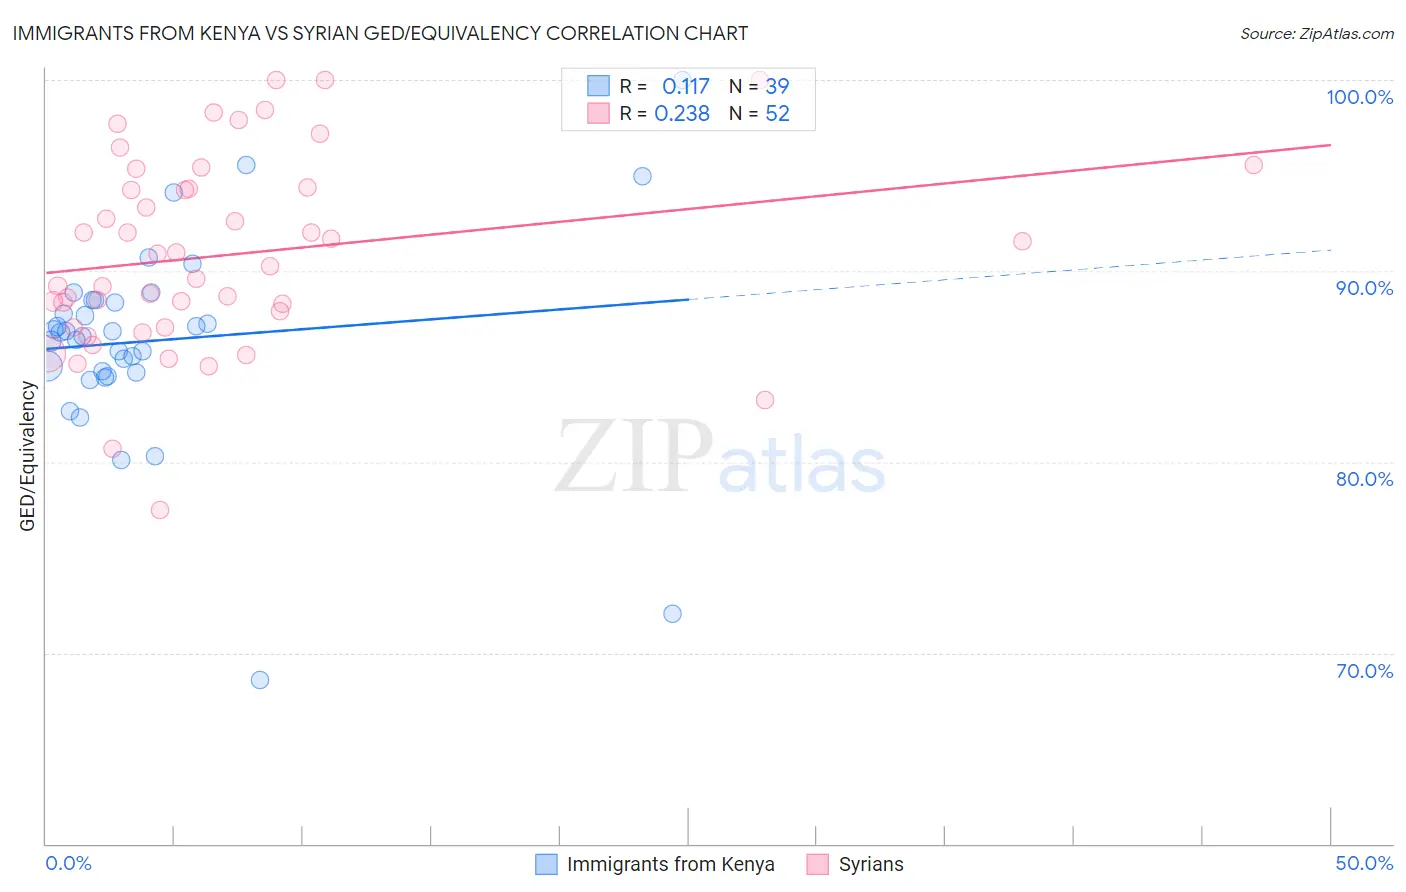
Immigrants from Kenya vs Syrian GED/Equivalency Correlation Chart
The statistical analysis conducted on geographies consisting of 218,076,690 people shows a poor positive correlation between the proportion of Immigrants from Kenya and percentage of population with at least ged/equivalency education in the United States with a correlation coefficient (R) of 0.117 and weighted average of 86.2%. Similarly, the statistical analysis conducted on geographies consisting of 266,306,452 people shows a weak positive correlation between the proportion of Syrians and percentage of population with at least ged/equivalency education in the United States with a correlation coefficient (R) of 0.238 and weighted average of 87.2%, a difference of 1.2%.
GED/Equivalency Correlation Summary
| Measurement | Immigrants from Kenya | Syrian |
| Minimum | 68.6% | 77.5% |
| Maximum | 100.0% | 100.0% |
| Range | 31.4% | 22.5% |
| Mean | 86.4% | 90.9% |
| Median | 86.8% | 90.6% |
| Interquartile 25% (IQ1) | 84.7% | 87.4% |
| Interquartile 75% (IQ3) | 88.5% | 94.3% |
| Interquartile Range (IQR) | 3.8% | 6.9% |
| Standard Deviation (Sample) | 5.4% | 5.0% |
| Standard Deviation (Population) | 5.4% | 5.0% |
Similar Demographics by GED/Equivalency
Demographics Similar to Immigrants from Kenya by GED/Equivalency
In terms of ged/equivalency, the demographic groups most similar to Immigrants from Kenya are White/Caucasian (86.2%, a difference of 0.010%), German Russian (86.2%, a difference of 0.010%), Immigrants from Nepal (86.2%, a difference of 0.040%), Immigrants from Morocco (86.1%, a difference of 0.060%), and Immigrants from Syria (86.1%, a difference of 0.060%).
| Demographics | Rating | Rank | GED/Equivalency |
| Brazilians | 77.2 /100 | #152 | Good 86.3% |
| Kenyans | 76.6 /100 | #153 | Good 86.3% |
| Armenians | 76.4 /100 | #154 | Good 86.3% |
| Iraqis | 75.2 /100 | #155 | Good 86.2% |
| Immigrants | Nepal | 73.3 /100 | #156 | Good 86.2% |
| Whites/Caucasians | 72.2 /100 | #157 | Good 86.2% |
| German Russians | 72.1 /100 | #158 | Good 86.2% |
| Immigrants | Kenya | 71.8 /100 | #159 | Good 86.2% |
| Immigrants | Morocco | 69.5 /100 | #160 | Good 86.1% |
| Immigrants | Syria | 69.3 /100 | #161 | Good 86.1% |
| Immigrants | Iraq | 68.1 /100 | #162 | Good 86.1% |
| Ugandans | 66.3 /100 | #163 | Good 86.1% |
| Venezuelans | 65.5 /100 | #164 | Good 86.0% |
| Alsatians | 64.3 /100 | #165 | Good 86.0% |
| Immigrants | Albania | 64.2 /100 | #166 | Good 86.0% |
Demographics Similar to Syrians by GED/Equivalency
In terms of ged/equivalency, the demographic groups most similar to Syrians are Palestinian (87.3%, a difference of 0.030%), Immigrants from Belarus (87.3%, a difference of 0.050%), Immigrants from Croatia (87.3%, a difference of 0.060%), Lebanese (87.2%, a difference of 0.060%), and Jordanian (87.2%, a difference of 0.070%).
| Demographics | Rating | Rank | GED/Equivalency |
| Immigrants | Russia | 97.8 /100 | #94 | Exceptional 87.4% |
| Immigrants | Greece | 97.7 /100 | #95 | Exceptional 87.4% |
| Czechoslovakians | 97.6 /100 | #96 | Exceptional 87.4% |
| Immigrants | Western Europe | 97.3 /100 | #97 | Exceptional 87.3% |
| Immigrants | Croatia | 96.9 /100 | #98 | Exceptional 87.3% |
| Immigrants | Belarus | 96.9 /100 | #99 | Exceptional 87.3% |
| Palestinians | 96.8 /100 | #100 | Exceptional 87.3% |
| Syrians | 96.6 /100 | #101 | Exceptional 87.2% |
| Lebanese | 96.2 /100 | #102 | Exceptional 87.2% |
| Jordanians | 96.1 /100 | #103 | Exceptional 87.2% |
| Immigrants | Hungary | 96.0 /100 | #104 | Exceptional 87.2% |
| Indians (Asian) | 95.9 /100 | #105 | Exceptional 87.1% |
| Immigrants | Zimbabwe | 95.8 /100 | #106 | Exceptional 87.1% |
| Icelanders | 95.7 /100 | #107 | Exceptional 87.1% |
| Canadians | 95.6 /100 | #108 | Exceptional 87.1% |