Immigrants from Croatia vs Immigrants from Fiji GED/Equivalency
COMPARE
Immigrants from Croatia
Immigrants from Fiji
GED/Equivalency
GED/Equivalency Comparison
Immigrants from Croatia
Immigrants from Fiji
87.3%
GED/EQUIVALENCY
96.9/ 100
METRIC RATING
98th/ 347
METRIC RANK
82.7%
GED/EQUIVALENCY
0.1/ 100
METRIC RATING
279th/ 347
METRIC RANK
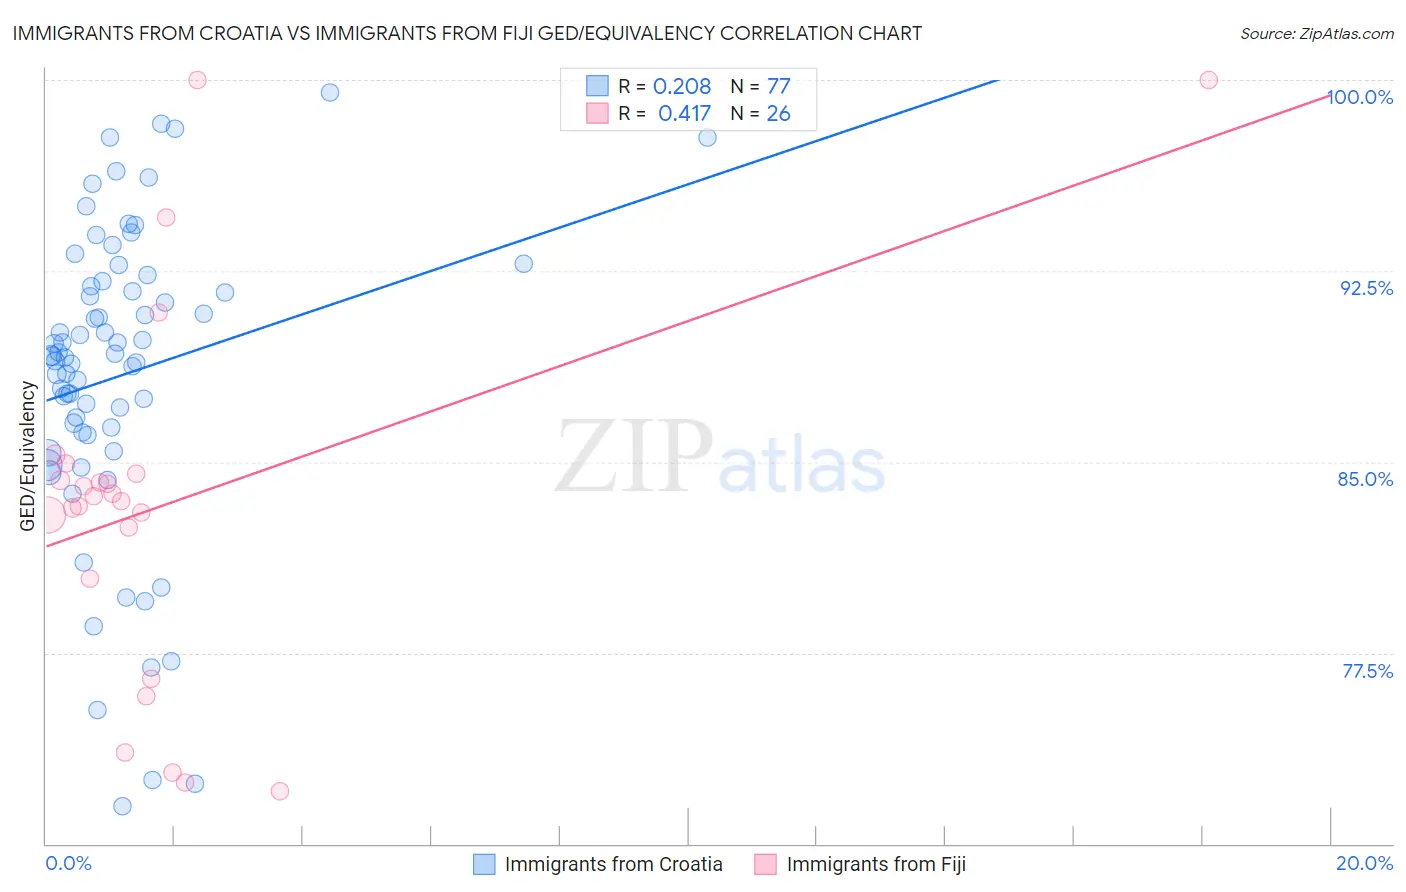
Immigrants from Croatia vs Immigrants from Fiji GED/Equivalency Correlation Chart
The statistical analysis conducted on geographies consisting of 132,577,989 people shows a weak positive correlation between the proportion of Immigrants from Croatia and percentage of population with at least ged/equivalency education in the United States with a correlation coefficient (R) of 0.208 and weighted average of 87.3%. Similarly, the statistical analysis conducted on geographies consisting of 93,756,204 people shows a moderate positive correlation between the proportion of Immigrants from Fiji and percentage of population with at least ged/equivalency education in the United States with a correlation coefficient (R) of 0.417 and weighted average of 82.7%, a difference of 5.5%.
GED/Equivalency Correlation Summary
| Measurement | Immigrants from Croatia | Immigrants from Fiji |
| Minimum | 71.5% | 72.1% |
| Maximum | 99.5% | 100.0% |
| Range | 28.0% | 27.9% |
| Mean | 88.4% | 83.3% |
| Median | 89.2% | 83.6% |
| Interquartile 25% (IQ1) | 86.1% | 80.4% |
| Interquartile 75% (IQ3) | 92.0% | 84.6% |
| Interquartile Range (IQR) | 5.9% | 4.2% |
| Standard Deviation (Sample) | 6.0% | 7.3% |
| Standard Deviation (Population) | 6.0% | 7.1% |
Similar Demographics by GED/Equivalency
Demographics Similar to Immigrants from Croatia by GED/Equivalency
In terms of ged/equivalency, the demographic groups most similar to Immigrants from Croatia are Immigrants from Belarus (87.3%, a difference of 0.010%), Palestinian (87.3%, a difference of 0.030%), Syrian (87.2%, a difference of 0.060%), Immigrants from Western Europe (87.3%, a difference of 0.070%), and Lebanese (87.2%, a difference of 0.11%).
| Demographics | Rating | Rank | GED/Equivalency |
| Immigrants | Eastern Asia | 97.9 /100 | #91 | Exceptional 87.4% |
| Israelis | 97.8 /100 | #92 | Exceptional 87.4% |
| Immigrants | North Macedonia | 97.8 /100 | #93 | Exceptional 87.4% |
| Immigrants | Russia | 97.8 /100 | #94 | Exceptional 87.4% |
| Immigrants | Greece | 97.7 /100 | #95 | Exceptional 87.4% |
| Czechoslovakians | 97.6 /100 | #96 | Exceptional 87.4% |
| Immigrants | Western Europe | 97.3 /100 | #97 | Exceptional 87.3% |
| Immigrants | Croatia | 96.9 /100 | #98 | Exceptional 87.3% |
| Immigrants | Belarus | 96.9 /100 | #99 | Exceptional 87.3% |
| Palestinians | 96.8 /100 | #100 | Exceptional 87.3% |
| Syrians | 96.6 /100 | #101 | Exceptional 87.2% |
| Lebanese | 96.2 /100 | #102 | Exceptional 87.2% |
| Jordanians | 96.1 /100 | #103 | Exceptional 87.2% |
| Immigrants | Hungary | 96.0 /100 | #104 | Exceptional 87.2% |
| Indians (Asian) | 95.9 /100 | #105 | Exceptional 87.1% |
Demographics Similar to Immigrants from Fiji by GED/Equivalency
In terms of ged/equivalency, the demographic groups most similar to Immigrants from Fiji are Immigrants from Laos (82.7%, a difference of 0.010%), Cheyenne (82.7%, a difference of 0.010%), Arapaho (82.8%, a difference of 0.040%), Black/African American (82.8%, a difference of 0.060%), and Seminole (82.8%, a difference of 0.080%).
| Demographics | Rating | Rank | GED/Equivalency |
| Barbadians | 0.1 /100 | #272 | Tragic 82.9% |
| Pennsylvania Germans | 0.1 /100 | #273 | Tragic 82.9% |
| Immigrants | Trinidad and Tobago | 0.1 /100 | #274 | Tragic 82.8% |
| Seminole | 0.1 /100 | #275 | Tragic 82.8% |
| Blacks/African Americans | 0.1 /100 | #276 | Tragic 82.8% |
| Arapaho | 0.1 /100 | #277 | Tragic 82.8% |
| Immigrants | Laos | 0.1 /100 | #278 | Tragic 82.7% |
| Immigrants | Fiji | 0.1 /100 | #279 | Tragic 82.7% |
| Cheyenne | 0.1 /100 | #280 | Tragic 82.7% |
| Sioux | 0.1 /100 | #281 | Tragic 82.6% |
| Immigrants | Immigrants | 0.1 /100 | #282 | Tragic 82.6% |
| Indonesians | 0.1 /100 | #283 | Tragic 82.5% |
| Immigrants | Barbados | 0.1 /100 | #284 | Tragic 82.4% |
| Cajuns | 0.0 /100 | #285 | Tragic 82.4% |
| Immigrants | West Indies | 0.0 /100 | #286 | Tragic 82.4% |