Zip Codes with the Highest Percentage of Population Employed in Farming, Fishing & Forestry in Connecticut
RELATED REPORTS & OPTIONS
Farming, Fishing & Forestry
Connecticut
Compare Zip Codes
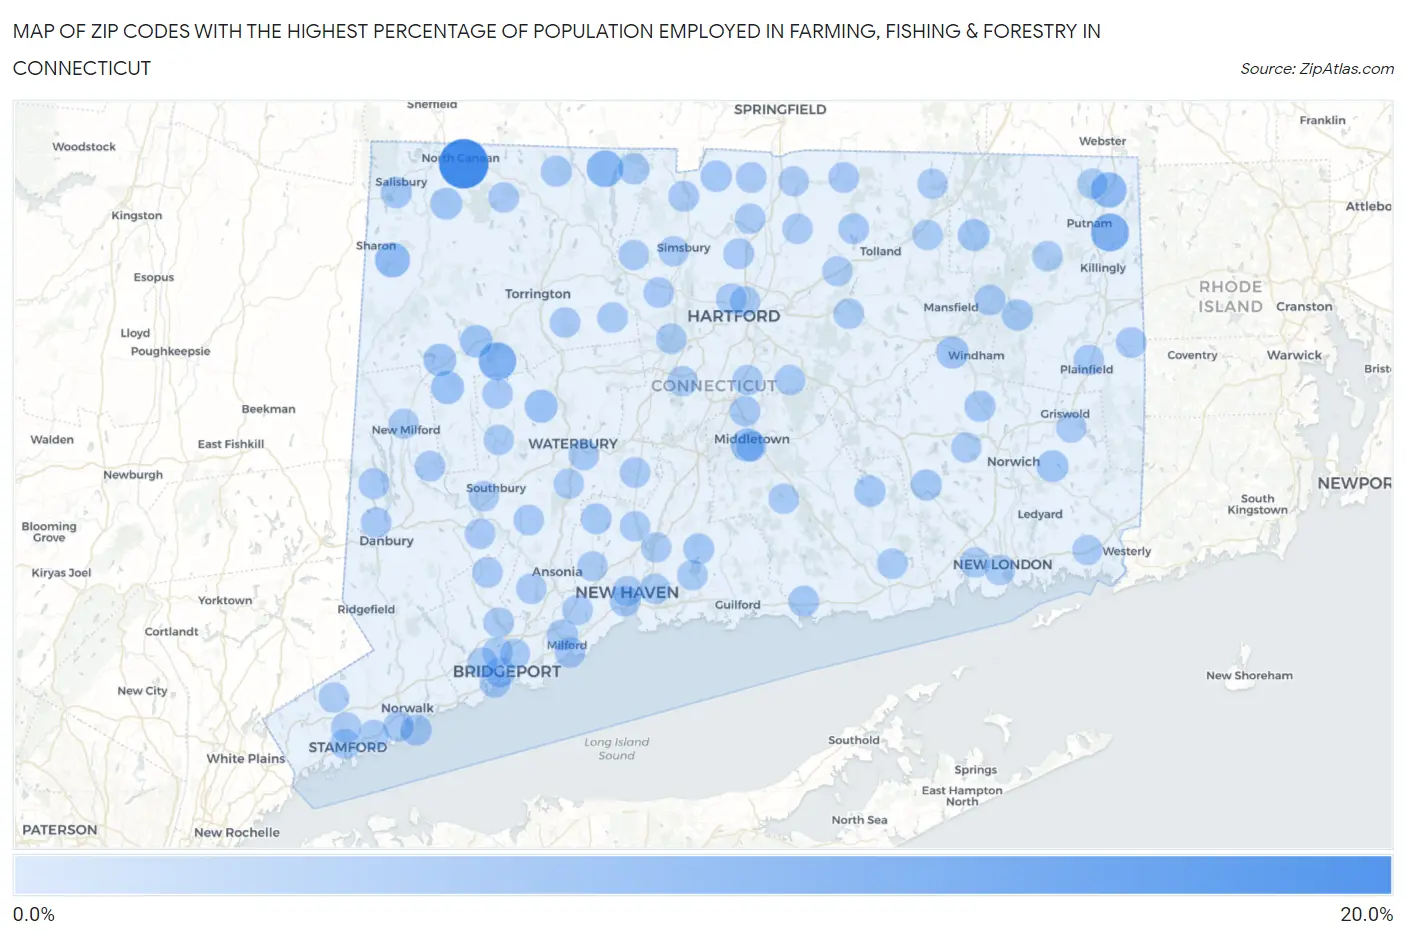
Map of Zip Codes with the Highest Percentage of Population Employed in Farming, Fishing & Forestry in Connecticut
0.0%
20.0%
Zip Codes with the Highest Percentage of Population Employed in Farming, Fishing & Forestry in Connecticut
| Zip Code | % Employed | vs State | vs National | |
| 1. | 06024 | 17.0% | 0.18%(+16.8)#1 | 0.61%(+16.4)#534 |
| 2. | 06260 | 6.7% | 0.18%(+6.55)#2 | 0.61%(+6.13)#2,080 |
| 3. | 06763 | 6.5% | 0.18%(+6.31)#3 | 0.61%(+5.89)#2,160 |
| 4. | 06091 | 5.6% | 0.18%(+5.38)#4 | 0.61%(+4.95)#2,628 |
| 5. | 06277 | 4.5% | 0.18%(+4.34)#5 | 0.61%(+3.91)#3,291 |
| 6. | 06069 | 4.0% | 0.18%(+3.87)#6 | 0.61%(+3.44)#3,680 |
| 7. | 06459 | 2.9% | 0.18%(+2.68)#7 | 0.61%(+2.26)#4,999 |
| 8. | 06794 | 2.5% | 0.18%(+2.31)#8 | 0.61%(+1.88)#5,578 |
| 9. | 06795 | 2.5% | 0.18%(+2.30)#9 | 0.61%(+1.88)#5,579 |
| 10. | 06777 | 2.2% | 0.18%(+2.00)#10 | 0.61%(+1.57)#6,169 |
| 11. | 06750 | 2.0% | 0.18%(+1.81)#11 | 0.61%(+1.38)#6,586 |
| 12. | 06226 | 1.8% | 0.18%(+1.66)#12 | 0.61%(+1.24)#6,917 |
| 13. | 06365 | 1.5% | 0.18%(+1.36)#13 | 0.61%(+0.935)#7,765 |
| 14. | 06278 | 1.5% | 0.18%(+1.31)#14 | 0.61%(+0.882)#7,920 |
| 15. | 06031 | 1.5% | 0.18%(+1.28)#15 | 0.61%(+0.851)#8,016 |
| 16. | 06247 | 1.1% | 0.18%(+0.898)#16 | 0.61%(+0.471)#9,419 |
| 17. | 06039 | 1.1% | 0.18%(+0.886)#17 | 0.61%(+0.458)#9,468 |
| 18. | 06093 | 1.1% | 0.18%(+0.877)#18 | 0.61%(+0.449)#9,499 |
| 19. | 06027 | 0.94% | 0.18%(+0.764)#19 | 0.61%(+0.337)#10,027 |
| 20. | 06461 | 0.94% | 0.18%(+0.761)#20 | 0.61%(+0.334)#10,044 |
| 21. | 06021 | 0.84% | 0.18%(+0.661)#21 | 0.61%(+0.233)#10,567 |
| 22. | 06423 | 0.81% | 0.18%(+0.629)#22 | 0.61%(+0.201)#10,734 |
| 23. | 06420 | 0.77% | 0.18%(+0.590)#23 | 0.61%(+0.162)#10,977 |
| 24. | 06254 | 0.76% | 0.18%(+0.584)#24 | 0.61%(+0.157)#11,005 |
| 25. | 06855 | 0.72% | 0.18%(+0.538)#25 | 0.61%(+0.110)#11,278 |
| 26. | 06472 | 0.62% | 0.18%(+0.445)#26 | 0.61%(+0.017)#11,867 |
| 27. | 06524 | 0.61% | 0.18%(+0.437)#27 | 0.61%(+0.009)#11,919 |
| 28. | 06413 | 0.61% | 0.18%(+0.431)#28 | 0.61%(+0.004)#11,970 |
| 29. | 06035 | 0.58% | 0.18%(+0.401)#29 | 0.61%(-0.027)#12,215 |
| 30. | 06235 | 0.54% | 0.18%(+0.367)#30 | 0.61%(-0.061)#12,483 |
| 31. | 06095 | 0.51% | 0.18%(+0.335)#31 | 0.61%(-0.093)#12,733 |
| 32. | 06071 | 0.49% | 0.18%(+0.315)#32 | 0.61%(-0.112)#12,903 |
| 33. | 06812 | 0.49% | 0.18%(+0.315)#33 | 0.61%(-0.113)#12,904 |
| 34. | 06854 | 0.49% | 0.18%(+0.312)#34 | 0.61%(-0.116)#12,940 |
| 35. | 06377 | 0.48% | 0.18%(+0.304)#35 | 0.61%(-0.123)#13,010 |
| 36. | 06706 | 0.47% | 0.18%(+0.296)#36 | 0.61%(-0.132)#13,078 |
| 37. | 06029 | 0.46% | 0.18%(+0.284)#37 | 0.61%(-0.143)#13,161 |
| 38. | 06460 | 0.45% | 0.18%(+0.271)#38 | 0.61%(-0.156)#13,294 |
| 39. | 06752 | 0.44% | 0.18%(+0.262)#39 | 0.61%(-0.166)#13,387 |
| 40. | 06468 | 0.44% | 0.18%(+0.262)#40 | 0.61%(-0.166)#13,389 |
| 41. | 06078 | 0.43% | 0.18%(+0.257)#41 | 0.61%(-0.171)#13,444 |
| 42. | 06605 | 0.43% | 0.18%(+0.251)#42 | 0.61%(-0.177)#13,512 |
| 43. | 06811 | 0.42% | 0.18%(+0.243)#43 | 0.61%(-0.184)#13,578 |
| 44. | 06112 | 0.42% | 0.18%(+0.239)#44 | 0.61%(-0.189)#13,611 |
| 45. | 06410 | 0.41% | 0.18%(+0.237)#45 | 0.61%(-0.191)#13,634 |
| 46. | 06013 | 0.40% | 0.18%(+0.223)#46 | 0.61%(-0.205)#13,745 |
| 47. | 06001 | 0.40% | 0.18%(+0.220)#47 | 0.61%(-0.208)#13,774 |
| 48. | 06416 | 0.39% | 0.18%(+0.215)#48 | 0.61%(-0.212)#13,820 |
| 49. | 06519 | 0.37% | 0.18%(+0.192)#49 | 0.61%(-0.235)#14,042 |
| 50. | 06751 | 0.35% | 0.18%(+0.176)#50 | 0.61%(-0.251)#14,213 |
| 51. | 06478 | 0.35% | 0.18%(+0.171)#51 | 0.61%(-0.257)#14,282 |
| 52. | 06604 | 0.34% | 0.18%(+0.164)#52 | 0.61%(-0.263)#14,341 |
| 53. | 06371 | 0.32% | 0.18%(+0.144)#53 | 0.61%(-0.284)#14,576 |
| 54. | 06058 | 0.31% | 0.18%(+0.136)#54 | 0.61%(-0.291)#14,659 |
| 55. | 06441 | 0.30% | 0.18%(+0.124)#55 | 0.61%(-0.303)#14,808 |
| 56. | 06791 | 0.30% | 0.18%(+0.123)#56 | 0.61%(-0.304)#14,815 |
| 57. | 06043 | 0.30% | 0.18%(+0.122)#57 | 0.61%(-0.306)#14,837 |
| 58. | 06482 | 0.29% | 0.18%(+0.117)#58 | 0.61%(-0.311)#14,902 |
| 59. | 06374 | 0.28% | 0.18%(+0.100)#59 | 0.61%(-0.328)#15,088 |
| 60. | 06032 | 0.27% | 0.18%(+0.093)#60 | 0.61%(-0.334)#15,161 |
| 61. | 06073 | 0.27% | 0.18%(+0.092)#61 | 0.61%(-0.336)#15,171 |
| 62. | 06477 | 0.27% | 0.18%(+0.090)#62 | 0.61%(-0.338)#15,194 |
| 63. | 06052 | 0.26% | 0.18%(+0.085)#63 | 0.61%(-0.343)#15,248 |
| 64. | 06259 | 0.26% | 0.18%(+0.082)#64 | 0.61%(-0.345)#15,283 |
| 65. | 06488 | 0.26% | 0.18%(+0.078)#65 | 0.61%(-0.350)#15,333 |
| 66. | 06016 | 0.24% | 0.18%(+0.063)#66 | 0.61%(-0.364)#15,526 |
| 67. | 06798 | 0.24% | 0.18%(+0.058)#67 | 0.61%(-0.370)#15,602 |
| 68. | 06471 | 0.23% | 0.18%(+0.055)#68 | 0.61%(-0.373)#15,654 |
| 69. | 06019 | 0.23% | 0.18%(+0.050)#69 | 0.61%(-0.377)#15,721 |
| 70. | 06096 | 0.23% | 0.18%(+0.047)#70 | 0.61%(-0.380)#15,763 |
| 71. | 06457 | 0.22% | 0.18%(+0.046)#71 | 0.61%(-0.382)#15,779 |
| 72. | 06820 | 0.22% | 0.18%(+0.044)#72 | 0.61%(-0.384)#15,811 |
| 73. | 06518 | 0.22% | 0.18%(+0.041)#73 | 0.61%(-0.386)#15,846 |
| 74. | 06484 | 0.21% | 0.18%(+0.035)#74 | 0.61%(-0.392)#15,945 |
| 75. | 06255 | 0.21% | 0.18%(+0.033)#75 | 0.61%(-0.394)#15,972 |
| 76. | 06606 | 0.20% | 0.18%(+0.025)#76 | 0.61%(-0.403)#16,094 |
| 77. | 06385 | 0.20% | 0.18%(+0.021)#77 | 0.61%(-0.406)#16,143 |
| 78. | 06351 | 0.19% | 0.18%(+0.011)#78 | 0.61%(-0.417)#16,296 |
| 79. | 06825 | 0.19% | 0.18%(+0.010)#79 | 0.61%(-0.417)#16,297 |
| 80. | 06776 | 0.18% | 0.18%(+0.003)#80 | 0.61%(-0.425)#16,413 |
| 81. | 06320 | 0.18% | 0.18%(-0.000)#81 | 0.61%(-0.428)#16,451 |
| 82. | 06903 | 0.18% | 0.18%(-0.002)#82 | 0.61%(-0.429)#16,478 |
| 83. | 06076 | 0.17% | 0.18%(-0.008)#83 | 0.61%(-0.435)#16,571 |
| 84. | 06611 | 0.16% | 0.18%(-0.014)#84 | 0.61%(-0.441)#16,670 |
| 85. | 06905 | 0.16% | 0.18%(-0.020)#85 | 0.61%(-0.447)#16,773 |
| 86. | 06511 | 0.16% | 0.18%(-0.020)#86 | 0.61%(-0.447)#16,774 |
| 87. | 06334 | 0.15% | 0.18%(-0.024)#87 | 0.61%(-0.451)#16,843 |
| 88. | 06120 | 0.15% | 0.18%(-0.025)#88 | 0.61%(-0.453)#16,872 |
| 89. | 06070 | 0.15% | 0.18%(-0.026)#89 | 0.61%(-0.453)#16,878 |
| 90. | 06770 | 0.15% | 0.18%(-0.027)#90 | 0.61%(-0.455)#16,895 |
| 91. | 06902 | 0.14% | 0.18%(-0.034)#91 | 0.61%(-0.462)#17,034 |
| 92. | 06279 | 0.14% | 0.18%(-0.041)#92 | 0.61%(-0.468)#17,156 |
| 93. | 06066 | 0.13% | 0.18%(-0.045)#93 | 0.61%(-0.472)#17,222 |
| 94. | 06473 | 0.13% | 0.18%(-0.047)#94 | 0.61%(-0.474)#17,258 |
| 95. | 06610 | 0.13% | 0.18%(-0.050)#95 | 0.61%(-0.477)#17,293 |
| 96. | 06067 | 0.12% | 0.18%(-0.055)#96 | 0.61%(-0.482)#17,375 |
| 97. | 06513 | 0.12% | 0.18%(-0.059)#97 | 0.61%(-0.486)#17,448 |
| 98. | 06525 | 0.11% | 0.18%(-0.071)#98 | 0.61%(-0.498)#17,625 |
| 99. | 06082 | 0.10% | 0.18%(-0.073)#99 | 0.61%(-0.501)#17,671 |
| 100. | 06378 | 0.10% | 0.18%(-0.078)#100 | 0.61%(-0.505)#17,753 |
Common Questions
What are the Top 10 Zip Codes with the Highest Percentage of Population Employed in Farming, Fishing & Forestry in Connecticut?
Top 10 Zip Codes with the Highest Percentage of Population Employed in Farming, Fishing & Forestry in Connecticut are:
What zip code has the Highest Percentage of Population Employed in Farming, Fishing & Forestry in Connecticut?
06024 has the Highest Percentage of Population Employed in Farming, Fishing & Forestry in Connecticut with 17.0%.
What is the Percentage of Population Employed in Farming, Fishing & Forestry in the State of Connecticut?
Percentage of Population Employed in Farming, Fishing & Forestry in Connecticut is 0.18%.
What is the Percentage of Population Employed in Farming, Fishing & Forestry in the United States?
Percentage of Population Employed in Farming, Fishing & Forestry in the United States is 0.61%.