Yugoslavian vs German Married-Couple Family Poverty
COMPARE
Yugoslavian
German
Married-Couple Family Poverty
Married-Couple Family Poverty Comparison
Yugoslavians
Germans
4.6%
MARRIED-COUPLE FAMILY POVERTY
97.8/ 100
METRIC RATING
101st/ 347
METRIC RANK
4.0%
MARRIED-COUPLE FAMILY POVERTY
100.0/ 100
METRIC RATING
16th/ 347
METRIC RANK
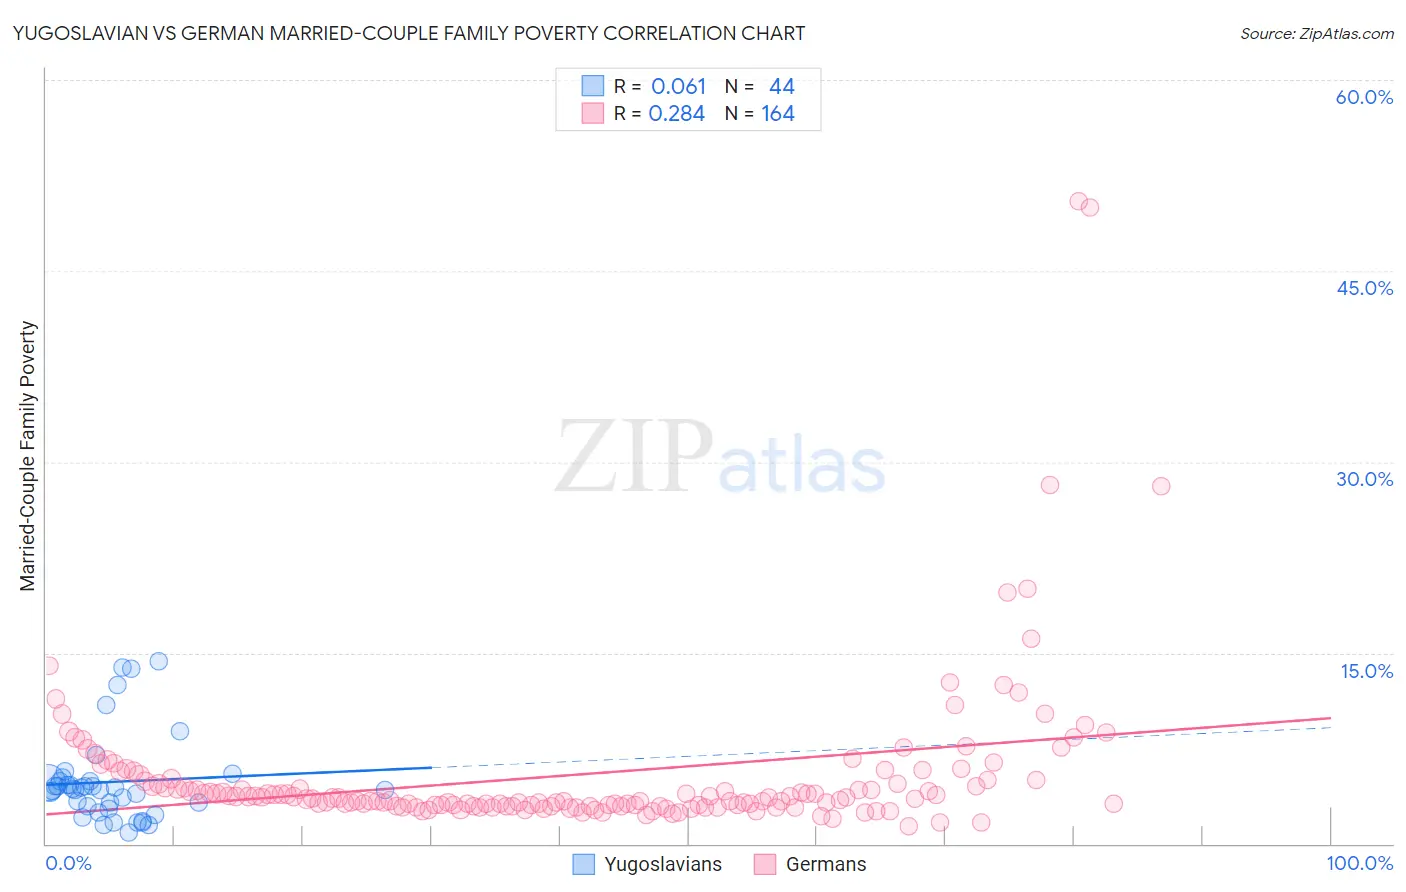
Yugoslavian vs German Married-Couple Family Poverty Correlation Chart
The statistical analysis conducted on geographies consisting of 284,040,939 people shows a slight positive correlation between the proportion of Yugoslavians and poverty level among married-couple families in the United States with a correlation coefficient (R) of 0.061 and weighted average of 4.6%. Similarly, the statistical analysis conducted on geographies consisting of 564,067,138 people shows a weak positive correlation between the proportion of Germans and poverty level among married-couple families in the United States with a correlation coefficient (R) of 0.284 and weighted average of 4.0%, a difference of 15.0%.
Married-Couple Family Poverty Correlation Summary
| Measurement | Yugoslavian | German |
| Minimum | 0.92% | 1.4% |
| Maximum | 14.3% | 50.4% |
| Range | 13.4% | 49.1% |
| Mean | 4.9% | 5.4% |
| Median | 4.3% | 3.6% |
| Interquartile 25% (IQ1) | 2.8% | 3.0% |
| Interquartile 75% (IQ3) | 4.9% | 5.0% |
| Interquartile Range (IQR) | 2.1% | 2.0% |
| Standard Deviation (Sample) | 3.4% | 6.4% |
| Standard Deviation (Population) | 3.3% | 6.3% |
Similar Demographics by Married-Couple Family Poverty
Demographics Similar to Yugoslavians by Married-Couple Family Poverty
In terms of married-couple family poverty, the demographic groups most similar to Yugoslavians are Immigrants from Western Europe (4.6%, a difference of 0.020%), Immigrants from Europe (4.6%, a difference of 0.13%), Native Hawaiian (4.6%, a difference of 0.24%), Asian (4.7%, a difference of 0.40%), and Immigrants from Belgium (4.6%, a difference of 0.67%).
| Demographics | Rating | Rank | Married-Couple Family Poverty |
| Immigrants | Italy | 98.3 /100 | #94 | Exceptional 4.6% |
| Portuguese | 98.3 /100 | #95 | Exceptional 4.6% |
| Immigrants | Poland | 98.3 /100 | #96 | Exceptional 4.6% |
| Immigrants | Belgium | 98.2 /100 | #97 | Exceptional 4.6% |
| Native Hawaiians | 98.0 /100 | #98 | Exceptional 4.6% |
| Immigrants | Europe | 97.9 /100 | #99 | Exceptional 4.6% |
| Immigrants | Western Europe | 97.9 /100 | #100 | Exceptional 4.6% |
| Yugoslavians | 97.8 /100 | #101 | Exceptional 4.6% |
| Asians | 97.6 /100 | #102 | Exceptional 4.7% |
| Immigrants | Romania | 97.3 /100 | #103 | Exceptional 4.7% |
| Immigrants | Moldova | 97.1 /100 | #104 | Exceptional 4.7% |
| Aleuts | 97.0 /100 | #105 | Exceptional 4.7% |
| Immigrants | France | 96.9 /100 | #106 | Exceptional 4.7% |
| Immigrants | Germany | 96.8 /100 | #107 | Exceptional 4.7% |
| Laotians | 96.6 /100 | #108 | Exceptional 4.7% |
Demographics Similar to Germans by Married-Couple Family Poverty
In terms of married-couple family poverty, the demographic groups most similar to Germans are Filipino (4.0%, a difference of 0.030%), Italian (4.0%, a difference of 0.040%), Polish (4.0%, a difference of 0.27%), Slovak (4.0%, a difference of 0.30%), and Czech (4.0%, a difference of 0.34%).
| Demographics | Rating | Rank | Married-Couple Family Poverty |
| Croatians | 100.0 /100 | #9 | Exceptional 3.9% |
| Carpatho Rusyns | 100.0 /100 | #10 | Exceptional 3.9% |
| Lithuanians | 100.0 /100 | #11 | Exceptional 4.0% |
| Bulgarians | 100.0 /100 | #12 | Exceptional 4.0% |
| Czechs | 100.0 /100 | #13 | Exceptional 4.0% |
| Slovaks | 100.0 /100 | #14 | Exceptional 4.0% |
| Poles | 100.0 /100 | #15 | Exceptional 4.0% |
| Germans | 100.0 /100 | #16 | Exceptional 4.0% |
| Filipinos | 100.0 /100 | #17 | Exceptional 4.0% |
| Italians | 100.0 /100 | #18 | Exceptional 4.0% |
| Immigrants | Ireland | 99.9 /100 | #19 | Exceptional 4.1% |
| Maltese | 99.9 /100 | #20 | Exceptional 4.1% |
| Zimbabweans | 99.9 /100 | #21 | Exceptional 4.1% |
| Immigrants | Singapore | 99.9 /100 | #22 | Exceptional 4.1% |
| Bhutanese | 99.9 /100 | #23 | Exceptional 4.1% |