Yugoslavian 1 or more Vehicles in Household
COMPARE
Yugoslavian
Select to Compare
1 or more Vehicles in Household
Yugoslavian 1 or more Vehicles in Household
91.1%
1+ VEHICLES AVAILABLE
98.3/ 100
METRIC RATING
103rd/ 347
METRIC RANK
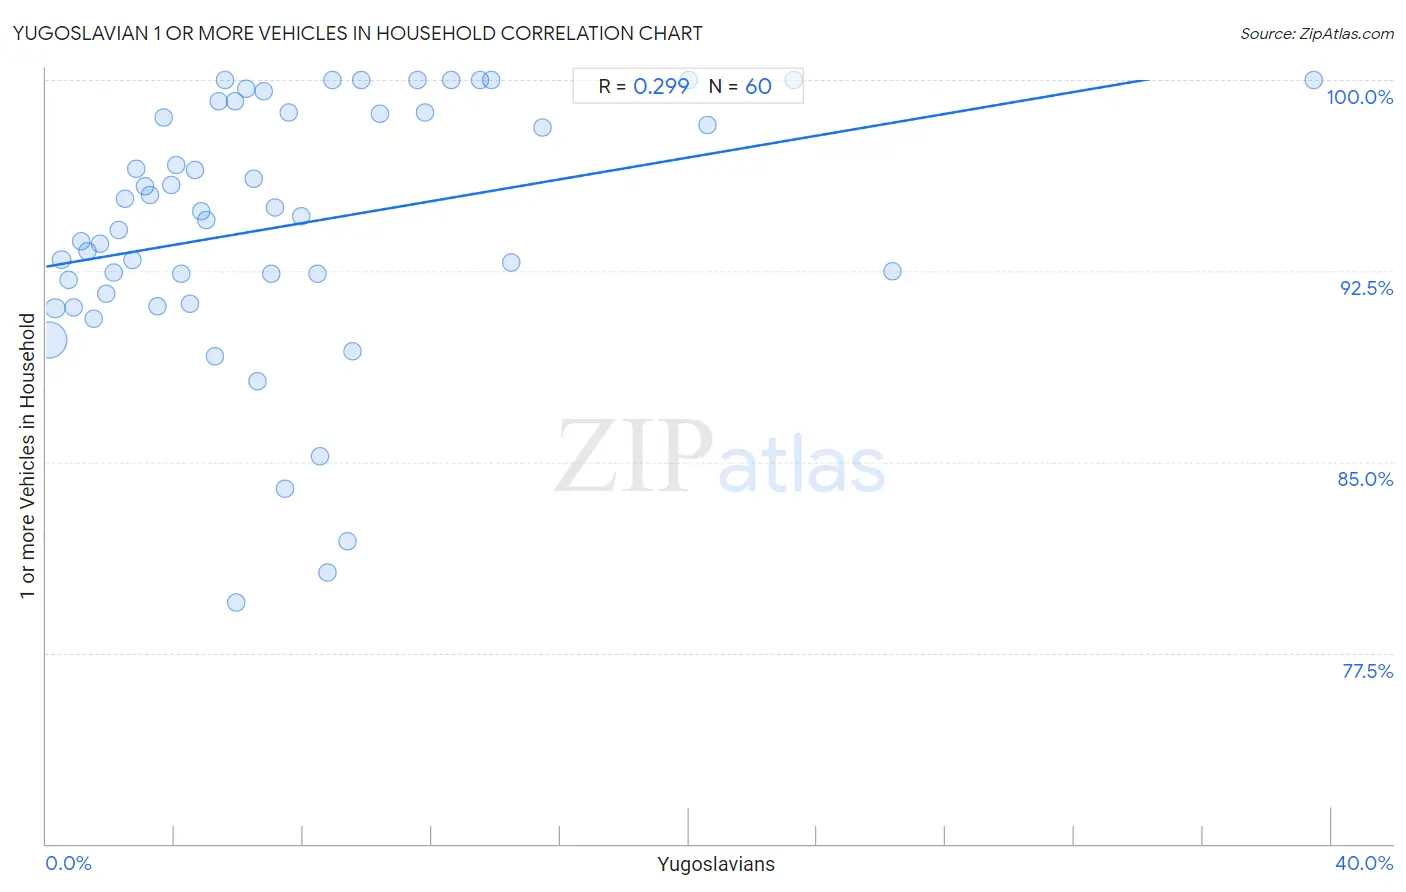
Yugoslavian 1 or more Vehicles in Household Correlation Chart
The statistical analysis conducted on geographies consisting of 285,650,059 people shows a weak positive correlation between the proportion of Yugoslavians and percentage of households with 1 or more vehicles available in the United States with a correlation coefficient (R) of 0.299 and weighted average of 91.1%. On average, for every 1% (one percent) increase in Yugoslavians within a typical geography, there is an increase of 0.21% in percentage of households with 1 or more vehicles available.
It is essential to understand that the correlation between the percentage of Yugoslavians and percentage of households with 1 or more vehicles available does not imply a direct cause-and-effect relationship. It remains uncertain whether the presence of Yugoslavians influences an upward or downward trend in the level of percentage of households with 1 or more vehicles available within an area, or if Yugoslavians simply ended up residing in those areas with higher or lower levels of percentage of households with 1 or more vehicles available due to other factors.
Demographics Similar to Yugoslavians by 1 or more Vehicles in Household
In terms of 1 or more vehicles in household, the demographic groups most similar to Yugoslavians are Seminole (91.1%, a difference of 0.010%), Asian (91.1%, a difference of 0.010%), Bulgarian (91.1%, a difference of 0.030%), Immigrants from Central America (91.1%, a difference of 0.040%), and Laotian (91.0%, a difference of 0.060%).
| Demographics | Rating | Rank | 1 or more Vehicles in Household |
| Potawatomi | 99.0 /100 | #96 | Exceptional 91.3% |
| Pakistanis | 99.0 /100 | #97 | Exceptional 91.3% |
| Slavs | 98.7 /100 | #98 | Exceptional 91.2% |
| Immigrants from Bolivia | 98.6 /100 | #99 | Exceptional 91.2% |
| Immigrants from Central America | 98.4 /100 | #100 | Exceptional 91.1% |
| Bulgarians | 98.4 /100 | #101 | Exceptional 91.1% |
| Seminole | 98.3 /100 | #102 | Exceptional 91.1% |
| Yugoslavians | 98.3 /100 | #103 | Exceptional 91.1% |
| Asians | 98.2 /100 | #104 | Exceptional 91.1% |
| Laotians | 98.0 /100 | #105 | Exceptional 91.0% |
| Zimbabweans | 97.7 /100 | #106 | Exceptional 91.0% |
| Maltese | 97.7 /100 | #107 | Exceptional 91.0% |
| Hispanics or Latinos | 97.6 /100 | #108 | Exceptional 91.0% |
| Delaware | 97.6 /100 | #109 | Exceptional 91.0% |
| Mexican American Indians | 97.4 /100 | #110 | Exceptional 91.0% |
Yugoslavian 1 or more Vehicles in Household Correlation Summary
| Measurement | Yugoslavian Data | 1 or more Vehicles in Household Data |
| Minimum | 0.060% | 79.5% |
| Maximum | 39.5% | 100.0% |
| Range | 39.4% | 20.5% |
| Mean | 7.6% | 94.3% |
| Median | 5.9% | 94.8% |
| Interquartile 25% (IQ1) | 2.9% | 91.9% |
| Interquartile 75% (IQ3) | 9.5% | 98.7% |
| Interquartile Range (IQR) | 6.5% | 6.8% |
| Standard Deviation (Sample) | 7.1% | 5.1% |
| Standard Deviation (Population) | 7.0% | 5.0% |
Correlation Details
| Yugoslavian Percentile | Sample Size | 1 or more Vehicles in Household |
[ 0.0% - 0.5% ] 0.060% | 239,006,038 | 89.8% |
[ 0.0% - 0.5% ] 0.28% | 27,874,065 | 91.0% |
[ 0.0% - 0.5% ] 0.48% | 8,632,858 | 92.9% |
[ 0.5% - 1.0% ] 0.69% | 3,570,912 | 92.2% |
[ 0.5% - 1.0% ] 0.87% | 2,193,517 | 91.0% |
[ 1.0% - 1.5% ] 1.08% | 1,093,165 | 93.7% |
[ 1.0% - 1.5% ] 1.26% | 751,260 | 93.3% |
[ 1.0% - 1.5% ] 1.47% | 391,529 | 90.6% |
[ 1.5% - 2.0% ] 1.66% | 389,348 | 93.6% |
[ 1.5% - 2.0% ] 1.89% | 374,706 | 91.6% |
[ 2.0% - 2.5% ] 2.09% | 269,257 | 92.4% |
[ 2.0% - 2.5% ] 2.24% | 195,748 | 94.1% |
[ 2.0% - 2.5% ] 2.47% | 116,196 | 95.3% |
[ 2.5% - 3.0% ] 2.68% | 164,492 | 92.9% |
[ 2.5% - 3.0% ] 2.79% | 44,297 | 96.5% |
[ 3.0% - 3.5% ] 3.06% | 28,373 | 95.8% |
[ 3.0% - 3.5% ] 3.22% | 51,411 | 95.5% |
[ 3.0% - 3.5% ] 3.45% | 85,120 | 91.1% |
[ 3.5% - 4.0% ] 3.67% | 5,070 | 98.5% |
[ 3.5% - 4.0% ] 3.88% | 8,180 | 95.9% |
[ 4.0% - 4.5% ] 4.05% | 11,563 | 96.7% |
[ 4.0% - 4.5% ] 4.22% | 32,592 | 92.4% |
[ 4.0% - 4.5% ] 4.47% | 12,554 | 91.2% |
[ 4.5% - 5.0% ] 4.63% | 6,609 | 96.5% |
[ 4.5% - 5.0% ] 4.83% | 10,984 | 94.8% |
[ 4.5% - 5.0% ] 4.97% | 71,284 | 94.5% |
[ 5.0% - 5.5% ] 5.26% | 22,286 | 89.2% |
[ 5.0% - 5.5% ] 5.37% | 1,508 | 99.1% |
[ 5.5% - 6.0% ] 5.56% | 72 | 100.0% |
[ 5.5% - 6.0% ] 5.89% | 950 | 99.2% |
[ 5.5% - 6.0% ] 5.92% | 64,728 | 79.5% |
[ 6.0% - 6.5% ] 6.23% | 835 | 99.7% |
[ 6.0% - 6.5% ] 6.46% | 19,969 | 96.1% |
[ 6.5% - 7.0% ] 6.58% | 3,665 | 88.2% |
[ 6.5% - 7.0% ] 6.75% | 1,022 | 99.6% |
[ 7.0% - 7.5% ] 7.01% | 16,211 | 92.4% |
[ 7.0% - 7.5% ] 7.12% | 4,947 | 95.0% |
[ 7.0% - 7.5% ] 7.43% | 4,873 | 84.0% |
[ 7.5% - 8.0% ] 7.53% | 332 | 98.7% |
[ 7.5% - 8.0% ] 7.93% | 29,089 | 94.7% |
[ 8.0% - 8.5% ] 8.43% | 36,359 | 92.4% |
[ 8.5% - 9.0% ] 8.52% | 622 | 85.2% |
[ 8.5% - 9.0% ] 8.74% | 40,152 | 80.7% |
[ 8.5% - 9.0% ] 8.93% | 56 | 100.0% |
[ 9.0% - 9.5% ] 9.39% | 2,280 | 81.9% |
[ 9.5% - 10.0% ] 9.52% | 105 | 89.3% |
[ 9.5% - 10.0% ] 9.80% | 51 | 100.0% |
[ 10.0% - 10.5% ] 10.40% | 846 | 98.7% |
[ 11.5% - 12.0% ] 11.55% | 502 | 100.0% |
[ 11.5% - 12.0% ] 11.80% | 881 | 98.7% |
[ 12.5% - 13.0% ] 12.61% | 238 | 100.0% |
[ 13.5% - 14.0% ] 13.51% | 74 | 100.0% |
[ 13.5% - 14.0% ] 13.87% | 137 | 100.0% |
[ 14.0% - 14.5% ] 14.48% | 3,812 | 92.8% |
[ 15.0% - 15.5% ] 15.44% | 136 | 98.1% |
[ 20.0% - 20.5% ] 20.00% | 105 | 100.0% |
[ 20.5% - 21.0% ] 20.59% | 102 | 98.2% |
[ 23.0% - 23.5% ] 23.29% | 73 | 100.0% |
[ 26.0% - 26.5% ] 26.35% | 1,875 | 92.5% |
[ 39.0% - 39.5% ] 39.47% | 38 | 100.0% |