Ute 1 or more Vehicles in Household
COMPARE
Ute
Select to Compare
1 or more Vehicles in Household
Ute 1 or more Vehicles in Household
88.7%
1+ VEHICLES AVAILABLE
5.6/ 100
METRIC RATING
227th/ 347
METRIC RANK
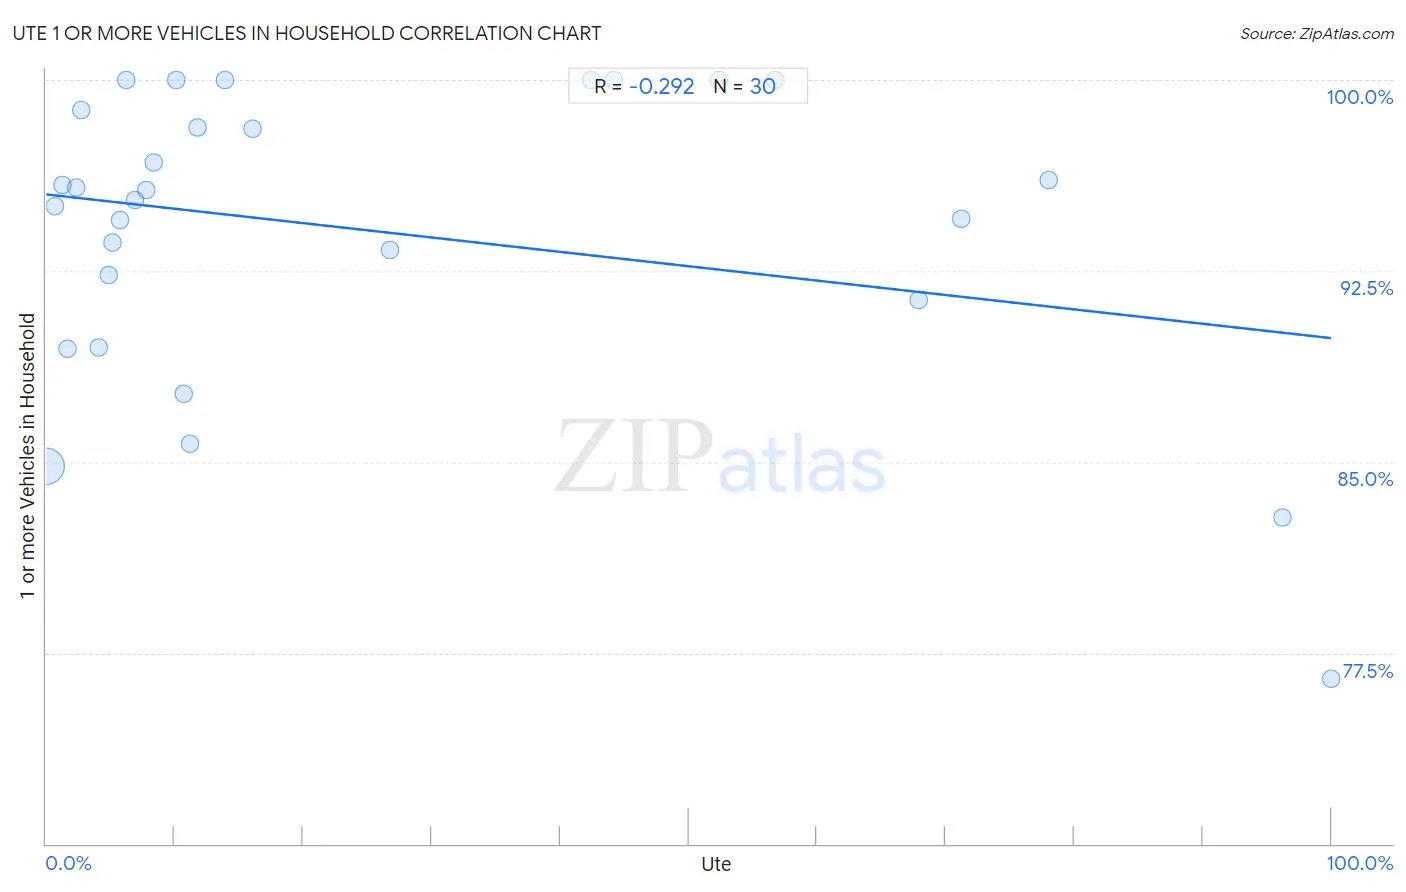
Ute 1 or more Vehicles in Household Correlation Chart
The statistical analysis conducted on geographies consisting of 55,668,072 people shows a weak negative correlation between the proportion of Ute and percentage of households with 1 or more vehicles available in the United States with a correlation coefficient (R) of -0.292 and weighted average of 88.7%. On average, for every 1% (one percent) increase in Ute within a typical geography, there is a decrease of 0.056% in percentage of households with 1 or more vehicles available.
It is essential to understand that the correlation between the percentage of Ute and percentage of households with 1 or more vehicles available does not imply a direct cause-and-effect relationship. It remains uncertain whether the presence of Ute influences an upward or downward trend in the level of percentage of households with 1 or more vehicles available within an area, or if Ute simply ended up residing in those areas with higher or lower levels of percentage of households with 1 or more vehicles available due to other factors.
Demographics Similar to Ute by 1 or more Vehicles in Household
In terms of 1 or more vehicles in household, the demographic groups most similar to Ute are Cheyenne (88.7%, a difference of 0.0%), Immigrants from Norway (88.7%, a difference of 0.010%), Immigrants from Romania (88.7%, a difference of 0.020%), Cree (88.7%, a difference of 0.030%), and Immigrants from Sierra Leone (88.7%, a difference of 0.030%).
| Demographics | Rating | Rank | 1 or more Vehicles in Household |
| Immigrants from Zaire | 8.1 /100 | #220 | Tragic 88.8% |
| Peruvians | 7.9 /100 | #221 | Tragic 88.8% |
| Uruguayans | 7.0 /100 | #222 | Tragic 88.8% |
| Immigrants from South America | 7.0 /100 | #223 | Tragic 88.8% |
| Immigrants from Hong Kong | 6.2 /100 | #224 | Tragic 88.7% |
| Cree | 6.0 /100 | #225 | Tragic 88.7% |
| Cheyenne | 5.7 /100 | #226 | Tragic 88.7% |
| Ute | 5.6 /100 | #227 | Tragic 88.7% |
| Immigrants from Norway | 5.5 /100 | #228 | Tragic 88.7% |
| Immigrants from Romania | 5.4 /100 | #229 | Tragic 88.7% |
| Immigrants from Sierra Leone | 5.2 /100 | #230 | Tragic 88.7% |
| Russians | 5.0 /100 | #231 | Tragic 88.7% |
| Immigrants from Japan | 4.9 /100 | #232 | Tragic 88.7% |
| Houma | 4.8 /100 | #233 | Tragic 88.6% |
| Immigrants from Peru | 4.7 /100 | #234 | Tragic 88.6% |
Ute 1 or more Vehicles in Household Correlation Summary
| Measurement | Ute Data | 1 or more Vehicles in Household Data |
| Minimum | 0.028% | 76.5% |
| Maximum | 100.0% | 100.0% |
| Range | 100.0% | 23.5% |
| Mean | 25.6% | 94.1% |
| Median | 10.4% | 95.5% |
| Interquartile 25% (IQ1) | 4.9% | 91.4% |
| Interquartile 75% (IQ3) | 44.1% | 98.8% |
| Interquartile Range (IQR) | 39.3% | 7.5% |
| Standard Deviation (Sample) | 30.6% | 5.9% |
| Standard Deviation (Population) | 30.0% | 5.8% |
Correlation Details
| Ute Percentile | Sample Size | 1 or more Vehicles in Household |
[ 0.0% - 0.5% ] 0.028% | 55,248,495 | 84.8% |
[ 0.5% - 1.0% ] 0.68% | 249,344 | 95.0% |
[ 1.0% - 1.5% ] 1.22% | 56,635 | 95.9% |
[ 1.5% - 2.0% ] 1.67% | 10,159 | 89.5% |
[ 2.0% - 2.5% ] 2.33% | 50,998 | 95.8% |
[ 2.5% - 3.0% ] 2.75% | 8,458 | 98.8% |
[ 4.0% - 4.5% ] 4.09% | 2,004 | 89.5% |
[ 4.5% - 5.0% ] 4.86% | 8,830 | 92.3% |
[ 5.0% - 5.5% ] 5.13% | 1,151 | 93.6% |
[ 5.5% - 6.0% ] 5.71% | 14,894 | 94.5% |
[ 6.0% - 6.5% ] 6.22% | 498 | 100.0% |
[ 6.5% - 7.0% ] 6.87% | 771 | 95.3% |
[ 7.5% - 8.0% ] 7.81% | 1,754 | 95.7% |
[ 8.0% - 8.5% ] 8.33% | 1,285 | 96.8% |
[ 10.0% - 10.5% ] 10.13% | 158 | 100.0% |
[ 10.5% - 11.0% ] 10.75% | 577 | 87.7% |
[ 11.0% - 11.5% ] 11.16% | 484 | 85.7% |
[ 11.5% - 12.0% ] 11.76% | 5,495 | 98.1% |
[ 13.5% - 14.0% ] 13.93% | 244 | 100.0% |
[ 16.0% - 16.5% ] 16.07% | 616 | 98.1% |
[ 26.5% - 27.0% ] 26.77% | 310 | 93.3% |
[ 42.0% - 42.5% ] 42.40% | 283 | 100.0% |
[ 44.0% - 44.5% ] 44.12% | 136 | 100.0% |
[ 52.0% - 52.5% ] 52.36% | 191 | 100.0% |
[ 56.5% - 57.0% ] 56.67% | 60 | 100.0% |
[ 67.5% - 68.0% ] 67.87% | 831 | 91.4% |
[ 71.0% - 71.5% ] 71.25% | 1,186 | 94.5% |
[ 78.0% - 78.5% ] 78.06% | 1,691 | 96.1% |
[ 96.0% - 96.5% ] 96.19% | 472 | 82.8% |
[ 99.5% - 100.0% ] 100.00% | 62 | 76.5% |