Iroquois Male Disability
COMPARE
Iroquois
Select to Compare
Male Disability
Iroquois Male Disability
13.6%
DISABILITY | MALES
0.0/ 100
METRIC RATING
315th/ 347
METRIC RANK
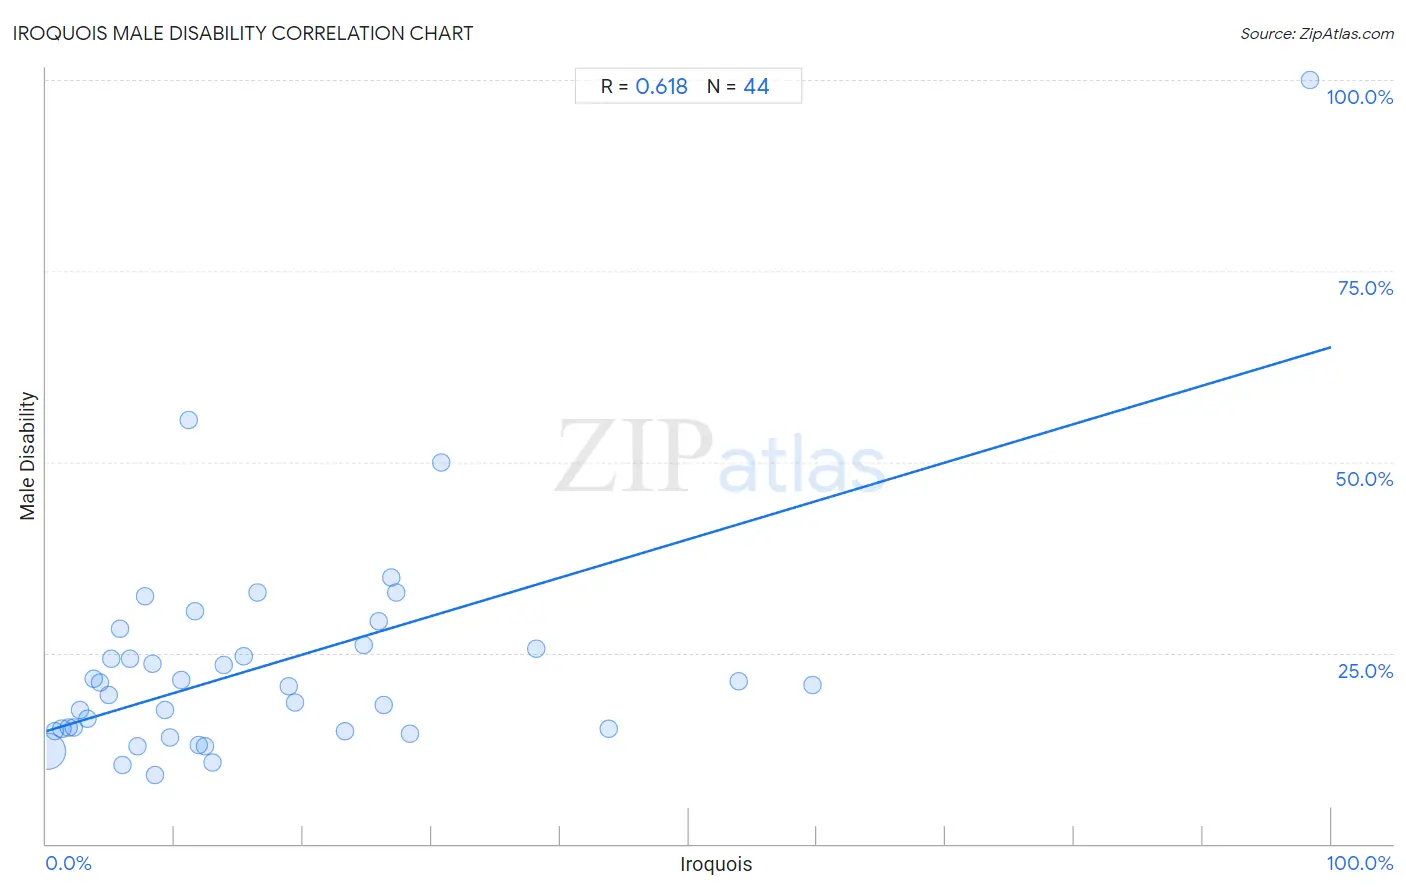
Iroquois Male Disability Correlation Chart
The statistical analysis conducted on geographies consisting of 207,273,711 people shows a significant positive correlation between the proportion of Iroquois and percentage of males with a disability in the United States with a correlation coefficient (R) of 0.618 and weighted average of 13.6%. On average, for every 1% (one percent) increase in Iroquois within a typical geography, there is an increase of 0.50% in percentage of males with a disability.
It is essential to understand that the correlation between the percentage of Iroquois and percentage of males with a disability does not imply a direct cause-and-effect relationship. It remains uncertain whether the presence of Iroquois influences an upward or downward trend in the level of percentage of males with a disability within an area, or if Iroquois simply ended up residing in those areas with higher or lower levels of percentage of males with a disability due to other factors.
Demographics Similar to Iroquois by Male Disability
In terms of male disability, the demographic groups most similar to Iroquois are Alaska Native (13.6%, a difference of 0.050%), Aleut (13.5%, a difference of 0.16%), Puget Sound Salish (13.5%, a difference of 0.22%), Yakama (13.5%, a difference of 0.24%), and Delaware (13.5%, a difference of 0.79%).
| Demographics | Rating | Rank | Male Disability |
| French American Indians | 0.0 /100 | #308 | Tragic 13.4% |
| Blackfeet | 0.0 /100 | #309 | Tragic 13.4% |
| Immigrants from the Azores | 0.0 /100 | #310 | Tragic 13.4% |
| Delaware | 0.0 /100 | #311 | Tragic 13.5% |
| Yakama | 0.0 /100 | #312 | Tragic 13.5% |
| Puget Sound Salish | 0.0 /100 | #313 | Tragic 13.5% |
| Aleuts | 0.0 /100 | #314 | Tragic 13.5% |
| Iroquois | 0.0 /100 | #315 | Tragic 13.6% |
| Alaska Natives | 0.0 /100 | #316 | Tragic 13.6% |
| Paiute | 0.0 /100 | #317 | Tragic 13.7% |
| Cree | 0.0 /100 | #318 | Tragic 13.7% |
| Americans | 0.0 /100 | #319 | Tragic 13.8% |
| Tlingit-Haida | 0.0 /100 | #320 | Tragic 13.8% |
| Shoshone | 0.0 /100 | #321 | Tragic 13.8% |
| Apache | 0.0 /100 | #322 | Tragic 14.0% |
Iroquois Male Disability Correlation Summary
| Measurement | Iroquois Data | Male Disability Data |
| Minimum | 0.054% | 9.0% |
| Maximum | 98.3% | 100.0% |
| Range | 98.3% | 91.0% |
| Mean | 17.3% | 23.4% |
| Median | 11.3% | 20.7% |
| Interquartile 25% (IQ1) | 5.4% | 14.9% |
| Interquartile 75% (IQ3) | 25.3% | 25.8% |
| Interquartile Range (IQR) | 19.9% | 11.0% |
| Standard Deviation (Sample) | 18.7% | 15.2% |
| Standard Deviation (Population) | 18.5% | 15.0% |
Correlation Details
| Iroquois Percentile | Sample Size | Male Disability |
[ 0.0% - 0.5% ] 0.054% | 203,086,006 | 12.0% |
[ 0.5% - 1.0% ] 0.65% | 2,862,058 | 14.7% |
[ 1.0% - 1.5% ] 1.21% | 581,974 | 15.1% |
[ 1.5% - 2.0% ] 1.73% | 221,177 | 15.3% |
[ 2.0% - 2.5% ] 2.14% | 295,620 | 15.3% |
[ 2.5% - 3.0% ] 2.61% | 35,437 | 17.6% |
[ 3.0% - 3.5% ] 3.19% | 52,759 | 16.3% |
[ 3.5% - 4.0% ] 3.67% | 39,289 | 21.5% |
[ 4.0% - 4.5% ] 4.15% | 11,474 | 21.0% |
[ 4.5% - 5.0% ] 4.82% | 5,622 | 19.4% |
[ 5.0% - 5.5% ] 5.07% | 2,211 | 24.1% |
[ 5.5% - 6.0% ] 5.76% | 2,481 | 28.1% |
[ 5.5% - 6.0% ] 5.96% | 10,561 | 10.3% |
[ 6.5% - 7.0% ] 6.56% | 839 | 24.2% |
[ 7.0% - 7.5% ] 7.08% | 1,568 | 12.8% |
[ 7.5% - 8.0% ] 7.72% | 272 | 32.4% |
[ 8.0% - 8.5% ] 8.25% | 1,345 | 23.5% |
[ 8.0% - 8.5% ] 8.43% | 356 | 9.0% |
[ 9.0% - 9.5% ] 9.28% | 6,186 | 17.5% |
[ 9.5% - 10.0% ] 9.67% | 12,363 | 13.9% |
[ 10.0% - 10.5% ] 10.46% | 4,367 | 21.5% |
[ 11.0% - 11.5% ] 11.11% | 36 | 55.6% |
[ 11.5% - 12.0% ] 11.58% | 1,097 | 30.4% |
[ 11.5% - 12.0% ] 11.84% | 1,681 | 13.0% |
[ 12.0% - 12.5% ] 12.32% | 2,207 | 12.7% |
[ 12.5% - 13.0% ] 12.90% | 1,202 | 10.6% |
[ 13.5% - 14.0% ] 13.82% | 2,076 | 23.4% |
[ 15.0% - 15.5% ] 15.37% | 885 | 24.6% |
[ 16.0% - 16.5% ] 16.39% | 1,037 | 32.9% |
[ 18.5% - 19.0% ] 18.85% | 12,805 | 20.6% |
[ 19.0% - 19.5% ] 19.37% | 506 | 18.6% |
[ 23.0% - 23.5% ] 23.26% | 2,218 | 14.7% |
[ 24.5% - 25.0% ] 24.74% | 2,910 | 26.1% |
[ 25.5% - 26.0% ] 25.91% | 656 | 29.2% |
[ 26.0% - 26.5% ] 26.31% | 1,600 | 18.2% |
[ 26.5% - 27.0% ] 26.83% | 205 | 34.8% |
[ 27.0% - 27.5% ] 27.27% | 132 | 32.9% |
[ 28.0% - 28.5% ] 28.26% | 138 | 14.5% |
[ 30.5% - 31.0% ] 30.77% | 117 | 50.0% |
[ 38.0% - 38.5% ] 38.12% | 160 | 25.6% |
[ 43.5% - 44.0% ] 43.75% | 128 | 15.0% |
[ 53.5% - 54.0% ] 53.93% | 4,222 | 21.2% |
[ 59.5% - 60.0% ] 59.63% | 3,669 | 20.8% |
[ 98.0% - 98.5% ] 98.31% | 59 | 100.0% |