Immigrants from Spain vs Immigrants from Haiti Married-Couple Family Poverty
COMPARE
Immigrants from Spain
Immigrants from Haiti
Married-Couple Family Poverty
Married-Couple Family Poverty Comparison
Immigrants from Spain
Immigrants from Haiti
5.0%
MARRIED-COUPLE FAMILY POVERTY
79.9/ 100
METRIC RATING
145th/ 347
METRIC RANK
7.0%
MARRIED-COUPLE FAMILY POVERTY
0.0/ 100
METRIC RATING
306th/ 347
METRIC RANK
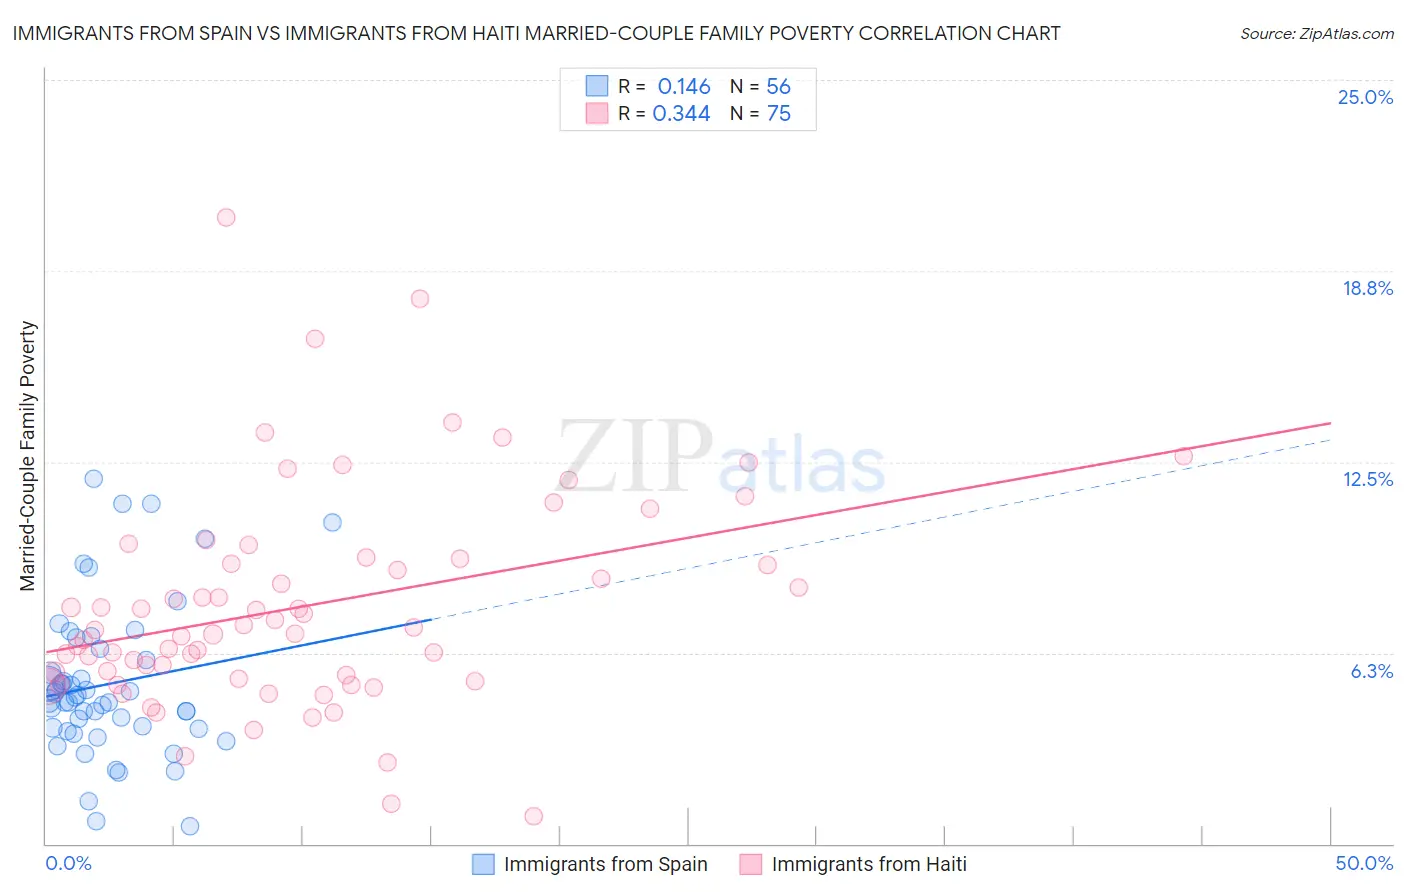
Immigrants from Spain vs Immigrants from Haiti Married-Couple Family Poverty Correlation Chart
The statistical analysis conducted on geographies consisting of 238,548,596 people shows a poor positive correlation between the proportion of Immigrants from Spain and poverty level among married-couple families in the United States with a correlation coefficient (R) of 0.146 and weighted average of 5.0%. Similarly, the statistical analysis conducted on geographies consisting of 224,016,924 people shows a mild positive correlation between the proportion of Immigrants from Haiti and poverty level among married-couple families in the United States with a correlation coefficient (R) of 0.344 and weighted average of 7.0%, a difference of 39.0%.
Married-Couple Family Poverty Correlation Summary
| Measurement | Immigrants from Spain | Immigrants from Haiti |
| Minimum | 0.58% | 0.90% |
| Maximum | 12.0% | 20.5% |
| Range | 11.4% | 19.6% |
| Mean | 5.2% | 7.8% |
| Median | 4.7% | 7.0% |
| Interquartile 25% (IQ1) | 3.8% | 5.4% |
| Interquartile 75% (IQ3) | 6.2% | 9.3% |
| Interquartile Range (IQR) | 2.4% | 4.0% |
| Standard Deviation (Sample) | 2.5% | 3.5% |
| Standard Deviation (Population) | 2.5% | 3.5% |
Similar Demographics by Married-Couple Family Poverty
Demographics Similar to Immigrants from Spain by Married-Couple Family Poverty
In terms of married-couple family poverty, the demographic groups most similar to Immigrants from Spain are Mongolian (5.0%, a difference of 0.020%), Syrian (5.0%, a difference of 0.21%), Immigrants from Russia (5.0%, a difference of 0.21%), Immigrants from Oceania (5.0%, a difference of 0.24%), and Brazilian (5.0%, a difference of 0.29%).
| Demographics | Rating | Rank | Married-Couple Family Poverty |
| Chileans | 86.0 /100 | #138 | Excellent 4.9% |
| German Russians | 85.1 /100 | #139 | Excellent 5.0% |
| Immigrants | Portugal | 84.8 /100 | #140 | Excellent 5.0% |
| Immigrants | Brazil | 84.6 /100 | #141 | Excellent 5.0% |
| Immigrants | China | 84.6 /100 | #142 | Excellent 5.0% |
| Immigrants | Egypt | 83.4 /100 | #143 | Excellent 5.0% |
| Hmong | 83.2 /100 | #144 | Excellent 5.0% |
| Immigrants | Spain | 79.9 /100 | #145 | Good 5.0% |
| Mongolians | 79.8 /100 | #146 | Good 5.0% |
| Syrians | 78.7 /100 | #147 | Good 5.0% |
| Immigrants | Russia | 78.7 /100 | #148 | Good 5.0% |
| Immigrants | Oceania | 78.6 /100 | #149 | Good 5.0% |
| Brazilians | 78.3 /100 | #150 | Good 5.0% |
| Immigrants | Cameroon | 77.3 /100 | #151 | Good 5.0% |
| Albanians | 77.2 /100 | #152 | Good 5.0% |
Demographics Similar to Immigrants from Haiti by Married-Couple Family Poverty
In terms of married-couple family poverty, the demographic groups most similar to Immigrants from Haiti are Guatemalan (7.0%, a difference of 1.1%), Spanish American Indian (7.1%, a difference of 1.3%), Hopi (7.1%, a difference of 1.9%), Immigrants from Nicaragua (7.1%, a difference of 1.9%), and Immigrants from Dominica (7.1%, a difference of 2.0%).
| Demographics | Rating | Rank | Married-Couple Family Poverty |
| Nicaraguans | 0.0 /100 | #299 | Tragic 6.7% |
| Immigrants | Belize | 0.0 /100 | #300 | Tragic 6.7% |
| Central Americans | 0.0 /100 | #301 | Tragic 6.7% |
| Immigrants | Ecuador | 0.0 /100 | #302 | Tragic 6.7% |
| Immigrants | El Salvador | 0.0 /100 | #303 | Tragic 6.8% |
| Cubans | 0.0 /100 | #304 | Tragic 6.8% |
| Haitians | 0.0 /100 | #305 | Tragic 6.8% |
| Immigrants | Haiti | 0.0 /100 | #306 | Tragic 7.0% |
| Guatemalans | 0.0 /100 | #307 | Tragic 7.0% |
| Spanish American Indians | 0.0 /100 | #308 | Tragic 7.1% |
| Hopi | 0.0 /100 | #309 | Tragic 7.1% |
| Immigrants | Nicaragua | 0.0 /100 | #310 | Tragic 7.1% |
| Immigrants | Dominica | 0.0 /100 | #311 | Tragic 7.1% |
| Immigrants | Armenia | 0.0 /100 | #312 | Tragic 7.1% |
| Immigrants | St. Vincent and the Grenadines | 0.0 /100 | #313 | Tragic 7.1% |