Immigrants from Portugal vs Immigrants from Nepal Married-Couple Family Poverty
COMPARE
Immigrants from Portugal
Immigrants from Nepal
Married-Couple Family Poverty
Married-Couple Family Poverty Comparison
Immigrants from Portugal
Immigrants from Nepal
5.0%
MARRIED-COUPLE FAMILY POVERTY
84.8/ 100
METRIC RATING
140th/ 347
METRIC RANK
4.7%
MARRIED-COUPLE FAMILY POVERTY
95.9/ 100
METRIC RATING
113th/ 347
METRIC RANK
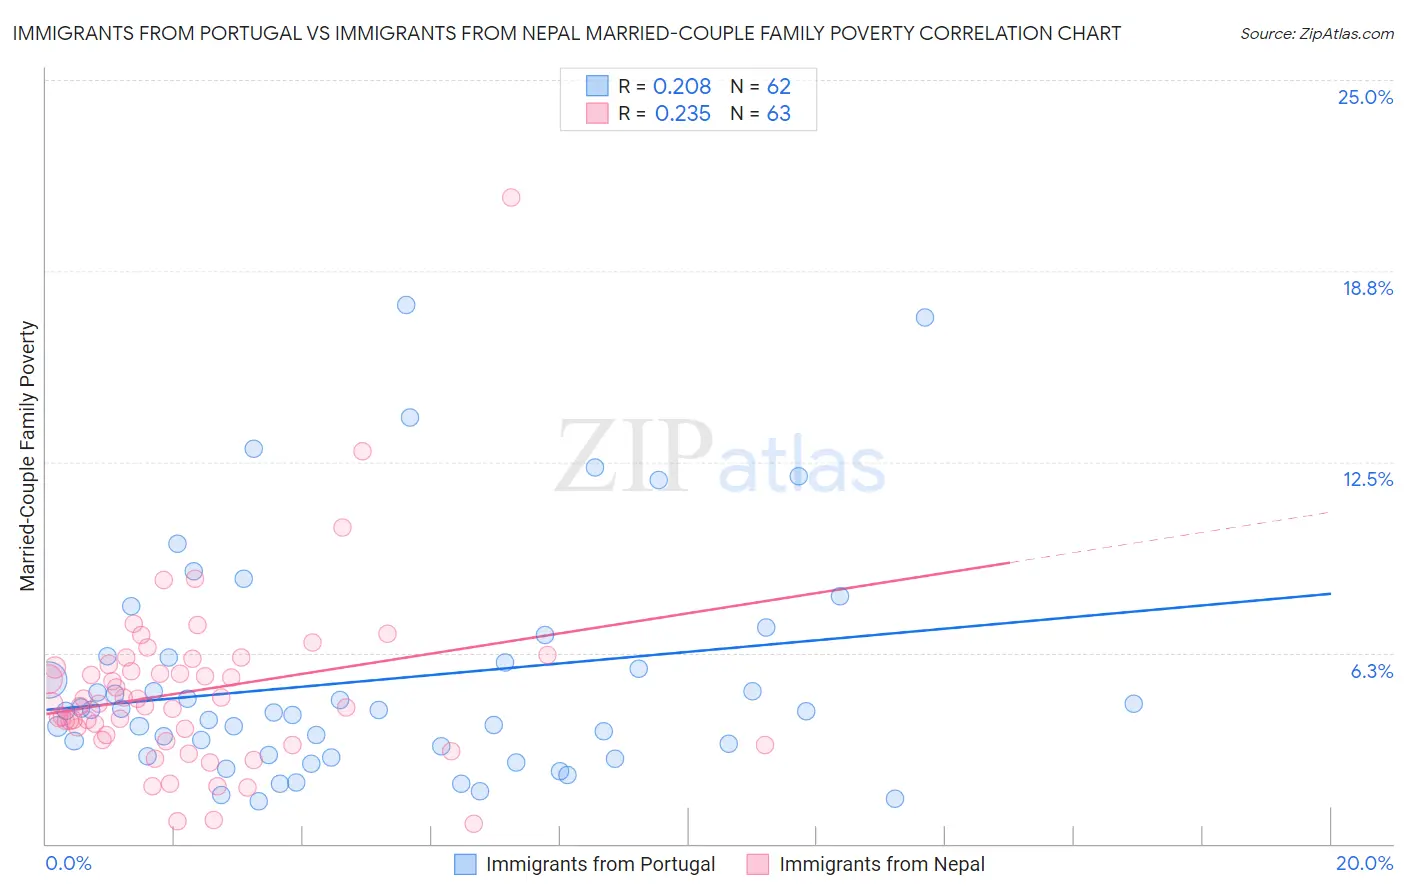
Immigrants from Portugal vs Immigrants from Nepal Married-Couple Family Poverty Correlation Chart
The statistical analysis conducted on geographies consisting of 173,825,666 people shows a weak positive correlation between the proportion of Immigrants from Portugal and poverty level among married-couple families in the United States with a correlation coefficient (R) of 0.208 and weighted average of 5.0%. Similarly, the statistical analysis conducted on geographies consisting of 185,979,517 people shows a weak positive correlation between the proportion of Immigrants from Nepal and poverty level among married-couple families in the United States with a correlation coefficient (R) of 0.235 and weighted average of 4.7%, a difference of 4.5%.
Married-Couple Family Poverty Correlation Summary
| Measurement | Immigrants from Portugal | Immigrants from Nepal |
| Minimum | 1.4% | 0.67% |
| Maximum | 17.6% | 21.1% |
| Range | 16.3% | 20.5% |
| Mean | 5.4% | 5.0% |
| Median | 4.3% | 4.6% |
| Interquartile 25% (IQ1) | 2.9% | 3.4% |
| Interquartile 75% (IQ3) | 6.1% | 5.9% |
| Interquartile Range (IQR) | 3.2% | 2.5% |
| Standard Deviation (Sample) | 3.7% | 3.0% |
| Standard Deviation (Population) | 3.7% | 3.0% |
Similar Demographics by Married-Couple Family Poverty
Demographics Similar to Immigrants from Portugal by Married-Couple Family Poverty
In terms of married-couple family poverty, the demographic groups most similar to Immigrants from Portugal are Immigrants from Brazil (5.0%, a difference of 0.050%), Immigrants from China (5.0%, a difference of 0.050%), German Russian (5.0%, a difference of 0.060%), Chilean (4.9%, a difference of 0.29%), and Immigrants from Egypt (5.0%, a difference of 0.32%).
| Demographics | Rating | Rank | Married-Couple Family Poverty |
| Immigrants | Kenya | 90.2 /100 | #133 | Exceptional 4.9% |
| Samoans | 90.2 /100 | #134 | Exceptional 4.9% |
| Assyrians/Chaldeans/Syriacs | 89.4 /100 | #135 | Excellent 4.9% |
| Immigrants | Hungary | 88.7 /100 | #136 | Excellent 4.9% |
| Guamanians/Chamorros | 86.5 /100 | #137 | Excellent 4.9% |
| Chileans | 86.0 /100 | #138 | Excellent 4.9% |
| German Russians | 85.1 /100 | #139 | Excellent 5.0% |
| Immigrants | Portugal | 84.8 /100 | #140 | Excellent 5.0% |
| Immigrants | Brazil | 84.6 /100 | #141 | Excellent 5.0% |
| Immigrants | China | 84.6 /100 | #142 | Excellent 5.0% |
| Immigrants | Egypt | 83.4 /100 | #143 | Excellent 5.0% |
| Hmong | 83.2 /100 | #144 | Excellent 5.0% |
| Immigrants | Spain | 79.9 /100 | #145 | Good 5.0% |
| Mongolians | 79.8 /100 | #146 | Good 5.0% |
| Syrians | 78.7 /100 | #147 | Good 5.0% |
Demographics Similar to Immigrants from Nepal by Married-Couple Family Poverty
In terms of married-couple family poverty, the demographic groups most similar to Immigrants from Nepal are Tongan (4.7%, a difference of 0.070%), Pakistani (4.7%, a difference of 0.25%), Immigrants from Bolivia (4.7%, a difference of 0.29%), Immigrants from Hong Kong (4.7%, a difference of 0.45%), and Immigrants from Indonesia (4.8%, a difference of 0.58%).
| Demographics | Rating | Rank | Married-Couple Family Poverty |
| Immigrants | France | 96.9 /100 | #106 | Exceptional 4.7% |
| Immigrants | Germany | 96.8 /100 | #107 | Exceptional 4.7% |
| Laotians | 96.6 /100 | #108 | Exceptional 4.7% |
| Immigrants | Hong Kong | 96.4 /100 | #109 | Exceptional 4.7% |
| Immigrants | Bolivia | 96.2 /100 | #110 | Exceptional 4.7% |
| Pakistanis | 96.2 /100 | #111 | Exceptional 4.7% |
| Tongans | 95.9 /100 | #112 | Exceptional 4.7% |
| Immigrants | Nepal | 95.9 /100 | #113 | Exceptional 4.7% |
| Immigrants | Indonesia | 95.1 /100 | #114 | Exceptional 4.8% |
| Taiwanese | 94.8 /100 | #115 | Exceptional 4.8% |
| Celtics | 94.8 /100 | #116 | Exceptional 4.8% |
| Kenyans | 94.7 /100 | #117 | Exceptional 4.8% |
| Immigrants | Philippines | 94.6 /100 | #118 | Exceptional 4.8% |
| Immigrants | Eastern Asia | 94.0 /100 | #119 | Exceptional 4.8% |
| Immigrants | Southern Europe | 93.4 /100 | #120 | Exceptional 4.8% |