Immigrants from Croatia 4 or more Vehicles in Household
COMPARE
Immigrants from Croatia
Select to Compare
4 or more Vehicles in Household
Immigrants from Croatia 4 or more Vehicles in Household
5.4%
4+ VEHICLES AVAILABLE
0.2/ 100
METRIC RATING
287th/ 347
METRIC RANK
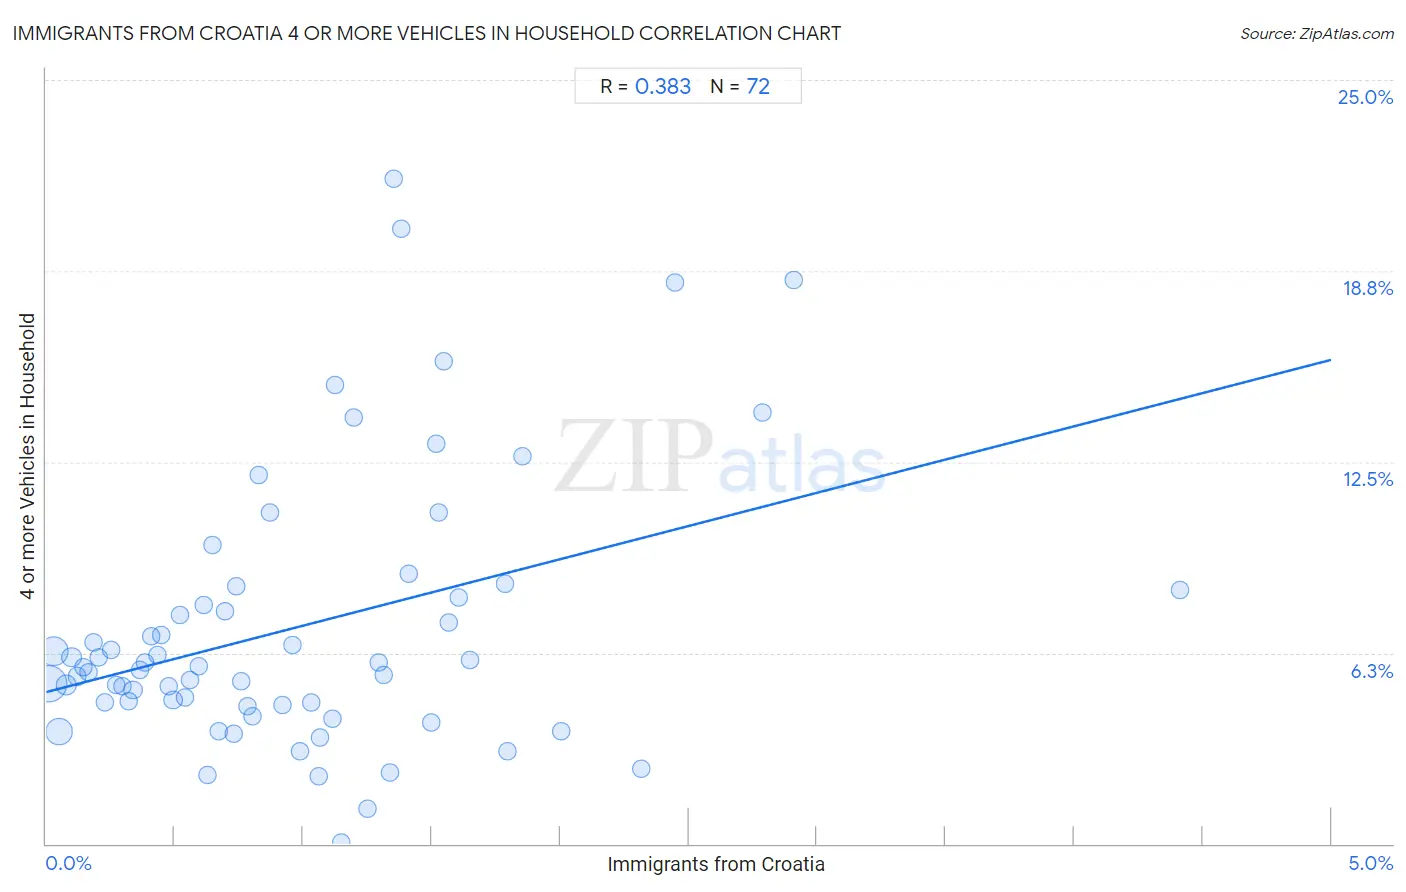
Immigrants from Croatia 4 or more Vehicles in Household Correlation Chart
The statistical analysis conducted on geographies consisting of 131,979,110 people shows a mild positive correlation between the proportion of Immigrants from Croatia and percentage of households with 4 or more vehicles available in the United States with a correlation coefficient (R) of 0.383 and weighted average of 5.4%. On average, for every 1% (one percent) increase in Immigrants from Croatia within a typical geography, there is an increase of 2.2% in percentage of households with 4 or more vehicles available.
It is essential to understand that the correlation between the percentage of Immigrants from Croatia and percentage of households with 4 or more vehicles available does not imply a direct cause-and-effect relationship. It remains uncertain whether the presence of Immigrants from Croatia influences an upward or downward trend in the level of percentage of households with 4 or more vehicles available within an area, or if Immigrants from Croatia simply ended up residing in those areas with higher or lower levels of percentage of households with 4 or more vehicles available due to other factors.
Demographics Similar to Immigrants from Croatia by 4 or more Vehicles in Household
In terms of 4 or more vehicles in household, the demographic groups most similar to Immigrants from Croatia are Immigrants from Colombia (5.4%, a difference of 0.10%), Immigrants from Liberia (5.4%, a difference of 0.13%), Venezuelan (5.3%, a difference of 0.19%), Immigrants from Bosnia and Herzegovina (5.3%, a difference of 0.33%), and Brazilian (5.4%, a difference of 0.47%).
| Demographics | Rating | Rank | 4 or more Vehicles in Household |
| Alsatians | 0.3 /100 | #280 | Tragic 5.4% |
| Immigrants from Western Africa | 0.3 /100 | #281 | Tragic 5.4% |
| Immigrants from Spain | 0.3 /100 | #282 | Tragic 5.4% |
| Immigrants from Ireland | 0.3 /100 | #283 | Tragic 5.4% |
| Brazilians | 0.3 /100 | #284 | Tragic 5.4% |
| Immigrants from Liberia | 0.2 /100 | #285 | Tragic 5.4% |
| Immigrants from Colombia | 0.2 /100 | #286 | Tragic 5.4% |
| Immigrants from Croatia | 0.2 /100 | #287 | Tragic 5.4% |
| Venezuelans | 0.2 /100 | #288 | Tragic 5.3% |
| Immigrants from Bosnia and Herzegovina | 0.2 /100 | #289 | Tragic 5.3% |
| Immigrants from Russia | 0.2 /100 | #290 | Tragic 5.3% |
| Immigrants from Bahamas | 0.1 /100 | #291 | Tragic 5.3% |
| Liberians | 0.1 /100 | #292 | Tragic 5.3% |
| Immigrants from Congo | 0.1 /100 | #293 | Tragic 5.2% |
| Ghanaians | 0.1 /100 | #294 | Tragic 5.2% |
Immigrants from Croatia 4 or more Vehicles in Household Correlation Summary
| Measurement | Immigrants from Croatia Data | 4 or more Vehicles in Household Data |
| Minimum | 0.010% | 0.039% |
| Maximum | 4.4% | 21.8% |
| Range | 4.4% | 21.7% |
| Mean | 0.97% | 7.1% |
| Median | 0.79% | 5.8% |
| Interquartile 25% (IQ1) | 0.40% | 4.6% |
| Interquartile 75% (IQ3) | 1.4% | 8.2% |
| Interquartile Range (IQR) | 0.97% | 3.6% |
| Standard Deviation (Sample) | 0.78% | 4.4% |
| Standard Deviation (Population) | 0.78% | 4.4% |
Correlation Details
| Immigrants from Croatia Percentile | Sample Size | 4 or more Vehicles in Household |
[ 0.0% - 0.5% ] 0.010% | 53,108,177 | 5.2% |
[ 0.0% - 0.5% ] 0.031% | 32,156,641 | 6.3% |
[ 0.0% - 0.5% ] 0.049% | 22,841,552 | 3.7% |
[ 0.0% - 0.5% ] 0.077% | 6,880,267 | 5.2% |
[ 0.0% - 0.5% ] 0.098% | 5,198,033 | 6.1% |
[ 0.0% - 0.5% ] 0.12% | 2,363,585 | 5.5% |
[ 0.0% - 0.5% ] 0.14% | 1,611,193 | 5.8% |
[ 0.0% - 0.5% ] 0.16% | 1,325,015 | 5.6% |
[ 0.0% - 0.5% ] 0.19% | 1,101,802 | 6.6% |
[ 0.0% - 0.5% ] 0.21% | 545,986 | 6.1% |
[ 0.0% - 0.5% ] 0.23% | 748,719 | 4.6% |
[ 0.0% - 0.5% ] 0.25% | 589,204 | 6.3% |
[ 0.0% - 0.5% ] 0.27% | 483,070 | 5.2% |
[ 0.0% - 0.5% ] 0.30% | 341,651 | 5.1% |
[ 0.0% - 0.5% ] 0.32% | 227,065 | 4.7% |
[ 0.0% - 0.5% ] 0.34% | 318,546 | 5.0% |
[ 0.0% - 0.5% ] 0.36% | 196,817 | 5.7% |
[ 0.0% - 0.5% ] 0.39% | 208,826 | 5.9% |
[ 0.0% - 0.5% ] 0.41% | 65,108 | 6.8% |
[ 0.0% - 0.5% ] 0.43% | 159,676 | 6.2% |
[ 0.0% - 0.5% ] 0.45% | 134,019 | 6.8% |
[ 0.0% - 0.5% ] 0.48% | 119,493 | 5.2% |
[ 0.0% - 0.5% ] 0.49% | 164,910 | 4.7% |
[ 0.5% - 1.0% ] 0.52% | 76,494 | 7.5% |
[ 0.5% - 1.0% ] 0.54% | 40,579 | 4.8% |
[ 0.5% - 1.0% ] 0.56% | 83,552 | 5.4% |
[ 0.5% - 1.0% ] 0.59% | 80,692 | 5.8% |
[ 0.5% - 1.0% ] 0.61% | 14,359 | 7.8% |
[ 0.5% - 1.0% ] 0.63% | 85,507 | 2.2% |
[ 0.5% - 1.0% ] 0.65% | 30,057 | 9.8% |
[ 0.5% - 1.0% ] 0.67% | 56,899 | 3.7% |
[ 0.5% - 1.0% ] 0.70% | 38,116 | 7.6% |
[ 0.5% - 1.0% ] 0.73% | 4,536 | 3.6% |
[ 0.5% - 1.0% ] 0.74% | 6,785 | 8.4% |
[ 0.5% - 1.0% ] 0.76% | 47,950 | 5.3% |
[ 0.5% - 1.0% ] 0.78% | 62,467 | 4.5% |
[ 0.5% - 1.0% ] 0.80% | 9,073 | 4.2% |
[ 0.5% - 1.0% ] 0.83% | 31,458 | 12.1% |
[ 0.5% - 1.0% ] 0.87% | 44,359 | 10.8% |
[ 0.5% - 1.0% ] 0.92% | 35,889 | 4.5% |
[ 0.5% - 1.0% ] 0.96% | 18,821 | 6.5% |
[ 0.5% - 1.0% ] 0.99% | 8,820 | 3.0% |
[ 1.0% - 1.5% ] 1.03% | 486 | 4.6% |
[ 1.0% - 1.5% ] 1.06% | 945 | 2.2% |
[ 1.0% - 1.5% ] 1.06% | 470 | 3.5% |
[ 1.0% - 1.5% ] 1.11% | 18,166 | 4.1% |
[ 1.0% - 1.5% ] 1.13% | 3,999 | 15.0% |
[ 1.0% - 1.5% ] 1.15% | 34,752 | 0.039% |
[ 1.0% - 1.5% ] 1.20% | 1,254 | 14.0% |
[ 1.0% - 1.5% ] 1.25% | 38,209 | 1.2% |
[ 1.0% - 1.5% ] 1.29% | 5,496 | 5.9% |
[ 1.0% - 1.5% ] 1.31% | 70,431 | 5.5% |
[ 1.0% - 1.5% ] 1.34% | 18,141 | 2.3% |
[ 1.0% - 1.5% ] 1.35% | 2,444 | 21.8% |
[ 1.0% - 1.5% ] 1.38% | 362 | 20.1% |
[ 1.0% - 1.5% ] 1.41% | 8,801 | 8.8% |
[ 1.0% - 1.5% ] 1.50% | 2,739 | 4.0% |
[ 1.5% - 2.0% ] 1.52% | 330 | 13.1% |
[ 1.5% - 2.0% ] 1.53% | 1,374 | 10.9% |
[ 1.5% - 2.0% ] 1.55% | 1,875 | 15.8% |
[ 1.5% - 2.0% ] 1.57% | 24,440 | 7.3% |
[ 1.5% - 2.0% ] 1.60% | 811 | 8.1% |
[ 1.5% - 2.0% ] 1.65% | 910 | 6.0% |
[ 1.5% - 2.0% ] 1.78% | 8,804 | 8.5% |
[ 1.5% - 2.0% ] 1.79% | 20,401 | 3.0% |
[ 1.5% - 2.0% ] 1.85% | 6,914 | 12.7% |
[ 2.0% - 2.5% ] 2.00% | 6,590 | 3.7% |
[ 2.0% - 2.5% ] 2.32% | 29,870 | 2.5% |
[ 2.0% - 2.5% ] 2.45% | 286 | 18.4% |
[ 2.5% - 3.0% ] 2.78% | 2,442 | 14.1% |
[ 2.5% - 3.0% ] 2.91% | 172 | 18.5% |
[ 4.0% - 4.5% ] 4.41% | 1,428 | 8.3% |