Immigrants from Croatia Disability Age 5 to 17
COMPARE
Immigrants from Croatia
Select to Compare
Disability Age 5 to 17
Immigrants from Croatia Disability Age 5 to 17
5.2%
DISABILITY | AGE 5 TO 17
99.4/ 100
METRIC RATING
88th/ 347
METRIC RANK
Immigrants from Croatia Disability Age 5 to 17 Correlation Chart
The statistical analysis conducted on geographies consisting of 132,210,696 people shows no correlation between the proportion of Immigrants from Croatia and percentage of population with a disability between the ages 5 and 17 in the United States with a correlation coefficient (R) of 0.047 and weighted average of 5.2%. On average, for every 1% (one percent) increase in Immigrants from Croatia within a typical geography, there is an increase of 0.15% in percentage of population with a disability between the ages 5 and 17.
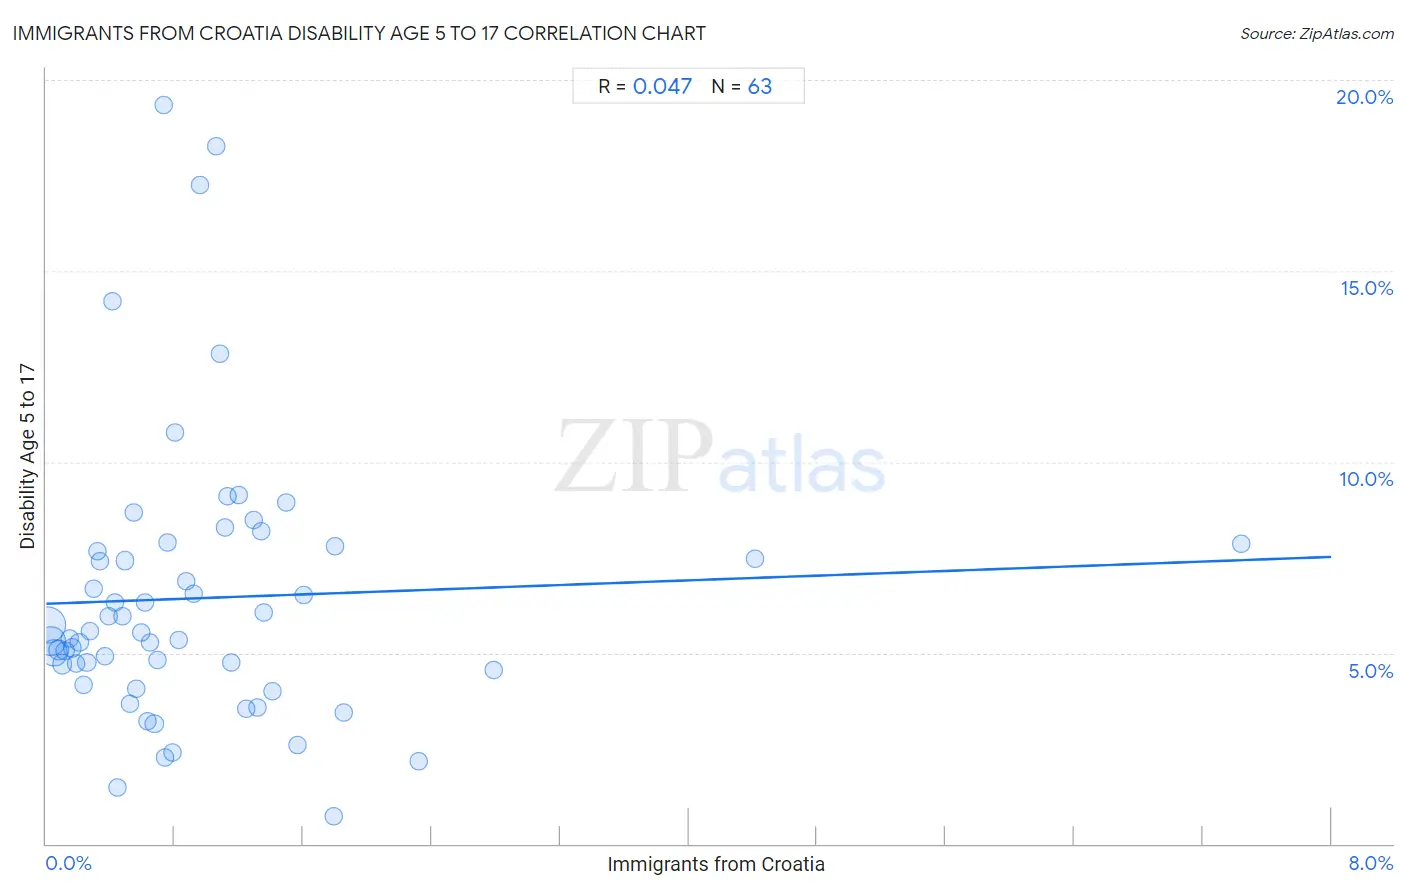
It is essential to understand that the correlation between the percentage of Immigrants from Croatia and percentage of population with a disability between the ages 5 and 17 does not imply a direct cause-and-effect relationship. It remains uncertain whether the presence of Immigrants from Croatia influences an upward or downward trend in the level of percentage of population with a disability between the ages 5 and 17 within an area, or if Immigrants from Croatia simply ended up residing in those areas with higher or lower levels of percentage of population with a disability between the ages 5 and 17 due to other factors.
Demographics Similar to Immigrants from Croatia by Disability Age 5 to 17
In terms of disability age 5 to 17, the demographic groups most similar to Immigrants from Croatia are Immigrants from Spain (5.2%, a difference of 0.0%), Eastern European (5.2%, a difference of 0.030%), Immigrants from Kuwait (5.3%, a difference of 0.050%), Immigrants from St. Vincent and the Grenadines (5.2%, a difference of 0.070%), and Bulgarian (5.2%, a difference of 0.12%).
| Demographics | Rating | Rank | Disability Age 5 to 17 |
| Native Hawaiians | 99.6 /100 | #81 | Exceptional 5.2% |
| Immigrants from Sweden | 99.5 /100 | #82 | Exceptional 5.2% |
| Immigrants from France | 99.5 /100 | #83 | Exceptional 5.2% |
| Immigrants from Nicaragua | 99.5 /100 | #84 | Exceptional 5.2% |
| Bulgarians | 99.4 /100 | #85 | Exceptional 5.2% |
| Immigrants from St. Vincent and the Grenadines | 99.4 /100 | #86 | Exceptional 5.2% |
| Eastern Europeans | 99.4 /100 | #87 | Exceptional 5.2% |
| Immigrants from Croatia | 99.4 /100 | #88 | Exceptional 5.2% |
| Immigrants from Spain | 99.4 /100 | #89 | Exceptional 5.2% |
| Immigrants from Kuwait | 99.4 /100 | #90 | Exceptional 5.3% |
| Mongolians | 99.2 /100 | #91 | Exceptional 5.3% |
| Luxembourgers | 99.2 /100 | #92 | Exceptional 5.3% |
| Immigrants from Peru | 99.1 /100 | #93 | Exceptional 5.3% |
| Immigrants from Jordan | 99.1 /100 | #94 | Exceptional 5.3% |
| Immigrants from Grenada | 99.1 /100 | #95 | Exceptional 5.3% |
Immigrants from Croatia Disability Age 5 to 17 Correlation Summary
| Measurement | Immigrants from Croatia Data | Disability Age 5 to 17 Data |
| Minimum | 0.010% | 0.71% |
| Maximum | 7.4% | 19.4% |
| Range | 7.4% | 18.6% |
| Mean | 0.96% | 6.4% |
| Median | 0.70% | 5.5% |
| Interquartile 25% (IQ1) | 0.34% | 4.5% |
| Interquartile 75% (IQ3) | 1.2% | 7.8% |
| Interquartile Range (IQR) | 0.91% | 3.3% |
| Standard Deviation (Sample) | 1.1% | 3.6% |
| Standard Deviation (Population) | 1.1% | 3.6% |
Correlation Details
| Immigrants from Croatia Percentile | Sample Size | Disability Age 5 to 17 |
[ 0.0% - 0.5% ] 0.010% | 53,204,168 | 5.7% |
[ 0.0% - 0.5% ] 0.031% | 32,208,508 | 5.3% |
[ 0.0% - 0.5% ] 0.049% | 22,835,558 | 5.0% |
[ 0.0% - 0.5% ] 0.077% | 6,916,427 | 5.1% |
[ 0.0% - 0.5% ] 0.098% | 5,239,819 | 4.7% |
[ 0.0% - 0.5% ] 0.12% | 2,509,356 | 5.1% |
[ 0.0% - 0.5% ] 0.14% | 1,621,763 | 5.4% |
[ 0.0% - 0.5% ] 0.16% | 1,318,237 | 5.1% |
[ 0.0% - 0.5% ] 0.19% | 1,082,513 | 4.7% |
[ 0.0% - 0.5% ] 0.21% | 522,671 | 5.3% |
[ 0.0% - 0.5% ] 0.23% | 734,759 | 4.2% |
[ 0.0% - 0.5% ] 0.25% | 589,204 | 4.7% |
[ 0.0% - 0.5% ] 0.27% | 459,925 | 5.6% |
[ 0.0% - 0.5% ] 0.30% | 333,069 | 6.7% |
[ 0.0% - 0.5% ] 0.32% | 218,511 | 7.7% |
[ 0.0% - 0.5% ] 0.34% | 318,257 | 7.4% |
[ 0.0% - 0.5% ] 0.36% | 185,250 | 4.9% |
[ 0.0% - 0.5% ] 0.39% | 205,927 | 5.9% |
[ 0.0% - 0.5% ] 0.41% | 65,108 | 14.2% |
[ 0.0% - 0.5% ] 0.43% | 159,676 | 6.3% |
[ 0.0% - 0.5% ] 0.45% | 134,222 | 1.5% |
[ 0.0% - 0.5% ] 0.48% | 116,806 | 5.9% |
[ 0.0% - 0.5% ] 0.49% | 164,910 | 7.4% |
[ 0.5% - 1.0% ] 0.52% | 77,634 | 3.7% |
[ 0.5% - 1.0% ] 0.54% | 39,655 | 8.7% |
[ 0.5% - 1.0% ] 0.56% | 80,001 | 4.1% |
[ 0.5% - 1.0% ] 0.59% | 73,738 | 5.5% |
[ 0.5% - 1.0% ] 0.61% | 12,543 | 6.3% |
[ 0.5% - 1.0% ] 0.63% | 84,147 | 3.2% |
[ 0.5% - 1.0% ] 0.65% | 24,992 | 5.3% |
[ 0.5% - 1.0% ] 0.67% | 56,899 | 3.1% |
[ 0.5% - 1.0% ] 0.70% | 36,537 | 4.8% |
[ 0.5% - 1.0% ] 0.73% | 687 | 19.4% |
[ 0.5% - 1.0% ] 0.74% | 6,785 | 2.3% |
[ 0.5% - 1.0% ] 0.76% | 46,394 | 7.9% |
[ 0.5% - 1.0% ] 0.78% | 62,212 | 2.4% |
[ 0.5% - 1.0% ] 0.80% | 7,713 | 10.8% |
[ 0.5% - 1.0% ] 0.83% | 31,458 | 5.3% |
[ 0.5% - 1.0% ] 0.87% | 50,849 | 6.9% |
[ 0.5% - 1.0% ] 0.92% | 35,889 | 6.5% |
[ 0.5% - 1.0% ] 0.96% | 18,821 | 17.2% |
[ 1.0% - 1.5% ] 1.06% | 945 | 18.3% |
[ 1.0% - 1.5% ] 1.08% | 3,966 | 12.8% |
[ 1.0% - 1.5% ] 1.11% | 17,625 | 8.3% |
[ 1.0% - 1.5% ] 1.13% | 3,999 | 9.1% |
[ 1.0% - 1.5% ] 1.15% | 34,752 | 4.8% |
[ 1.0% - 1.5% ] 1.20% | 1,254 | 9.1% |
[ 1.0% - 1.5% ] 1.25% | 37,647 | 3.5% |
[ 1.0% - 1.5% ] 1.29% | 5,496 | 8.5% |
[ 1.0% - 1.5% ] 1.31% | 70,431 | 3.6% |
[ 1.0% - 1.5% ] 1.34% | 34,539 | 8.2% |
[ 1.0% - 1.5% ] 1.35% | 2,444 | 6.0% |
[ 1.0% - 1.5% ] 1.41% | 8,801 | 4.0% |
[ 1.0% - 1.5% ] 1.50% | 2,739 | 8.9% |
[ 1.5% - 2.0% ] 1.57% | 24,440 | 2.6% |
[ 1.5% - 2.0% ] 1.60% | 811 | 6.5% |
[ 1.5% - 2.0% ] 1.79% | 7,388 | 0.71% |
[ 1.5% - 2.0% ] 1.79% | 20,401 | 7.8% |
[ 1.5% - 2.0% ] 1.85% | 6,914 | 3.4% |
[ 2.0% - 2.5% ] 2.32% | 29,870 | 2.1% |
[ 2.5% - 3.0% ] 2.78% | 2,442 | 4.5% |
[ 4.0% - 4.5% ] 4.41% | 1,428 | 7.5% |
[ 7.0% - 7.5% ] 7.44% | 766 | 7.8% |