Guyanese Disability Age 5 to 17
COMPARE
Guyanese
Select to Compare
Disability Age 5 to 17
Guyanese Disability Age 5 to 17
5.2%
DISABILITY | AGE 5 TO 17
99.7/ 100
METRIC RATING
69th/ 347
METRIC RANK
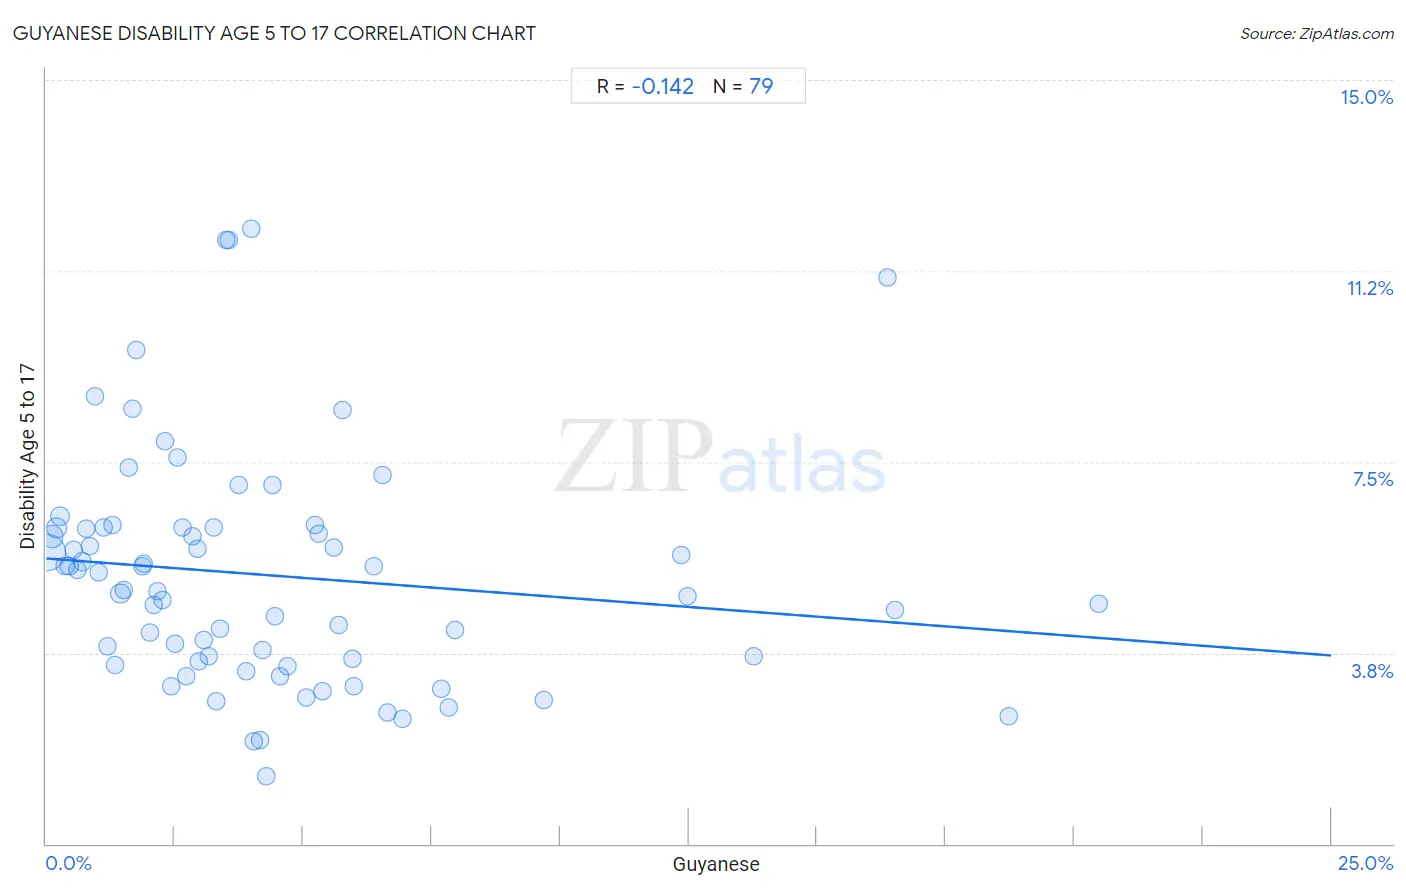
Guyanese Disability Age 5 to 17 Correlation Chart
The statistical analysis conducted on geographies consisting of 176,238,096 people shows a poor negative correlation between the proportion of Guyanese and percentage of population with a disability between the ages 5 and 17 in the United States with a correlation coefficient (R) of -0.142 and weighted average of 5.2%. On average, for every 1% (one percent) increase in Guyanese within a typical geography, there is a decrease of 0.076% in percentage of population with a disability between the ages 5 and 17.
It is essential to understand that the correlation between the percentage of Guyanese and percentage of population with a disability between the ages 5 and 17 does not imply a direct cause-and-effect relationship. It remains uncertain whether the presence of Guyanese influences an upward or downward trend in the level of percentage of population with a disability between the ages 5 and 17 within an area, or if Guyanese simply ended up residing in those areas with higher or lower levels of percentage of population with a disability between the ages 5 and 17 due to other factors.
Demographics Similar to Guyanese by Disability Age 5 to 17
In terms of disability age 5 to 17, the demographic groups most similar to Guyanese are Immigrants from Belgium (5.2%, a difference of 0.040%), Jordanian (5.2%, a difference of 0.080%), Immigrants from Syria (5.2%, a difference of 0.11%), Immigrants from Vietnam (5.2%, a difference of 0.11%), and Immigrants from Czechoslovakia (5.2%, a difference of 0.13%).
| Demographics | Rating | Rank | Disability Age 5 to 17 |
| Immigrants from Ireland | 99.8 /100 | #62 | Exceptional 5.2% |
| Immigrants from Bangladesh | 99.8 /100 | #63 | Exceptional 5.2% |
| Immigrants from South Eastern Asia | 99.8 /100 | #64 | Exceptional 5.2% |
| Immigrants from Greece | 99.8 /100 | #65 | Exceptional 5.2% |
| Palestinians | 99.8 /100 | #66 | Exceptional 5.2% |
| Macedonians | 99.8 /100 | #67 | Exceptional 5.2% |
| Immigrants from Syria | 99.7 /100 | #68 | Exceptional 5.2% |
| Guyanese | 99.7 /100 | #69 | Exceptional 5.2% |
| Immigrants from Belgium | 99.7 /100 | #70 | Exceptional 5.2% |
| Jordanians | 99.7 /100 | #71 | Exceptional 5.2% |
| Immigrants from Vietnam | 99.7 /100 | #72 | Exceptional 5.2% |
| Immigrants from Czechoslovakia | 99.7 /100 | #73 | Exceptional 5.2% |
| Immigrants from Romania | 99.7 /100 | #74 | Exceptional 5.2% |
| Immigrants from Moldova | 99.6 /100 | #75 | Exceptional 5.2% |
| Immigrants from Guyana | 99.6 /100 | #76 | Exceptional 5.2% |
Guyanese Disability Age 5 to 17 Correlation Summary
| Measurement | Guyanese Data | Disability Age 5 to 17 Data |
| Minimum | 0.028% | 1.3% |
| Maximum | 20.5% | 12.1% |
| Range | 20.5% | 10.8% |
| Mean | 4.4% | 5.3% |
| Median | 3.3% | 5.0% |
| Interquartile 25% (IQ1) | 1.6% | 3.6% |
| Interquartile 75% (IQ3) | 5.6% | 6.2% |
| Interquartile Range (IQR) | 4.0% | 2.6% |
| Standard Deviation (Sample) | 4.3% | 2.3% |
| Standard Deviation (Population) | 4.2% | 2.3% |
Correlation Details
| Guyanese Percentile | Sample Size | Disability Age 5 to 17 |
[ 0.0% - 0.5% ] 0.028% | 105,439,002 | 5.7% |
[ 0.0% - 0.5% ] 0.12% | 24,546,251 | 6.0% |
[ 0.0% - 0.5% ] 0.20% | 10,408,365 | 6.2% |
[ 0.0% - 0.5% ] 0.28% | 7,178,163 | 6.4% |
[ 0.0% - 0.5% ] 0.37% | 3,877,698 | 5.5% |
[ 0.0% - 0.5% ] 0.45% | 2,738,855 | 5.5% |
[ 0.5% - 1.0% ] 0.53% | 1,907,523 | 5.8% |
[ 0.5% - 1.0% ] 0.61% | 1,367,922 | 5.4% |
[ 0.5% - 1.0% ] 0.71% | 1,718,012 | 5.5% |
[ 0.5% - 1.0% ] 0.79% | 791,625 | 6.2% |
[ 0.5% - 1.0% ] 0.86% | 1,623,118 | 5.8% |
[ 0.5% - 1.0% ] 0.94% | 257,644 | 8.8% |
[ 1.0% - 1.5% ] 1.02% | 716,388 | 5.3% |
[ 1.0% - 1.5% ] 1.11% | 330,443 | 6.2% |
[ 1.0% - 1.5% ] 1.18% | 200,551 | 3.9% |
[ 1.0% - 1.5% ] 1.28% | 162,038 | 6.3% |
[ 1.0% - 1.5% ] 1.34% | 215,349 | 3.5% |
[ 1.0% - 1.5% ] 1.44% | 9,086,289 | 4.9% |
[ 1.5% - 2.0% ] 1.51% | 84,339 | 5.0% |
[ 1.5% - 2.0% ] 1.60% | 84,325 | 7.4% |
[ 1.5% - 2.0% ] 1.68% | 130,055 | 8.5% |
[ 1.5% - 2.0% ] 1.76% | 129,537 | 9.7% |
[ 1.5% - 2.0% ] 1.87% | 85,399 | 5.5% |
[ 1.5% - 2.0% ] 1.91% | 143,392 | 5.5% |
[ 2.0% - 2.5% ] 2.01% | 25,504 | 4.1% |
[ 2.0% - 2.5% ] 2.09% | 152,542 | 4.7% |
[ 2.0% - 2.5% ] 2.16% | 35,059 | 5.0% |
[ 2.0% - 2.5% ] 2.26% | 101,567 | 4.8% |
[ 2.0% - 2.5% ] 2.32% | 38,015 | 7.9% |
[ 2.0% - 2.5% ] 2.43% | 51,277 | 3.1% |
[ 2.5% - 3.0% ] 2.51% | 22,745 | 3.9% |
[ 2.5% - 3.0% ] 2.56% | 112,496 | 7.6% |
[ 2.5% - 3.0% ] 2.66% | 4,665 | 6.2% |
[ 2.5% - 3.0% ] 2.72% | 87,004 | 3.3% |
[ 2.5% - 3.0% ] 2.83% | 101,103 | 6.0% |
[ 2.5% - 3.0% ] 2.93% | 180,896 | 5.8% |
[ 2.5% - 3.0% ] 2.97% | 44,140 | 3.6% |
[ 3.0% - 3.5% ] 3.07% | 101,895 | 4.0% |
[ 3.0% - 3.5% ] 3.15% | 71,908 | 3.7% |
[ 3.0% - 3.5% ] 3.26% | 66,771 | 6.2% |
[ 3.0% - 3.5% ] 3.31% | 41,511 | 2.8% |
[ 3.0% - 3.5% ] 3.39% | 60,268 | 4.2% |
[ 3.5% - 4.0% ] 3.51% | 4,783 | 11.9% |
[ 3.5% - 4.0% ] 3.55% | 4,734 | 11.9% |
[ 3.5% - 4.0% ] 3.75% | 118,386 | 7.0% |
[ 3.5% - 4.0% ] 3.89% | 156,163 | 3.4% |
[ 3.5% - 4.0% ] 3.98% | 72,273 | 12.1% |
[ 4.0% - 4.5% ] 4.04% | 7,284 | 2.0% |
[ 4.0% - 4.5% ] 4.17% | 3,457 | 2.0% |
[ 4.0% - 4.5% ] 4.22% | 14,367 | 3.8% |
[ 4.0% - 4.5% ] 4.27% | 6,529 | 1.3% |
[ 4.0% - 4.5% ] 4.40% | 39,557 | 7.1% |
[ 4.0% - 4.5% ] 4.46% | 112,110 | 4.5% |
[ 4.5% - 5.0% ] 4.56% | 64,268 | 3.3% |
[ 4.5% - 5.0% ] 4.68% | 131,608 | 3.5% |
[ 5.0% - 5.5% ] 5.05% | 137,948 | 2.9% |
[ 5.0% - 5.5% ] 5.24% | 68,879 | 6.3% |
[ 5.0% - 5.5% ] 5.31% | 21,901 | 6.1% |
[ 5.0% - 5.5% ] 5.37% | 4,562 | 3.0% |
[ 5.5% - 6.0% ] 5.60% | 49,391 | 5.8% |
[ 5.5% - 6.0% ] 5.70% | 31,953 | 4.3% |
[ 5.5% - 6.0% ] 5.75% | 2,573 | 8.5% |
[ 5.5% - 6.0% ] 5.95% | 353 | 3.6% |
[ 5.5% - 6.0% ] 5.99% | 25,187 | 3.1% |
[ 6.0% - 6.5% ] 6.37% | 35,154 | 5.5% |
[ 6.5% - 7.0% ] 6.54% | 68,476 | 7.2% |
[ 6.5% - 7.0% ] 6.63% | 108,180 | 2.6% |
[ 6.5% - 7.0% ] 6.93% | 27,794 | 2.5% |
[ 7.5% - 8.0% ] 7.68% | 8,128 | 3.0% |
[ 7.5% - 8.0% ] 7.83% | 138,467 | 2.7% |
[ 7.5% - 8.0% ] 7.96% | 31,613 | 4.2% |
[ 9.5% - 10.0% ] 9.68% | 38,865 | 2.8% |
[ 12.0% - 12.5% ] 12.35% | 7,863 | 5.7% |
[ 12.0% - 12.5% ] 12.47% | 21,349 | 4.9% |
[ 13.5% - 14.0% ] 13.78% | 29,921 | 3.7% |
[ 16.0% - 16.5% ] 16.37% | 3,568 | 11.1% |
[ 16.5% - 17.0% ] 16.52% | 19,554 | 4.6% |
[ 18.5% - 19.0% ] 18.74% | 48,096 | 2.5% |
[ 20.0% - 20.5% ] 20.48% | 51,153 | 4.7% |