European Male Disability
COMPARE
European
Select to Compare
Male Disability
European Male Disability
12.1%
DISABILITY | MALES
0.3/ 100
METRIC RATING
257th/ 347
METRIC RANK
European Male Disability Correlation Chart
The statistical analysis conducted on geographies consisting of 561,596,268 people shows a moderate positive correlation between the proportion of Europeans and percentage of males with a disability in the United States with a correlation coefficient (R) of 0.404 and weighted average of 12.1%. On average, for every 1% (one percent) increase in Europeans within a typical geography, there is an increase of 0.27% in percentage of males with a disability.
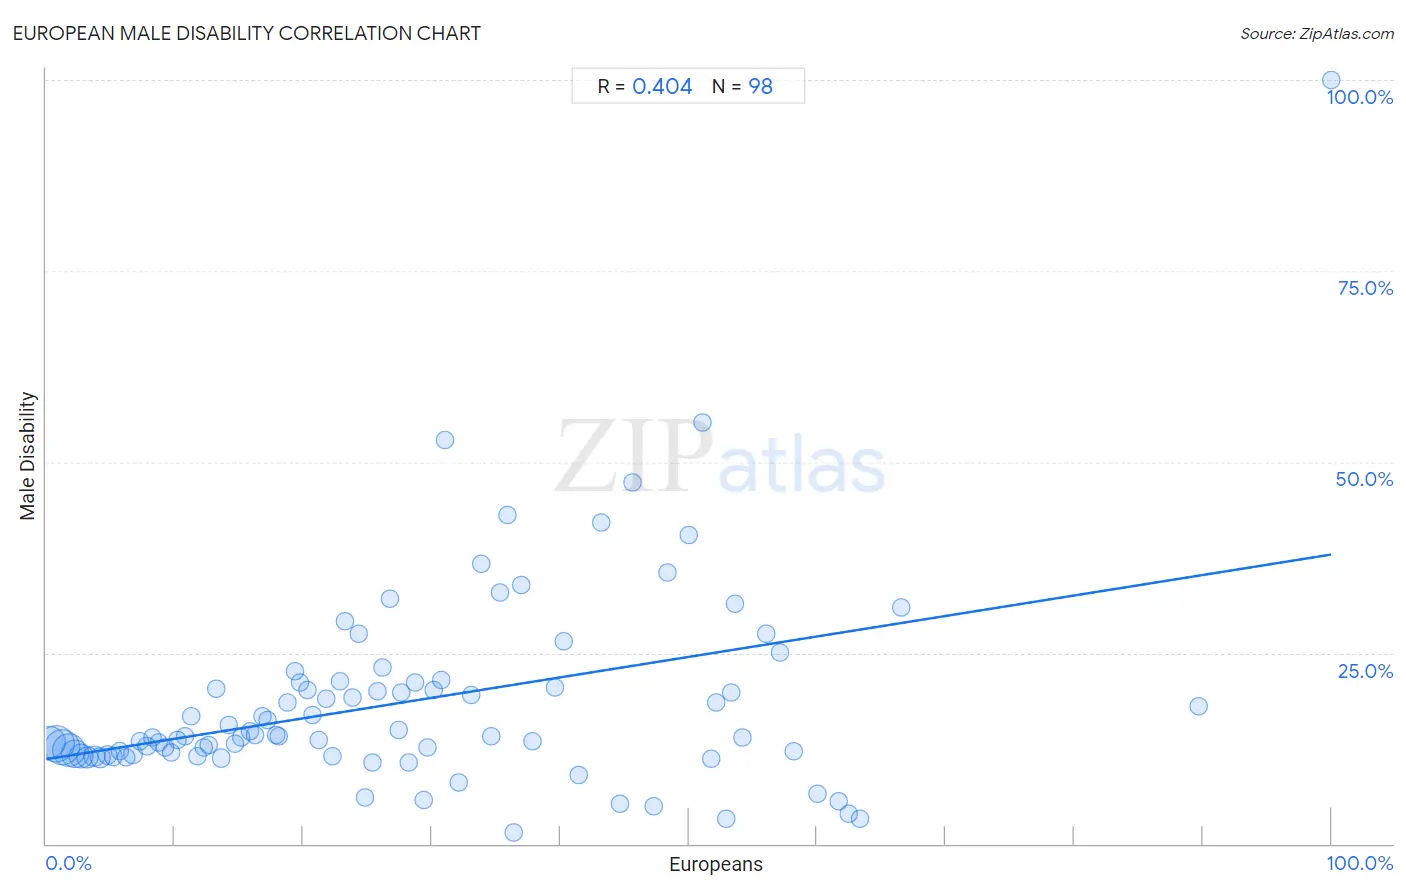
It is essential to understand that the correlation between the percentage of Europeans and percentage of males with a disability does not imply a direct cause-and-effect relationship. It remains uncertain whether the presence of Europeans influences an upward or downward trend in the level of percentage of males with a disability within an area, or if Europeans simply ended up residing in those areas with higher or lower levels of percentage of males with a disability due to other factors.
Demographics Similar to Europeans by Male Disability
In terms of male disability, the demographic groups most similar to Europeans are Swiss (12.1%, a difference of 0.0%), Basque (12.1%, a difference of 0.19%), Belgian (12.1%, a difference of 0.24%), Chinese (12.1%, a difference of 0.25%), and British (12.1%, a difference of 0.26%).
| Demographics | Rating | Rank | Male Disability |
| Bangladeshis | 0.5 /100 | #250 | Tragic 12.0% |
| German Russians | 0.5 /100 | #251 | Tragic 12.0% |
| Slovenes | 0.5 /100 | #252 | Tragic 12.0% |
| Guamanians/Chamorros | 0.5 /100 | #253 | Tragic 12.0% |
| British | 0.4 /100 | #254 | Tragic 12.1% |
| Chinese | 0.4 /100 | #255 | Tragic 12.1% |
| Swiss | 0.3 /100 | #256 | Tragic 12.1% |
| Europeans | 0.3 /100 | #257 | Tragic 12.1% |
| Basques | 0.3 /100 | #258 | Tragic 12.1% |
| Belgians | 0.3 /100 | #259 | Tragic 12.1% |
| Swedes | 0.3 /100 | #260 | Tragic 12.1% |
| Slavs | 0.2 /100 | #261 | Tragic 12.2% |
| Norwegians | 0.2 /100 | #262 | Tragic 12.2% |
| Canadians | 0.2 /100 | #263 | Tragic 12.2% |
| Nepalese | 0.2 /100 | #264 | Tragic 12.2% |
European Male Disability Correlation Summary
| Measurement | European Data | Male Disability Data |
| Minimum | 0.27% | 1.4% |
| Maximum | 100.0% | 100.0% |
| Range | 99.7% | 98.6% |
| Mean | 28.1% | 18.6% |
| Median | 24.6% | 14.0% |
| Interquartile 25% (IQ1) | 12.3% | 11.6% |
| Interquartile 75% (IQ3) | 40.3% | 21.1% |
| Interquartile Range (IQR) | 28.0% | 9.4% |
| Standard Deviation (Sample) | 20.2% | 13.4% |
| Standard Deviation (Population) | 20.1% | 13.3% |
Correlation Details
| European Percentile | Sample Size | Male Disability |
[ 0.0% - 0.5% ] 0.27% | 85,143,222 | 13.3% |
[ 0.5% - 1.0% ] 0.76% | 110,452,765 | 13.0% |
[ 1.0% - 1.5% ] 1.25% | 106,146,532 | 12.6% |
[ 1.5% - 2.0% ] 1.73% | 87,062,575 | 12.2% |
[ 2.0% - 2.5% ] 2.23% | 58,753,976 | 11.8% |
[ 2.5% - 3.0% ] 2.73% | 39,780,139 | 11.5% |
[ 3.0% - 3.5% ] 3.23% | 23,614,920 | 11.4% |
[ 3.5% - 4.0% ] 3.74% | 15,614,523 | 11.4% |
[ 4.0% - 4.5% ] 4.20% | 11,490,880 | 11.3% |
[ 4.5% - 5.0% ] 4.73% | 6,882,018 | 11.6% |
[ 5.0% - 5.5% ] 5.23% | 4,980,991 | 11.4% |
[ 5.5% - 6.0% ] 5.75% | 2,585,067 | 12.1% |
[ 6.0% - 6.5% ] 6.24% | 1,997,376 | 11.3% |
[ 6.5% - 7.0% ] 6.74% | 1,758,173 | 11.7% |
[ 7.0% - 7.5% ] 7.25% | 838,909 | 13.4% |
[ 7.5% - 8.0% ] 7.82% | 873,697 | 12.8% |
[ 8.0% - 8.5% ] 8.28% | 576,122 | 13.9% |
[ 8.5% - 9.0% ] 8.76% | 406,601 | 13.2% |
[ 9.0% - 9.5% ] 9.20% | 416,389 | 12.7% |
[ 9.5% - 10.0% ] 9.72% | 493,398 | 12.0% |
[ 10.0% - 10.5% ] 10.19% | 241,514 | 13.6% |
[ 10.5% - 11.0% ] 10.79% | 136,364 | 14.1% |
[ 11.0% - 11.5% ] 11.24% | 159,095 | 16.7% |
[ 11.5% - 12.0% ] 11.81% | 112,870 | 11.5% |
[ 12.0% - 12.5% ] 12.29% | 113,724 | 12.6% |
[ 12.5% - 13.0% ] 12.64% | 139,310 | 13.0% |
[ 13.0% - 13.5% ] 13.25% | 47,984 | 20.2% |
[ 13.5% - 14.0% ] 13.66% | 174,443 | 11.2% |
[ 14.0% - 14.5% ] 14.20% | 48,777 | 15.6% |
[ 14.5% - 15.0% ] 14.66% | 94,838 | 13.1% |
[ 15.0% - 15.5% ] 15.22% | 75,387 | 14.0% |
[ 15.5% - 16.0% ] 15.82% | 74,231 | 14.7% |
[ 16.0% - 16.5% ] 16.24% | 12,319 | 14.3% |
[ 16.5% - 17.0% ] 16.83% | 46,187 | 16.7% |
[ 17.0% - 17.5% ] 17.22% | 37,494 | 16.2% |
[ 17.5% - 18.0% ] 17.87% | 41,788 | 14.2% |
[ 18.0% - 18.5% ] 18.13% | 24,227 | 14.0% |
[ 18.5% - 19.0% ] 18.80% | 13,751 | 18.5% |
[ 19.0% - 19.5% ] 19.36% | 15,874 | 22.5% |
[ 19.5% - 20.0% ] 19.79% | 8,965 | 21.1% |
[ 20.0% - 20.5% ] 20.31% | 7,461 | 20.2% |
[ 20.5% - 21.0% ] 20.77% | 5,778 | 16.8% |
[ 21.0% - 21.5% ] 21.23% | 16,657 | 13.7% |
[ 21.5% - 22.0% ] 21.76% | 13,173 | 19.0% |
[ 22.0% - 22.5% ] 22.23% | 5,919 | 11.5% |
[ 22.5% - 23.0% ] 22.82% | 3,155 | 21.3% |
[ 23.0% - 23.5% ] 23.25% | 4,013 | 29.2% |
[ 23.5% - 24.0% ] 23.84% | 2,072 | 19.1% |
[ 24.0% - 24.5% ] 24.32% | 3,717 | 27.4% |
[ 24.5% - 25.0% ] 24.85% | 1,167 | 6.1% |
[ 25.0% - 25.5% ] 25.35% | 8,819 | 10.7% |
[ 25.5% - 26.0% ] 25.74% | 4,207 | 19.9% |
[ 26.0% - 26.5% ] 26.18% | 531 | 23.1% |
[ 26.5% - 27.0% ] 26.79% | 1,631 | 32.1% |
[ 27.0% - 27.5% ] 27.41% | 821 | 14.8% |
[ 27.5% - 28.0% ] 27.66% | 1,298 | 19.7% |
[ 28.0% - 28.5% ] 28.16% | 3,231 | 10.7% |
[ 28.5% - 29.0% ] 28.74% | 2,081 | 21.1% |
[ 29.0% - 29.5% ] 29.35% | 920 | 5.7% |
[ 29.5% - 30.0% ] 29.65% | 1,609 | 12.7% |
[ 30.0% - 30.5% ] 30.17% | 1,369 | 20.1% |
[ 30.5% - 31.0% ] 30.78% | 2,729 | 21.5% |
[ 31.0% - 31.5% ] 31.07% | 988 | 52.8% |
[ 32.0% - 32.5% ] 32.14% | 1,061 | 8.0% |
[ 33.0% - 33.5% ] 33.09% | 550 | 19.5% |
[ 33.5% - 34.0% ] 33.85% | 65 | 36.6% |
[ 34.5% - 35.0% ] 34.65% | 3,469 | 14.0% |
[ 35.0% - 35.5% ] 35.28% | 547 | 32.9% |
[ 35.5% - 36.0% ] 35.85% | 569 | 43.1% |
[ 36.0% - 36.5% ] 36.34% | 388 | 1.4% |
[ 36.5% - 37.0% ] 37.00% | 546 | 33.8% |
[ 37.5% - 38.0% ] 37.83% | 608 | 13.5% |
[ 39.5% - 40.0% ] 39.64% | 111 | 20.4% |
[ 40.0% - 40.5% ] 40.29% | 206 | 26.5% |
[ 41.0% - 41.5% ] 41.46% | 82 | 8.9% |
[ 43.0% - 43.5% ] 43.18% | 44 | 42.1% |
[ 44.5% - 45.0% ] 44.61% | 946 | 5.2% |
[ 45.5% - 46.0% ] 45.61% | 1,002 | 47.3% |
[ 47.0% - 47.5% ] 47.31% | 484 | 4.9% |
[ 48.0% - 48.5% ] 48.37% | 215 | 35.6% |
[ 50.0% - 50.5% ] 50.00% | 422 | 40.5% |
[ 51.0% - 51.5% ] 51.04% | 96 | 55.1% |
[ 51.5% - 52.0% ] 51.72% | 203 | 11.1% |
[ 52.0% - 52.5% ] 52.16% | 347 | 18.6% |
[ 52.5% - 53.0% ] 52.94% | 51 | 3.3% |
[ 53.0% - 53.5% ] 53.33% | 420 | 19.8% |
[ 53.5% - 54.0% ] 53.57% | 112 | 31.4% |
[ 54.0% - 54.5% ] 54.19% | 179 | 14.0% |
[ 56.0% - 56.5% ] 56.02% | 166 | 27.5% |
[ 57.0% - 57.5% ] 57.14% | 56 | 25.0% |
[ 58.0% - 58.5% ] 58.21% | 67 | 12.1% |
[ 60.0% - 60.5% ] 60.00% | 725 | 6.6% |
[ 61.5% - 62.0% ] 61.67% | 621 | 5.6% |
[ 62.0% - 62.5% ] 62.41% | 141 | 3.9% |
[ 63.0% - 63.5% ] 63.35% | 382 | 3.3% |
[ 66.5% - 67.0% ] 66.53% | 236 | 30.9% |
[ 89.5% - 90.0% ] 89.71% | 136 | 17.9% |
[ 99.5% - 100.0% ] 100.00% | 254 | 100.0% |