European GED/Equivalency
COMPARE
European
Select to Compare
GED/Equivalency
European GED/Equivalency
87.9%
GED/EQUIVALENCY
99.3/ 100
METRIC RATING
61st/ 347
METRIC RANK
European GED/Equivalency Correlation Chart
The statistical analysis conducted on geographies consisting of 561,829,334 people shows a mild positive correlation between the proportion of Europeans and percentage of population with at least ged/equivalency education in the United States with a correlation coefficient (R) of 0.319 and weighted average of 87.9%. On average, for every 1% (one percent) increase in Europeans within a typical geography, there is an increase of 0.12% in percentage of population with at least ged/equivalency education.
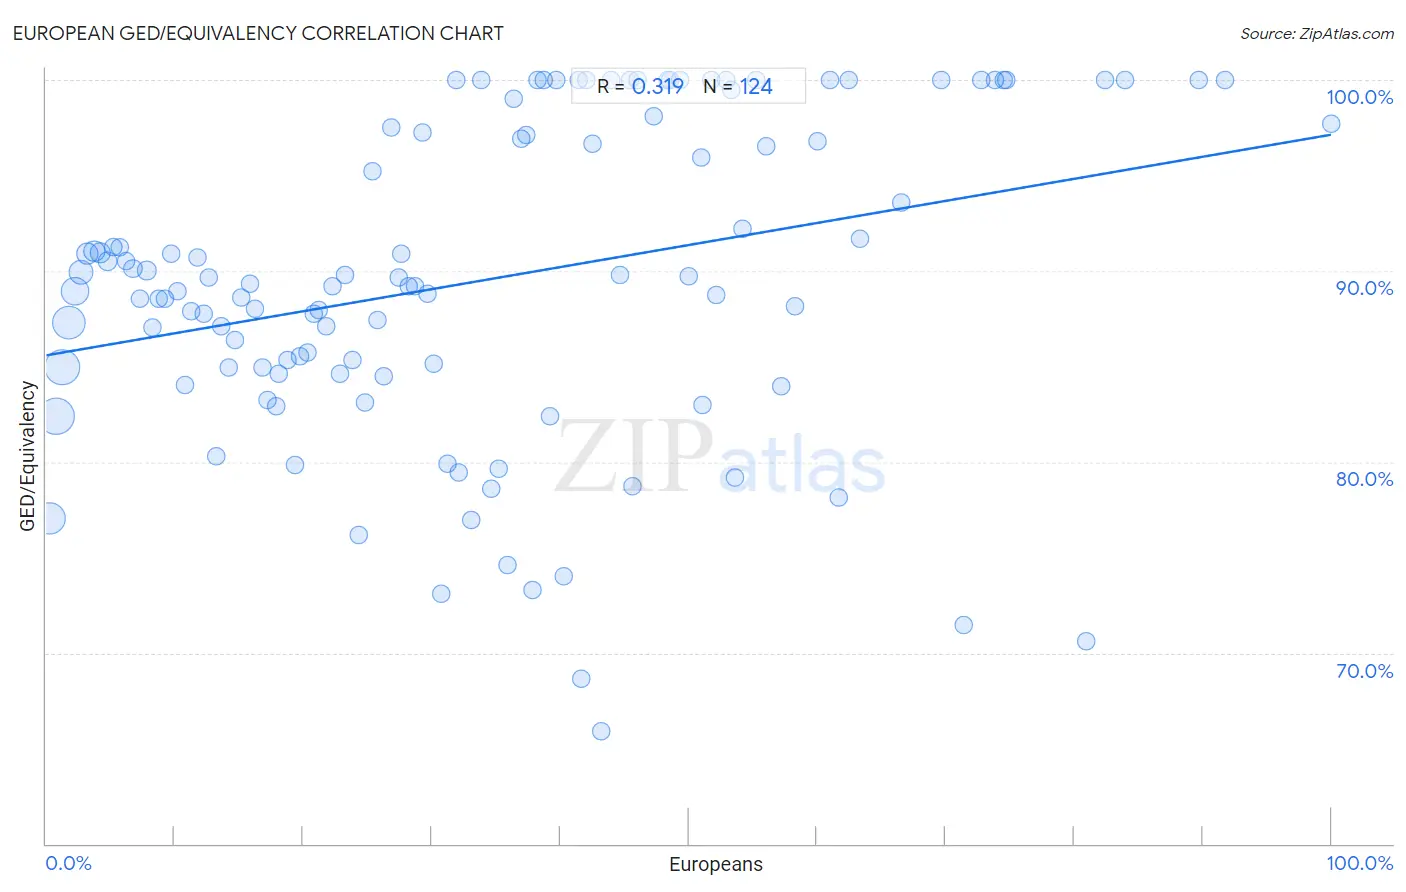
It is essential to understand that the correlation between the percentage of Europeans and percentage of population with at least ged/equivalency education does not imply a direct cause-and-effect relationship. It remains uncertain whether the presence of Europeans influences an upward or downward trend in the level of percentage of population with at least ged/equivalency education within an area, or if Europeans simply ended up residing in those areas with higher or lower levels of percentage of population with at least ged/equivalency education due to other factors.
Demographics Similar to Europeans by GED/Equivalency
In terms of ged/equivalency, the demographic groups most similar to Europeans are Scandinavian (87.9%, a difference of 0.0%), Serbian (87.9%, a difference of 0.010%), Immigrants from Czechoslovakia (87.9%, a difference of 0.020%), Northern European (87.9%, a difference of 0.020%), and German (87.9%, a difference of 0.020%).
| Demographics | Rating | Rank | GED/Equivalency |
| Soviet Union | 99.4 /100 | #54 | Exceptional 88.0% |
| New Zealanders | 99.4 /100 | #55 | Exceptional 88.0% |
| Immigrants from Denmark | 99.4 /100 | #56 | Exceptional 88.0% |
| Immigrants from Czechoslovakia | 99.3 /100 | #57 | Exceptional 87.9% |
| Northern Europeans | 99.3 /100 | #58 | Exceptional 87.9% |
| Serbians | 99.3 /100 | #59 | Exceptional 87.9% |
| Scandinavians | 99.3 /100 | #60 | Exceptional 87.9% |
| Europeans | 99.3 /100 | #61 | Exceptional 87.9% |
| Germans | 99.3 /100 | #62 | Exceptional 87.9% |
| Immigrants from Turkey | 99.2 /100 | #63 | Exceptional 87.9% |
| Immigrants from Canada | 99.2 /100 | #64 | Exceptional 87.9% |
| Immigrants from North America | 99.1 /100 | #65 | Exceptional 87.8% |
| Immigrants from Bulgaria | 99.1 /100 | #66 | Exceptional 87.8% |
| British | 99.1 /100 | #67 | Exceptional 87.8% |
| Immigrants from France | 99.1 /100 | #68 | Exceptional 87.8% |
European GED/Equivalency Correlation Summary
| Measurement | European Data | GED/Equivalency Data |
| Minimum | 0.27% | 65.9% |
| Maximum | 100.0% | 100.0% |
| Range | 99.7% | 34.1% |
| Mean | 34.2% | 89.5% |
| Median | 31.0% | 89.3% |
| Interquartile 25% (IQ1) | 15.5% | 84.8% |
| Interquartile 75% (IQ3) | 49.7% | 97.6% |
| Interquartile Range (IQR) | 34.2% | 12.8% |
| Standard Deviation (Sample) | 23.0% | 8.3% |
| Standard Deviation (Population) | 22.9% | 8.3% |
Correlation Details
| European Percentile | Sample Size | GED/Equivalency |
[ 0.0% - 0.5% ] 0.27% | 85,197,224 | 77.0% |
[ 0.5% - 1.0% ] 0.76% | 110,482,875 | 82.4% |
[ 1.0% - 1.5% ] 1.25% | 106,154,789 | 85.0% |
[ 1.5% - 2.0% ] 1.73% | 87,083,614 | 87.3% |
[ 2.0% - 2.5% ] 2.23% | 58,758,969 | 89.0% |
[ 2.5% - 3.0% ] 2.73% | 39,791,411 | 89.9% |
[ 3.0% - 3.5% ] 3.23% | 23,613,756 | 90.9% |
[ 3.5% - 4.0% ] 3.74% | 15,616,116 | 91.1% |
[ 4.0% - 4.5% ] 4.20% | 11,510,440 | 90.9% |
[ 4.5% - 5.0% ] 4.73% | 6,898,508 | 90.5% |
[ 5.0% - 5.5% ] 5.23% | 4,987,508 | 91.2% |
[ 5.5% - 6.0% ] 5.75% | 2,587,612 | 91.2% |
[ 6.0% - 6.5% ] 6.24% | 1,998,377 | 90.5% |
[ 6.5% - 7.0% ] 6.74% | 1,770,829 | 90.1% |
[ 7.0% - 7.5% ] 7.25% | 841,601 | 88.5% |
[ 7.5% - 8.0% ] 7.82% | 874,371 | 90.0% |
[ 8.0% - 8.5% ] 8.28% | 578,077 | 87.0% |
[ 8.5% - 9.0% ] 8.75% | 407,861 | 88.5% |
[ 9.0% - 9.5% ] 9.20% | 417,765 | 88.5% |
[ 9.5% - 10.0% ] 9.72% | 497,195 | 90.9% |
[ 10.0% - 10.5% ] 10.19% | 243,447 | 88.9% |
[ 10.5% - 11.0% ] 10.78% | 138,319 | 84.1% |
[ 11.0% - 11.5% ] 11.24% | 160,511 | 87.9% |
[ 11.5% - 12.0% ] 11.81% | 117,127 | 90.7% |
[ 12.0% - 12.5% ] 12.29% | 116,200 | 87.7% |
[ 12.5% - 13.0% ] 12.64% | 140,983 | 89.7% |
[ 13.0% - 13.5% ] 13.25% | 48,195 | 80.3% |
[ 13.5% - 14.0% ] 13.66% | 174,735 | 87.1% |
[ 14.0% - 14.5% ] 14.19% | 50,579 | 85.0% |
[ 14.5% - 15.0% ] 14.66% | 96,049 | 86.4% |
[ 15.0% - 15.5% ] 15.22% | 75,505 | 88.6% |
[ 15.5% - 16.0% ] 15.82% | 74,591 | 89.3% |
[ 16.0% - 16.5% ] 16.25% | 12,822 | 88.0% |
[ 16.5% - 17.0% ] 16.82% | 47,129 | 85.0% |
[ 17.0% - 17.5% ] 17.23% | 37,869 | 83.2% |
[ 17.5% - 18.0% ] 17.87% | 41,979 | 82.9% |
[ 18.0% - 18.5% ] 18.13% | 24,723 | 84.6% |
[ 18.5% - 19.0% ] 18.80% | 13,841 | 85.3% |
[ 19.0% - 19.5% ] 19.36% | 15,988 | 79.8% |
[ 19.5% - 20.0% ] 19.78% | 9,221 | 85.6% |
[ 20.0% - 20.5% ] 20.29% | 8,013 | 85.8% |
[ 20.5% - 21.0% ] 20.78% | 6,391 | 87.7% |
[ 21.0% - 21.5% ] 21.23% | 17,016 | 87.9% |
[ 21.5% - 22.0% ] 21.76% | 13,676 | 87.1% |
[ 22.0% - 22.5% ] 22.24% | 6,223 | 89.2% |
[ 22.5% - 23.0% ] 22.83% | 3,277 | 84.6% |
[ 23.0% - 23.5% ] 23.27% | 4,478 | 89.8% |
[ 23.5% - 24.0% ] 23.84% | 2,072 | 85.3% |
[ 24.0% - 24.5% ] 24.32% | 3,717 | 76.2% |
[ 24.5% - 25.0% ] 24.83% | 1,510 | 83.1% |
[ 25.0% - 25.5% ] 25.35% | 8,819 | 95.2% |
[ 25.5% - 26.0% ] 25.74% | 4,716 | 87.4% |
[ 26.0% - 26.5% ] 26.27% | 1,123 | 84.5% |
[ 26.5% - 27.0% ] 26.82% | 1,887 | 97.5% |
[ 27.0% - 27.5% ] 27.41% | 1,164 | 89.7% |
[ 27.5% - 28.0% ] 27.66% | 1,298 | 90.9% |
[ 28.0% - 28.5% ] 28.16% | 3,231 | 89.2% |
[ 28.5% - 29.0% ] 28.74% | 2,119 | 89.2% |
[ 29.0% - 29.5% ] 29.32% | 1,122 | 97.2% |
[ 29.5% - 30.0% ] 29.64% | 1,778 | 88.8% |
[ 30.0% - 30.5% ] 30.18% | 1,574 | 85.1% |
[ 30.5% - 31.0% ] 30.78% | 2,817 | 73.1% |
[ 31.0% - 31.5% ] 31.18% | 1,408 | 79.9% |
[ 31.5% - 32.0% ] 31.90% | 116 | 100.0% |
[ 32.0% - 32.5% ] 32.14% | 1,061 | 79.4% |
[ 33.0% - 33.5% ] 33.08% | 801 | 77.0% |
[ 33.5% - 34.0% ] 33.85% | 65 | 100.0% |
[ 34.5% - 35.0% ] 34.65% | 3,469 | 78.6% |
[ 35.0% - 35.5% ] 35.24% | 769 | 79.6% |
[ 35.5% - 36.0% ] 35.85% | 569 | 74.6% |
[ 36.0% - 36.5% ] 36.34% | 388 | 99.0% |
[ 36.5% - 37.0% ] 36.95% | 617 | 96.9% |
[ 37.0% - 37.5% ] 37.32% | 209 | 97.1% |
[ 37.5% - 38.0% ] 37.83% | 793 | 73.3% |
[ 38.0% - 38.5% ] 38.18% | 55 | 100.0% |
[ 38.5% - 39.0% ] 38.73% | 204 | 100.0% |
[ 39.0% - 39.5% ] 39.21% | 227 | 82.4% |
[ 39.5% - 40.0% ] 39.67% | 121 | 100.0% |
[ 40.0% - 40.5% ] 40.29% | 206 | 74.0% |
[ 41.0% - 41.5% ] 41.46% | 82 | 100.0% |
[ 41.5% - 42.0% ] 41.67% | 120 | 68.6% |
[ 42.0% - 42.5% ] 42.05% | 88 | 100.0% |
[ 42.5% - 43.0% ] 42.55% | 416 | 96.7% |
[ 43.0% - 43.5% ] 43.18% | 44 | 65.9% |
[ 43.5% - 44.0% ] 43.95% | 248 | 100.0% |
[ 44.5% - 45.0% ] 44.61% | 946 | 89.8% |
[ 45.0% - 45.5% ] 45.39% | 141 | 100.0% |
[ 45.5% - 46.0% ] 45.62% | 1,061 | 78.7% |
[ 46.0% - 46.5% ] 46.05% | 76 | 100.0% |
[ 47.0% - 47.5% ] 47.31% | 484 | 98.1% |
[ 48.0% - 48.5% ] 48.35% | 242 | 100.0% |
[ 48.5% - 49.0% ] 48.57% | 35 | 100.0% |
[ 49.0% - 49.5% ] 49.35% | 310 | 100.0% |
[ 50.0% - 50.5% ] 50.00% | 466 | 89.7% |
[ 50.5% - 51.0% ] 50.93% | 108 | 95.9% |
[ 51.0% - 51.5% ] 51.04% | 96 | 83.0% |
[ 51.5% - 52.0% ] 51.72% | 203 | 100.0% |
[ 52.0% - 52.5% ] 52.16% | 347 | 88.8% |
[ 52.5% - 53.0% ] 52.94% | 51 | 100.0% |
[ 53.0% - 53.5% ] 53.33% | 420 | 99.5% |
[ 53.5% - 54.0% ] 53.60% | 125 | 79.2% |
[ 54.0% - 54.5% ] 54.19% | 179 | 92.2% |
[ 55.0% - 55.5% ] 55.28% | 369 | 100.0% |
[ 56.0% - 56.5% ] 56.02% | 166 | 96.6% |
[ 57.0% - 57.5% ] 57.19% | 668 | 84.0% |
[ 58.0% - 58.5% ] 58.23% | 79 | 88.2% |
[ 60.0% - 60.5% ] 60.00% | 725 | 96.8% |
[ 61.0% - 61.5% ] 61.02% | 59 | 100.0% |
[ 61.5% - 62.0% ] 61.67% | 621 | 78.1% |
[ 62.0% - 62.5% ] 62.41% | 141 | 100.0% |
[ 63.0% - 63.5% ] 63.35% | 483 | 91.7% |
[ 66.5% - 67.0% ] 66.53% | 236 | 93.6% |
[ 69.5% - 70.0% ] 69.70% | 33 | 100.0% |
[ 71.0% - 71.5% ] 71.43% | 7 | 71.4% |
[ 72.5% - 73.0% ] 72.73% | 88 | 100.0% |
[ 73.5% - 74.0% ] 73.83% | 107 | 100.0% |
[ 74.0% - 74.5% ] 74.47% | 94 | 100.0% |
[ 74.5% - 75.0% ] 74.67% | 75 | 100.0% |
[ 80.5% - 81.0% ] 80.89% | 246 | 70.6% |
[ 82.0% - 82.5% ] 82.43% | 74 | 100.0% |
[ 83.5% - 84.0% ] 83.96% | 187 | 100.0% |
[ 89.5% - 90.0% ] 89.71% | 136 | 100.0% |
[ 91.5% - 92.0% ] 91.71% | 205 | 100.0% |
[ 99.5% - 100.0% ] 100.00% | 437 | 97.7% |