Zip Codes with the Highest Percentage of Population Employed in Health Diagnosing & Treating in District Of Columbia
RELATED REPORTS & OPTIONS
Health Diagnosing & Treating
District Of Columbia
Compare Zip Codes
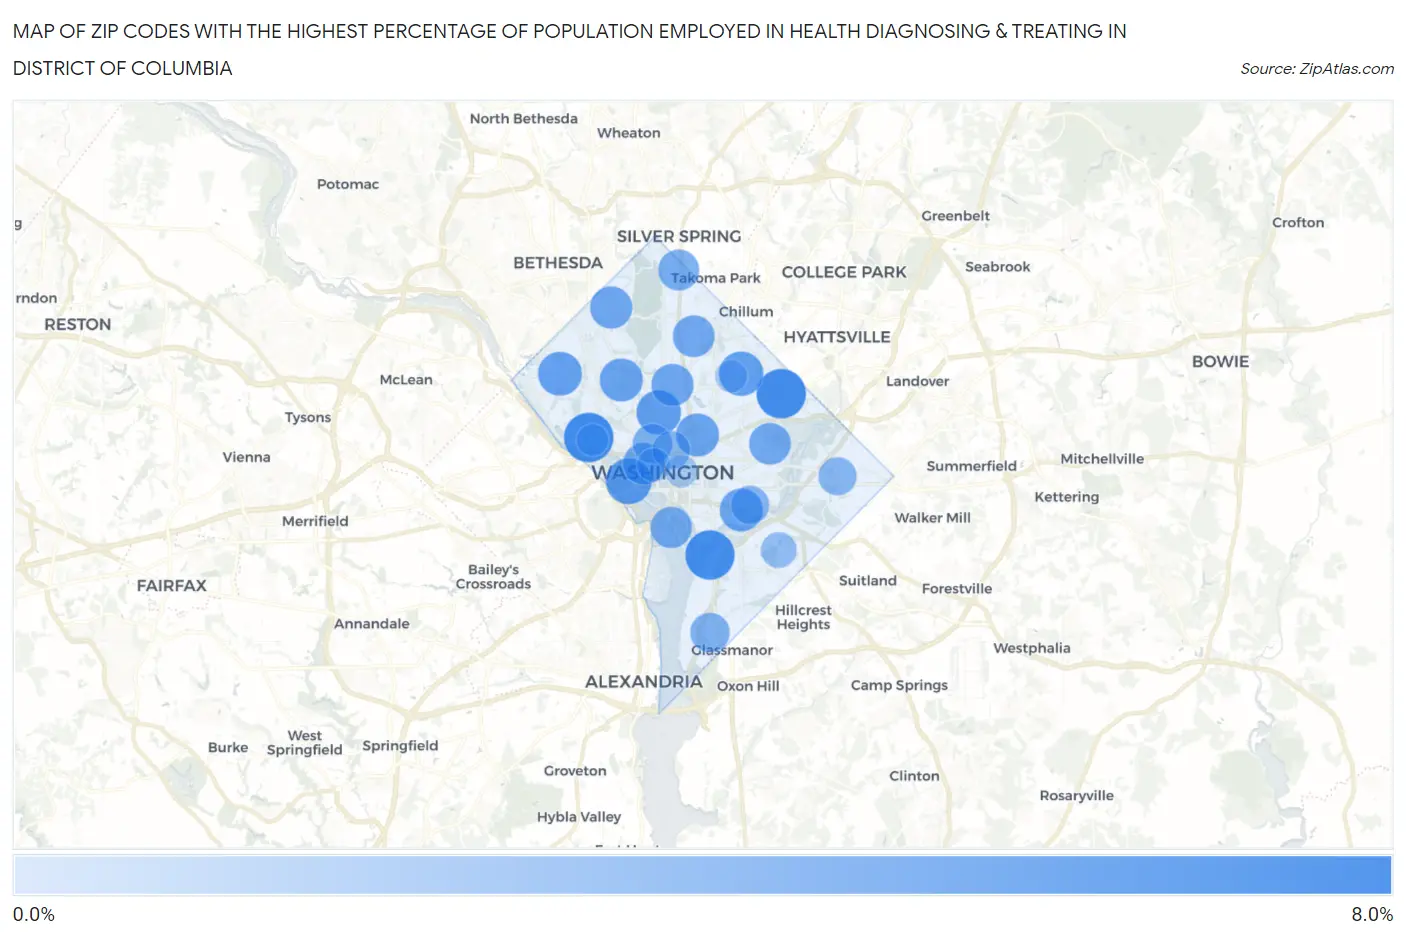
Map of Zip Codes with the Highest Percentage of Population Employed in Health Diagnosing & Treating in District Of Columbia
0.0%
8.0%
Zip Codes with the Highest Percentage of Population Employed in Health Diagnosing & Treating in District Of Columbia
| Zip Code | % Employed | vs State | vs National | |
| 1. | 20007 | 6.4% | 3.9%(+2.57)#1 | 6.2%(+0.178)#12,298 |
| 2. | 20018 | 6.4% | 3.9%(+2.55)#2 | 6.2%(+0.156)#12,382 |
| 3. | 20373 | 6.3% | 3.9%(+2.50)#3 | 6.2%(+0.104)#12,574 |
| 4. | 20037 | 5.2% | 3.9%(+1.30)#4 | 6.2%(-1.09)#17,118 |
| 5. | 20009 | 4.7% | 3.9%(+0.876)#5 | 6.2%(-1.52)#18,756 |
| 6. | 20017 | 4.7% | 3.9%(+0.836)#6 | 6.2%(-1.56)#18,896 |
| 7. | 20016 | 4.5% | 3.9%(+0.685)#7 | 6.2%(-1.71)#19,505 |
| 8. | 20008 | 4.3% | 3.9%(+0.419)#8 | 6.2%(-1.97)#20,446 |
| 9. | 20001 | 4.2% | 3.9%(+0.365)#9 | 6.2%(-2.03)#20,647 |
| 10. | 20390 | 4.2% | 3.9%(+0.349)#10 | 6.2%(-2.04)#20,709 |
| 11. | 20010 | 4.0% | 3.9%(+0.131)#11 | 6.2%(-2.26)#21,420 |
| 12. | 20015 | 3.9% | 3.9%(+0.090)#12 | 6.2%(-2.30)#21,547 |
| 13. | 20011 | 3.8% | 3.9%(-0.011)#13 | 6.2%(-2.40)#21,873 |
| 14. | 20052 | 3.8% | 3.9%(-0.027)#14 | 6.2%(-2.42)#21,919 |
| 15. | 20002 | 3.8% | 3.9%(-0.039)#15 | 6.2%(-2.43)#21,955 |
| 16. | 20024 | 3.6% | 3.9%(-0.207)#16 | 6.2%(-2.60)#22,473 |
| 17. | 20012 | 3.5% | 3.9%(-0.357)#17 | 6.2%(-2.75)#22,926 |
| 18. | 20036 | 3.1% | 3.9%(-0.775)#18 | 6.2%(-3.17)#24,128 |
| 19. | 20032 | 3.0% | 3.9%(-0.837)#19 | 6.2%(-3.23)#24,274 |
| 20. | 20003 | 2.7% | 3.9%(-1.18)#20 | 6.2%(-3.57)#25,119 |
| 21. | 20019 | 2.6% | 3.9%(-1.29)#21 | 6.2%(-3.68)#25,366 |
| 22. | 20005 | 2.5% | 3.9%(-1.35)#22 | 6.2%(-3.74)#25,502 |
| 23. | 20020 | 1.8% | 3.9%(-2.05)#23 | 6.2%(-4.45)#26,800 |
| 24. | 20006 | 1.1% | 3.9%(-2.77)#24 | 6.2%(-5.16)#27,737 |
| 25. | 20004 | 0.70% | 3.9%(-3.15)#25 | 6.2%(-5.54)#28,146 |
| 26. | 20064 | 0.63% | 3.9%(-3.22)#26 | 6.2%(-5.62)#28,210 |
| 27. | 20057 | 0.53% | 3.9%(-3.33)#27 | 6.2%(-5.72)#28,281 |
1
Common Questions
What are the Top 10 Zip Codes with the Highest Percentage of Population Employed in Health Diagnosing & Treating in District Of Columbia?
Top 10 Zip Codes with the Highest Percentage of Population Employed in Health Diagnosing & Treating in District Of Columbia are:
What zip code has the Highest Percentage of Population Employed in Health Diagnosing & Treating in District Of Columbia?
20007 has the Highest Percentage of Population Employed in Health Diagnosing & Treating in District Of Columbia with 6.4%.
What is the Percentage of Population Employed in Health Diagnosing & Treating in the State of District Of Columbia?
Percentage of Population Employed in Health Diagnosing & Treating in District Of Columbia is 3.9%.
What is the Percentage of Population Employed in Health Diagnosing & Treating in the United States?
Percentage of Population Employed in Health Diagnosing & Treating in the United States is 6.2%.