Zip Codes with the Highest Percentage of Population Employed in Administrative & Support Services in District Of Columbia
RELATED REPORTS & OPTIONS
Administrative & Support Services
District Of Columbia
Compare Zip Codes
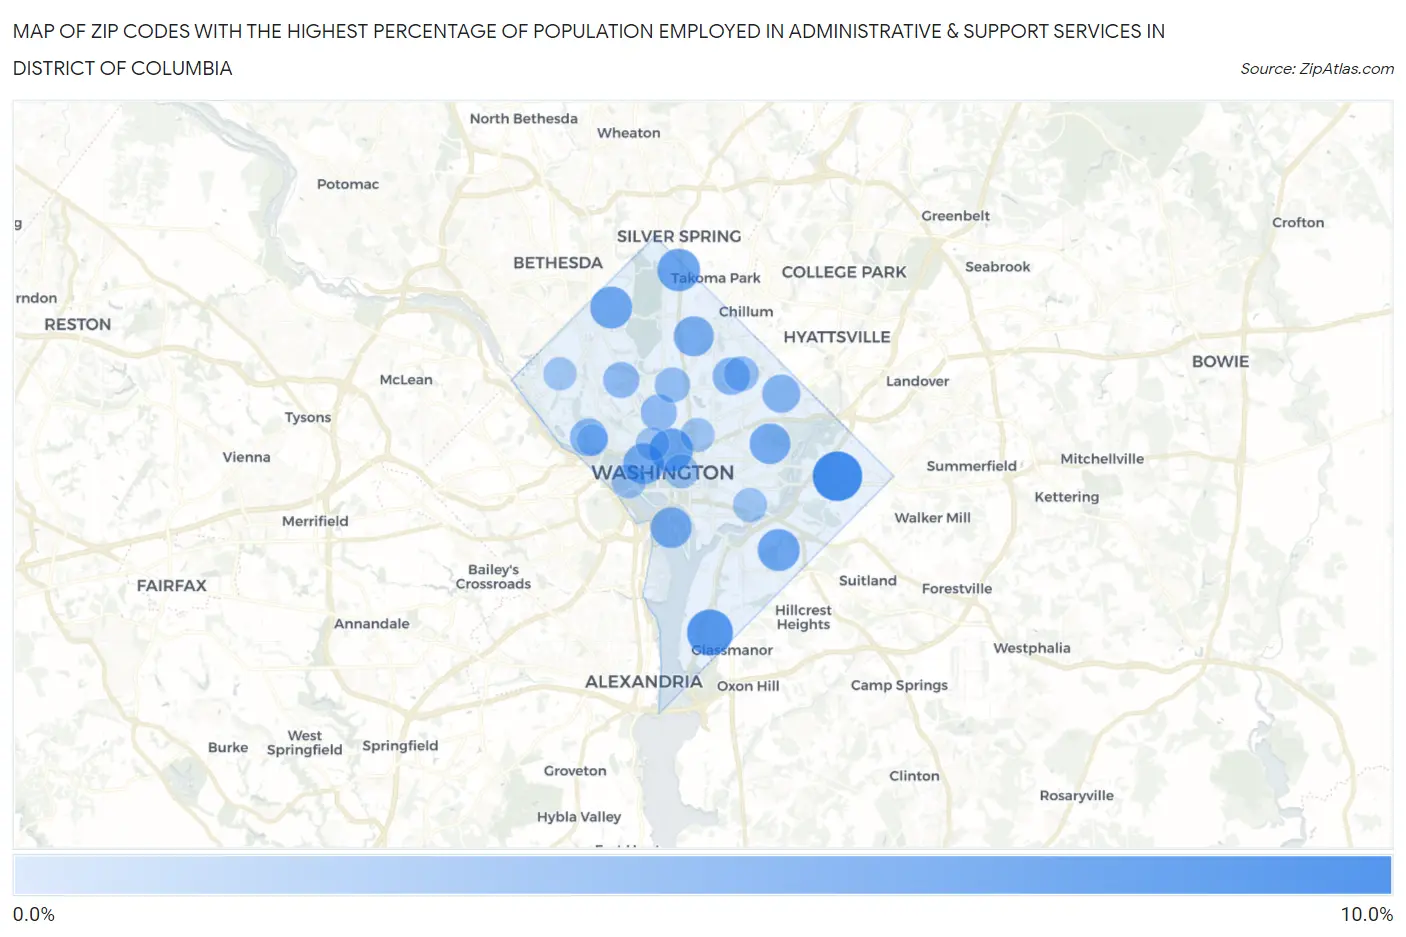
Map of Zip Codes with the Highest Percentage of Population Employed in Administrative & Support Services in District Of Columbia
0.0%
10.0%
Zip Codes with the Highest Percentage of Population Employed in Administrative & Support Services in District Of Columbia
| Zip Code | % Employed | vs State | vs National | |
| 1. | 20019 | 8.5% | 3.7%(+4.72)#1 | 4.1%(+4.30)#1,999 |
| 2. | 20032 | 6.8% | 3.7%(+3.10)#2 | 4.1%(+2.69)#3,434 |
| 3. | 20005 | 5.6% | 3.7%(+1.91)#3 | 4.1%(+1.50)#5,475 |
| 4. | 20012 | 5.4% | 3.7%(+1.65)#4 | 4.1%(+1.23)#6,125 |
| 5. | 20015 | 5.1% | 3.7%(+1.34)#5 | 4.1%(+0.925)#6,913 |
| 6. | 20020 | 5.1% | 3.7%(+1.34)#6 | 4.1%(+0.922)#6,917 |
| 7. | 20052 | 4.7% | 3.7%(+0.961)#7 | 4.1%(+0.546)#8,044 |
| 8. | 20024 | 4.6% | 3.7%(+0.822)#8 | 4.1%(+0.407)#8,514 |
| 9. | 20002 | 4.5% | 3.7%(+0.813)#9 | 4.1%(+0.398)#8,548 |
| 10. | 20011 | 4.3% | 3.7%(+0.528)#10 | 4.1%(+0.113)#9,577 |
| 11. | 20018 | 3.4% | 3.7%(-0.354)#11 | 4.1%(-0.769)#13,541 |
| 12. | 20007 | 3.2% | 3.7%(-0.510)#12 | 4.1%(-0.925)#14,350 |
| 13. | 20064 | 3.1% | 3.7%(-0.590)#13 | 4.1%(-1.01)#14,772 |
| 14. | 20009 | 2.6% | 3.7%(-1.14)#14 | 4.1%(-1.55)#17,628 |
| 15. | 20008 | 2.5% | 3.7%(-1.20)#15 | 4.1%(-1.62)#17,966 |
| 16. | 20010 | 2.2% | 3.7%(-1.52)#16 | 4.1%(-1.93)#19,595 |
| 17. | 20017 | 2.1% | 3.7%(-1.67)#17 | 4.1%(-2.08)#20,297 |
| 18. | 20004 | 1.8% | 3.7%(-1.91)#18 | 4.1%(-2.32)#21,393 |
| 19. | 20037 | 1.8% | 3.7%(-1.98)#19 | 4.1%(-2.39)#21,714 |
| 20. | 20003 | 1.7% | 3.7%(-2.05)#20 | 4.1%(-2.46)#22,009 |
| 21. | 20001 | 1.7% | 3.7%(-2.06)#21 | 4.1%(-2.48)#22,081 |
| 22. | 20036 | 1.4% | 3.7%(-2.30)#22 | 4.1%(-2.72)#23,007 |
| 23. | 20016 | 1.3% | 3.7%(-2.43)#23 | 4.1%(-2.84)#23,477 |
| 24. | 20057 | 0.53% | 3.7%(-3.21)#24 | 4.1%(-3.62)#25,802 |
1
Common Questions
What are the Top 10 Zip Codes with the Highest Percentage of Population Employed in Administrative & Support Services in District Of Columbia?
Top 10 Zip Codes with the Highest Percentage of Population Employed in Administrative & Support Services in District Of Columbia are:
What zip code has the Highest Percentage of Population Employed in Administrative & Support Services in District Of Columbia?
20019 has the Highest Percentage of Population Employed in Administrative & Support Services in District Of Columbia with 8.5%.
What is the Percentage of Population Employed in Administrative & Support Services in the State of District Of Columbia?
Percentage of Population Employed in Administrative & Support Services in District Of Columbia is 3.7%.
What is the Percentage of Population Employed in Administrative & Support Services in the United States?
Percentage of Population Employed in Administrative & Support Services in the United States is 4.1%.