Zip Codes with the Highest Percentage of Population Employed in Health Care & Social Assistance in Vermont
RELATED REPORTS & OPTIONS
Health Care & Social Assistance
Vermont
Compare Zip Codes
Map of Zip Codes with the Highest Percentage of Population Employed in Health Care & Social Assistance in Vermont
10.0%
60.0%
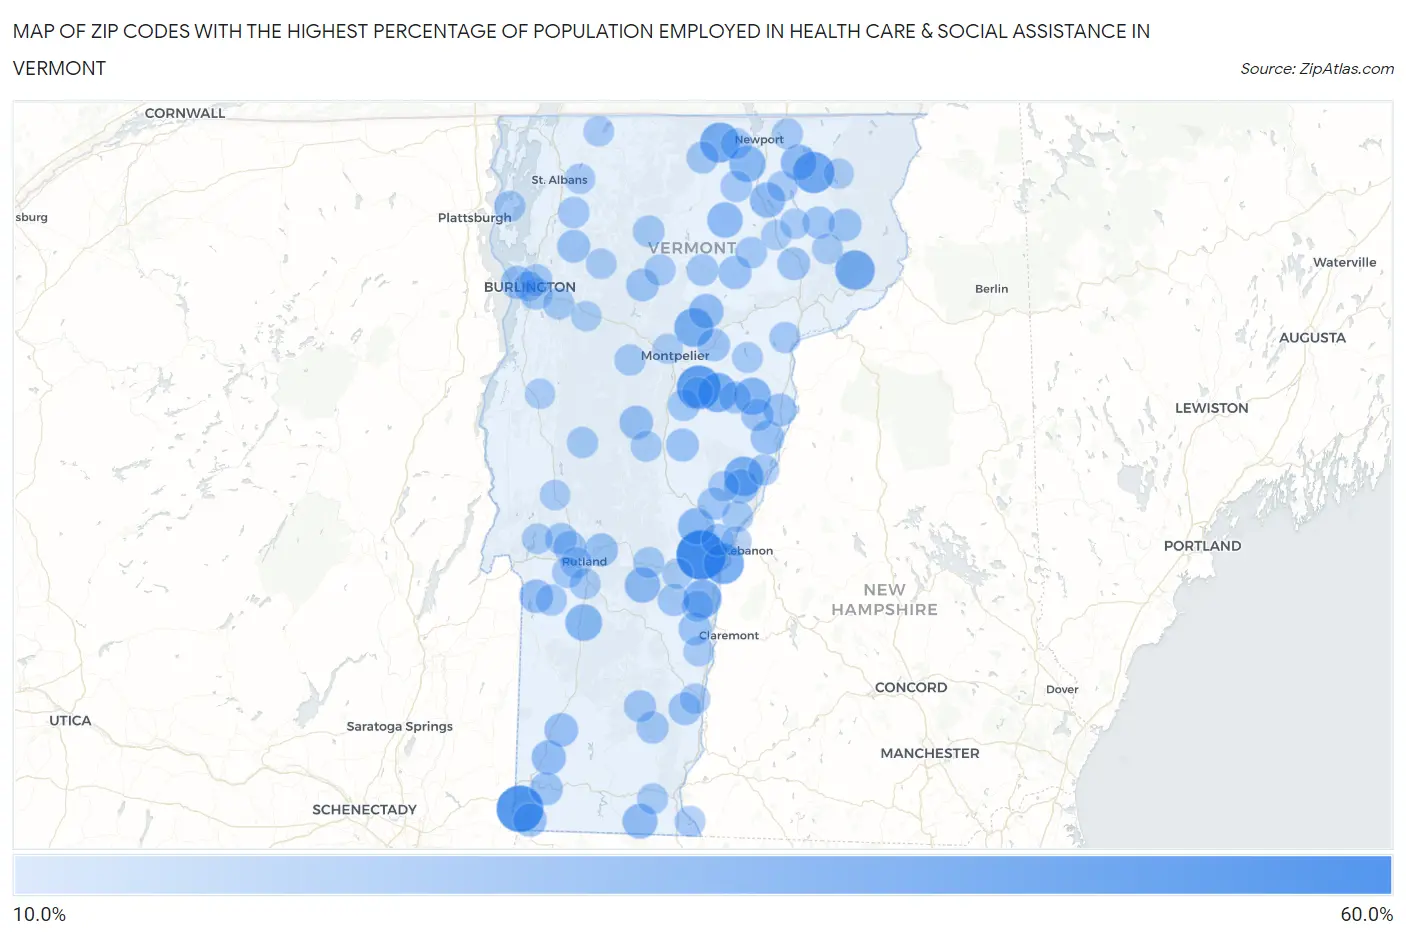
Zip Codes with the Highest Percentage of Population Employed in Health Care & Social Assistance in Vermont
| Zip Code | % Employed | vs State | vs National | |
| 1. | 05073 | 54.5% | 15.4% (+39.1)#1 | 13.9% (+40.6)#175 |
| 2. | 05260 | 48.6% | 15.4% (+33.2)#2 | 13.9% (+34.7)#243 |
| 3. | 05678 | 42.9% | 15.4% (+27.4)#3 | 13.9% (+28.9)#335 |
| 4. | 05833 | 37.5% | 15.4% (+22.1)#4 | 13.9% (+23.6)#475 |
| 5. | 05052 | 35.6% | 15.4% (+20.1)#5 | 13.9% (+21.6)#568 |
| 6. | 05868 | 34.6% | 15.4% (+19.2)#6 | 13.9% (+20.7)#619 |
| 7. | 05858 | 34.1% | 15.4% (+18.6)#7 | 13.9% (+20.1)#649 |
| 8. | 05649 | 33.3% | 15.4% (+17.9)#8 | 13.9% (+19.4)#685 |
| 9. | 05058 | 33.3% | 15.4% (+17.9)#9 | 13.9% (+19.4)#689 |
| 10. | 05640 | 32.7% | 15.4% (+17.2)#10 | 13.9% (+18.8)#731 |
| 11. | 05089 | 31.0% | 15.4% (+15.5)#11 | 13.9% (+17.0)#856 |
| 12. | 05076 | 29.1% | 15.4% (+13.7)#12 | 13.9% (+15.2)#1,027 |
| 13. | 05773 | 28.2% | 15.4% (+12.8)#13 | 13.9% (+14.3)#1,151 |
| 14. | 05053 | 27.6% | 15.4% (+12.2)#14 | 13.9% (+13.7)#1,238 |
| 15. | 05825 | 27.6% | 15.4% (+12.1)#15 | 13.9% (+13.7)#1,247 |
| 16. | 05872 | 26.6% | 15.4% (+11.2)#16 | 13.9% (+12.7)#1,408 |
| 17. | 05056 | 25.8% | 15.4% (+10.3)#17 | 13.9% (+11.8)#1,561 |
| 18. | 05827 | 25.7% | 15.4% (+10.2)#18 | 13.9% (+11.7)#1,579 |
| 19. | 05822 | 25.3% | 15.4% (+9.81)#19 | 13.9% (+11.3)#1,673 |
| 20. | 05358 | 24.8% | 15.4% (+9.40)#20 | 13.9% (+10.9)#1,771 |
| 21. | 05650 | 24.1% | 15.4% (+8.66)#21 | 13.9% (+10.2)#1,970 |
| 22. | 05262 | 23.6% | 15.4% (+8.20)#22 | 13.9% (+9.71)#2,094 |
| 23. | 05075 | 23.3% | 15.4% (+7.85)#23 | 13.9% (+9.36)#2,232 |
| 24. | 05669 | 22.3% | 15.4% (+6.84)#24 | 13.9% (+8.35)#2,651 |
| 25. | 05252 | 22.1% | 15.4% (+6.70)#25 | 13.9% (+8.21)#2,728 |
| 26. | 05764 | 22.1% | 15.4% (+6.61)#26 | 13.9% (+8.12)#2,774 |
| 27. | 05033 | 22.0% | 15.4% (+6.56)#27 | 13.9% (+8.06)#2,795 |
| 28. | 05261 | 21.6% | 15.4% (+6.13)#28 | 13.9% (+7.64)#3,025 |
| 29. | 05408 | 21.3% | 15.4% (+5.87)#29 | 13.9% (+7.38)#3,162 |
| 30. | 05701 | 21.3% | 15.4% (+5.83)#30 | 13.9% (+7.34)#3,181 |
| 31. | 05843 | 21.2% | 15.4% (+5.78)#31 | 13.9% (+7.29)#3,220 |
| 32. | 05201 | 21.2% | 15.4% (+5.72)#32 | 13.9% (+7.23)#3,263 |
| 33. | 05041 | 20.8% | 15.4% (+5.34)#33 | 13.9% (+6.84)#3,523 |
| 34. | 05051 | 20.7% | 15.4% (+5.28)#34 | 13.9% (+6.79)#3,565 |
| 35. | 05151 | 20.5% | 15.4% (+5.09)#35 | 13.9% (+6.60)#3,687 |
| 36. | 05765 | 20.5% | 15.4% (+5.07)#36 | 13.9% (+6.58)#3,710 |
| 37. | 05494 | 20.5% | 15.4% (+5.07)#37 | 13.9% (+6.58)#3,711 |
| 38. | 05851 | 20.4% | 15.4% (+4.94)#38 | 13.9% (+6.45)#3,802 |
| 39. | 05837 | 20.4% | 15.4% (+4.93)#39 | 13.9% (+6.43)#3,810 |
| 40. | 05672 | 20.3% | 15.4% (+4.88)#40 | 13.9% (+6.39)#3,841 |
| 41. | 05154 | 20.3% | 15.4% (+4.81)#41 | 13.9% (+6.32)#3,893 |
| 42. | 05667 | 20.2% | 15.4% (+4.78)#42 | 13.9% (+6.29)#3,917 |
| 43. | 05040 | 19.8% | 15.4% (+4.38)#43 | 13.9% (+5.88)#4,213 |
| 44. | 05065 | 19.4% | 15.4% (+4.00)#44 | 13.9% (+5.51)#4,562 |
| 45. | 05353 | 19.4% | 15.4% (+3.91)#45 | 13.9% (+5.41)#4,660 |
| 46. | 05871 | 19.3% | 15.4% (+3.87)#46 | 13.9% (+5.38)#4,686 |
| 47. | 05001 | 19.2% | 15.4% (+3.71)#47 | 13.9% (+5.22)#4,836 |
| 48. | 05359 | 19.1% | 15.4% (+3.70)#48 | 13.9% (+5.21)#4,848 |
| 49. | 05874 | 19.0% | 15.4% (+3.56)#49 | 13.9% (+5.07)#4,985 |
| 50. | 05062 | 18.9% | 15.4% (+3.50)#50 | 13.9% (+5.00)#5,048 |
| 51. | 05403 | 18.8% | 15.4% (+3.40)#51 | 13.9% (+4.91)#5,143 |
| 52. | 05086 | 18.8% | 15.4% (+3.33)#52 | 13.9% (+4.84)#5,230 |
| 53. | 05679 | 18.7% | 15.4% (+3.28)#53 | 13.9% (+4.78)#5,290 |
| 54. | 05680 | 18.5% | 15.4% (+3.10)#54 | 13.9% (+4.61)#5,485 |
| 55. | 05404 | 18.3% | 15.4% (+2.87)#55 | 13.9% (+4.37)#5,794 |
| 56. | 05744 | 18.3% | 15.4% (+2.85)#56 | 13.9% (+4.36)#5,823 |
| 57. | 05656 | 18.3% | 15.4% (+2.81)#57 | 13.9% (+4.32)#5,866 |
| 58. | 05845 | 18.1% | 15.4% (+2.64)#58 | 13.9% (+4.15)#6,073 |
| 59. | 05454 | 18.0% | 15.4% (+2.56)#59 | 13.9% (+4.07)#6,174 |
| 60. | 05842 | 18.0% | 15.4% (+2.55)#60 | 13.9% (+4.06)#6,195 |
| 61. | 05495 | 17.9% | 15.4% (+2.47)#61 | 13.9% (+3.98)#6,302 |
| 62. | 05037 | 17.9% | 15.4% (+2.42)#62 | 13.9% (+3.93)#6,362 |
| 63. | 05035 | 17.7% | 15.4% (+2.22)#63 | 13.9% (+3.73)#6,692 |
| 64. | 05757 | 17.6% | 15.4% (+2.16)#64 | 13.9% (+3.66)#6,782 |
| 65. | 05766 | 17.4% | 15.4% (+1.98)#65 | 13.9% (+3.49)#7,052 |
| 66. | 05821 | 17.4% | 15.4% (+1.95)#66 | 13.9% (+3.46)#7,116 |
| 67. | 05660 | 17.4% | 15.4% (+1.92)#67 | 13.9% (+3.43)#7,148 |
| 68. | 05857 | 17.3% | 15.4% (+1.88)#68 | 13.9% (+3.39)#7,213 |
| 69. | 05736 | 17.3% | 15.4% (+1.81)#69 | 13.9% (+3.32)#7,296 |
| 70. | 05661 | 17.3% | 15.4% (+1.81)#70 | 13.9% (+3.32)#7,303 |
| 71. | 05060 | 17.1% | 15.4% (+1.64)#71 | 13.9% (+3.15)#7,587 |
| 72. | 05045 | 17.1% | 15.4% (+1.63)#72 | 13.9% (+3.14)#7,601 |
| 73. | 05777 | 17.0% | 15.4% (+1.56)#73 | 13.9% (+3.07)#7,709 |
| 74. | 05654 | 17.0% | 15.4% (+1.55)#74 | 13.9% (+3.05)#7,738 |
| 75. | 05301 | 17.0% | 15.4% (+1.55)#75 | 13.9% (+3.05)#7,739 |
| 76. | 05055 | 16.9% | 15.4% (+1.46)#76 | 13.9% (+2.97)#7,865 |
| 77. | 05759 | 16.8% | 15.4% (+1.39)#77 | 13.9% (+2.90)#7,996 |
| 78. | 05046 | 16.7% | 15.4% (+1.25)#78 | 13.9% (+2.75)#8,202 |
| 79. | 05458 | 16.7% | 15.4% (+1.24)#79 | 13.9% (+2.75)#8,214 |
| 80. | 05829 | 16.6% | 15.4% (+1.18)#80 | 13.9% (+2.69)#8,338 |
| 81. | 05071 | 16.4% | 15.4% (+0.950)#81 | 13.9% (+2.46)#8,750 |
| 82. | 05354 | 16.4% | 15.4% (+0.945)#82 | 13.9% (+2.45)#8,757 |
| 83. | 05489 | 16.4% | 15.4% (+0.939)#83 | 13.9% (+2.45)#8,765 |
| 84. | 05732 | 16.4% | 15.4% (+0.913)#84 | 13.9% (+2.42)#8,814 |
| 85. | 05070 | 16.3% | 15.4% (+0.866)#85 | 13.9% (+2.37)#8,912 |
| 86. | 05101 | 16.2% | 15.4% (+0.745)#86 | 13.9% (+2.25)#9,146 |
| 87. | 05832 | 16.2% | 15.4% (+0.742)#87 | 13.9% (+2.25)#9,152 |
| 88. | 05860 | 16.1% | 15.4% (+0.705)#88 | 13.9% (+2.21)#9,209 |
| 89. | 05401 | 16.1% | 15.4% (+0.678)#89 | 13.9% (+2.19)#9,273 |
| 90. | 05457 | 16.0% | 15.4% (+0.561)#90 | 13.9% (+2.07)#9,480 |
| 91. | 05156 | 15.9% | 15.4% (+0.483)#91 | 13.9% (+1.99)#9,629 |
| 92. | 05455 | 15.9% | 15.4% (+0.456)#92 | 13.9% (+1.96)#9,700 |
| 93. | 05733 | 15.8% | 15.4% (+0.397)#93 | 13.9% (+1.90)#9,835 |
| 94. | 05477 | 15.8% | 15.4% (+0.350)#94 | 13.9% (+1.86)#9,922 |
| 95. | 05088 | 15.6% | 15.4% (+0.169)#95 | 13.9% (+1.68)#10,275 |
| 96. | 05472 | 15.6% | 15.4% (+0.144)#96 | 13.9% (+1.65)#10,320 |
| 97. | 05866 | 15.6% | 15.4% (+0.127)#97 | 13.9% (+1.63)#10,355 |
| 98. | 05867 | 15.5% | 15.4% (+0.080)#98 | 13.9% (+1.59)#10,461 |
| 99. | 05846 | 15.5% | 15.4% (+0.016)#99 | 13.9% (+1.52)#10,597 |
| 100. | 05602 | 15.4% | 15.4% (-0.086)#100 | 13.9% (+1.42)#10,854 |
Common Questions
What are the Top 10 Zip Codes with the Highest Percentage of Population Employed in Health Care & Social Assistance in Vermont?
Top 10 Zip Codes with the Highest Percentage of Population Employed in Health Care & Social Assistance in Vermont are:
What zip code has the Highest Percentage of Population Employed in Health Care & Social Assistance in Vermont?
05073 has the Highest Percentage of Population Employed in Health Care & Social Assistance in Vermont with 54.5%.
What is the Percentage of Population Employed in Health Care & Social Assistance in the State of Vermont?
Percentage of Population Employed in Health Care & Social Assistance in Vermont is 15.4%.
What is the Percentage of Population Employed in Health Care & Social Assistance in the United States?
Percentage of Population Employed in Health Care & Social Assistance in the United States is 13.9%.