Zip Codes with the Highest Percentage of Population Employed in Firefighting & Prevention in Vermont
RELATED REPORTS & OPTIONS
Firefighting & Prevention
Vermont
Compare Zip Codes
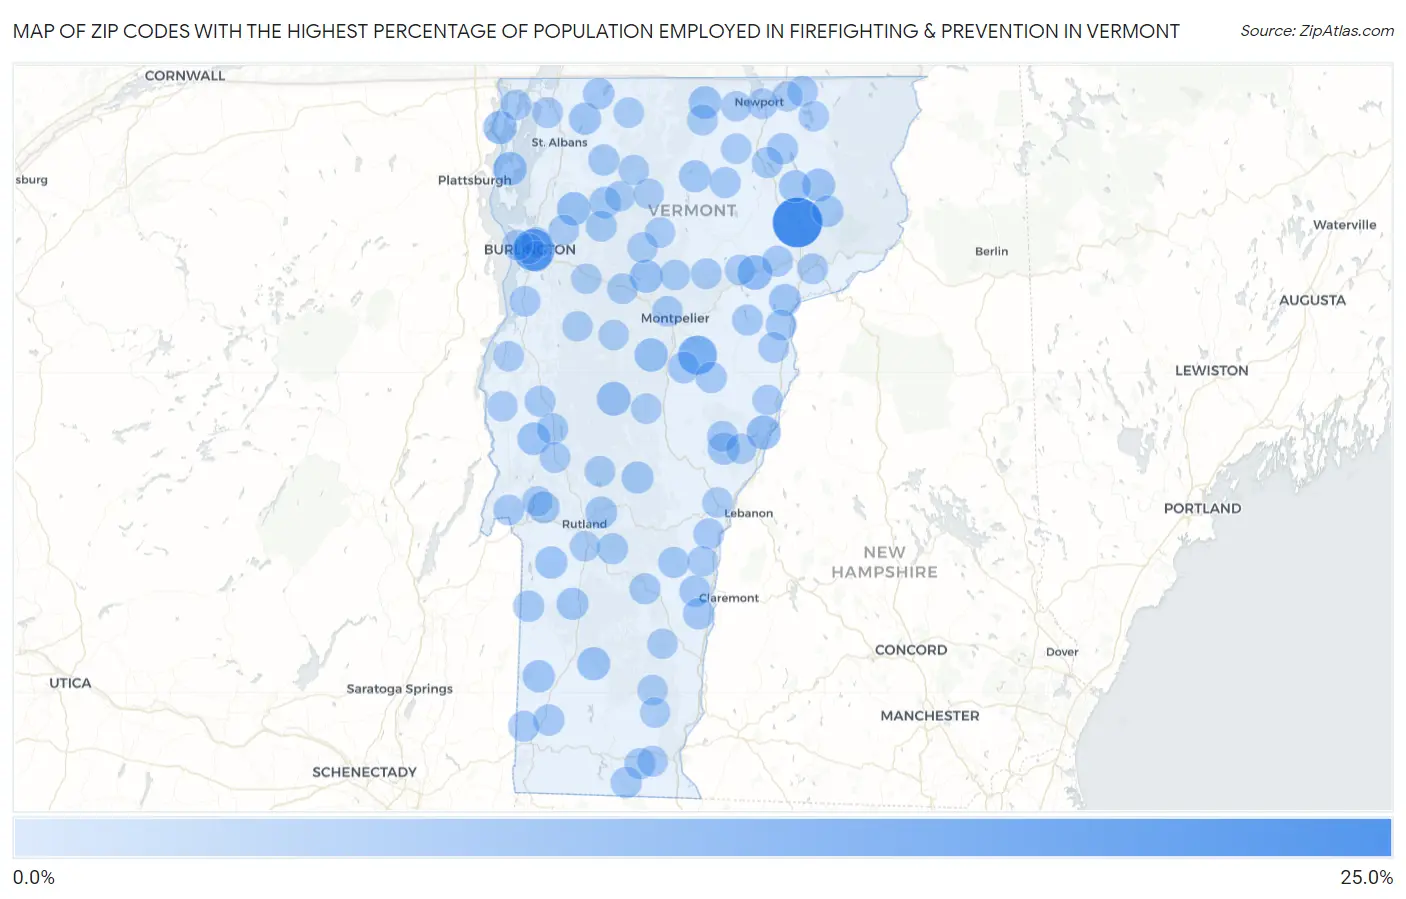
Map of Zip Codes with the Highest Percentage of Population Employed in Firefighting & Prevention in Vermont
0.0%
25.0%
Zip Codes with the Highest Percentage of Population Employed in Firefighting & Prevention in Vermont
| Zip Code | % Employed | vs State | vs National | |
| 1. | 05850 | 21.7% | 0.67%(+21.0)#1 | 1.2%(+20.5)#86 |
| 2. | 05405 | 13.1% | 0.67%(+12.4)#2 | 1.2%(+11.9)#201 |
| 3. | 05654 | 9.6% | 0.67%(+8.91)#3 | 1.2%(+8.40)#321 |
| 4. | 05873 | 4.8% | 0.67%(+4.17)#4 | 1.2%(+3.66)#970 |
| 5. | 05045 | 4.6% | 0.67%(+3.90)#5 | 1.2%(+3.39)#1,067 |
| 6. | 05747 | 4.2% | 0.67%(+3.57)#6 | 1.2%(+3.06)#1,232 |
| 7. | 05458 | 3.9% | 0.67%(+3.26)#7 | 1.2%(+2.74)#1,393 |
| 8. | 05663 | 3.6% | 0.67%(+2.96)#8 | 1.2%(+2.45)#1,613 |
| 9. | 05494 | 3.6% | 0.67%(+2.89)#9 | 1.2%(+2.38)#1,667 |
| 10. | 05463 | 3.6% | 0.67%(+2.89)#10 | 1.2%(+2.37)#1,673 |
| 11. | 05677 | 3.4% | 0.67%(+2.73)#11 | 1.2%(+2.22)#1,807 |
| 12. | 05340 | 3.3% | 0.67%(+2.68)#12 | 1.2%(+2.16)#1,858 |
| 13. | 05871 | 3.1% | 0.67%(+2.40)#13 | 1.2%(+1.88)#2,161 |
| 14. | 05778 | 2.8% | 0.67%(+2.14)#14 | 1.2%(+1.63)#2,547 |
| 15. | 05859 | 2.8% | 0.67%(+2.12)#15 | 1.2%(+1.60)#2,591 |
| 16. | 05757 | 2.4% | 0.67%(+1.73)#16 | 1.2%(+1.21)#3,334 |
| 17. | 05250 | 2.3% | 0.67%(+1.63)#17 | 1.2%(+1.12)#3,547 |
| 18. | 05821 | 2.3% | 0.67%(+1.62)#18 | 1.2%(+1.10)#3,594 |
| 19. | 05483 | 2.3% | 0.67%(+1.61)#19 | 1.2%(+1.09)#3,620 |
| 20. | 05653 | 2.2% | 0.67%(+1.53)#20 | 1.2%(+1.02)#3,851 |
| 21. | 05867 | 2.2% | 0.67%(+1.49)#21 | 1.2%(+0.980)#3,967 |
| 22. | 05070 | 2.1% | 0.67%(+1.47)#22 | 1.2%(+0.960)#4,022 |
| 23. | 05772 | 2.0% | 0.67%(+1.37)#23 | 1.2%(+0.860)#4,348 |
| 24. | 05739 | 2.0% | 0.67%(+1.35)#24 | 1.2%(+0.833)#4,448 |
| 25. | 05735 | 1.9% | 0.67%(+1.22)#25 | 1.2%(+0.704)#4,959 |
| 26. | 05701 | 1.9% | 0.67%(+1.20)#26 | 1.2%(+0.685)#5,042 |
| 27. | 05679 | 1.8% | 0.67%(+1.12)#27 | 1.2%(+0.605)#5,396 |
| 28. | 05832 | 1.8% | 0.67%(+1.09)#28 | 1.2%(+0.577)#5,527 |
| 29. | 05444 | 1.7% | 0.67%(+1.05)#29 | 1.2%(+0.542)#5,698 |
| 30. | 05769 | 1.5% | 0.67%(+0.829)#30 | 1.2%(+0.317)#6,950 |
| 31. | 05151 | 1.5% | 0.67%(+0.815)#31 | 1.2%(+0.302)#7,055 |
| 32. | 05156 | 1.4% | 0.67%(+0.766)#32 | 1.2%(+0.253)#7,380 |
| 33. | 05457 | 1.4% | 0.67%(+0.762)#33 | 1.2%(+0.249)#7,407 |
| 34. | 05262 | 1.4% | 0.67%(+0.684)#34 | 1.2%(+0.172)#7,924 |
| 35. | 05775 | 1.4% | 0.67%(+0.678)#35 | 1.2%(+0.166)#7,972 |
| 36. | 05860 | 1.3% | 0.67%(+0.616)#36 | 1.2%(+0.103)#8,432 |
| 37. | 05675 | 1.3% | 0.67%(+0.598)#37 | 1.2%(+0.085)#8,577 |
| 38. | 05342 | 1.3% | 0.67%(+0.593)#38 | 1.2%(+0.080)#8,620 |
| 39. | 05822 | 1.2% | 0.67%(+0.561)#39 | 1.2%(+0.049)#8,852 |
| 40. | 05448 | 1.2% | 0.67%(+0.529)#40 | 1.2%(+0.016)#9,130 |
| 41. | 05827 | 1.2% | 0.67%(+0.494)#41 | 1.2%(-0.018)#9,440 |
| 42. | 05149 | 1.2% | 0.67%(+0.487)#42 | 1.2%(-0.025)#9,505 |
| 43. | 05738 | 1.1% | 0.67%(+0.476)#43 | 1.2%(-0.036)#9,625 |
| 44. | 05753 | 1.1% | 0.67%(+0.471)#44 | 1.2%(-0.041)#9,669 |
| 45. | 05062 | 1.1% | 0.67%(+0.463)#45 | 1.2%(-0.049)#9,764 |
| 46. | 05489 | 1.0% | 0.67%(+0.371)#46 | 1.2%(-0.141)#10,642 |
| 47. | 05344 | 1.0% | 0.67%(+0.368)#47 | 1.2%(-0.144)#10,665 |
| 48. | 05042 | 1.0% | 0.67%(+0.334)#48 | 1.2%(-0.179)#11,030 |
| 49. | 05046 | 1.00% | 0.67%(+0.325)#49 | 1.2%(-0.187)#11,105 |
| 50. | 05301 | 0.94% | 0.67%(+0.263)#50 | 1.2%(-0.249)#11,772 |
| 51. | 05874 | 0.93% | 0.67%(+0.261)#51 | 1.2%(-0.251)#11,792 |
| 52. | 05257 | 0.93% | 0.67%(+0.254)#52 | 1.2%(-0.259)#11,877 |
| 53. | 05404 | 0.92% | 0.67%(+0.247)#53 | 1.2%(-0.266)#11,944 |
| 54. | 05828 | 0.90% | 0.67%(+0.226)#54 | 1.2%(-0.287)#12,171 |
| 55. | 05488 | 0.90% | 0.67%(+0.226)#55 | 1.2%(-0.287)#12,174 |
| 56. | 05069 | 0.88% | 0.67%(+0.212)#56 | 1.2%(-0.301)#12,320 |
| 57. | 05676 | 0.87% | 0.67%(+0.201)#57 | 1.2%(-0.311)#12,423 |
| 58. | 05819 | 0.87% | 0.67%(+0.197)#58 | 1.2%(-0.316)#12,470 |
| 59. | 05072 | 0.86% | 0.67%(+0.184)#59 | 1.2%(-0.329)#12,599 |
| 60. | 05733 | 0.84% | 0.67%(+0.169)#60 | 1.2%(-0.344)#12,751 |
| 61. | 05445 | 0.80% | 0.67%(+0.130)#61 | 1.2%(-0.383)#13,177 |
| 62. | 05650 | 0.80% | 0.67%(+0.124)#62 | 1.2%(-0.389)#13,258 |
| 63. | 05048 | 0.78% | 0.67%(+0.111)#63 | 1.2%(-0.402)#13,396 |
| 64. | 05403 | 0.75% | 0.67%(+0.076)#64 | 1.2%(-0.437)#13,774 |
| 65. | 05602 | 0.74% | 0.67%(+0.068)#65 | 1.2%(-0.445)#13,859 |
| 66. | 05743 | 0.70% | 0.67%(+0.029)#66 | 1.2%(-0.483)#14,303 |
| 67. | 05830 | 0.68% | 0.67%(+0.012)#67 | 1.2%(-0.501)#14,514 |
| 68. | 05401 | 0.68% | 0.67%(+0.003)#68 | 1.2%(-0.510)#14,600 |
| 69. | 05737 | 0.65% | 0.67%(-0.022)#69 | 1.2%(-0.534)#14,886 |
| 70. | 05855 | 0.62% | 0.67%(-0.056)#70 | 1.2%(-0.569)#15,229 |
| 71. | 05440 | 0.60% | 0.67%(-0.072)#71 | 1.2%(-0.585)#15,403 |
| 72. | 05408 | 0.58% | 0.67%(-0.089)#72 | 1.2%(-0.601)#15,583 |
| 73. | 05845 | 0.55% | 0.67%(-0.125)#73 | 1.2%(-0.638)#15,985 |
| 74. | 05829 | 0.52% | 0.67%(-0.150)#74 | 1.2%(-0.662)#16,277 |
| 75. | 05353 | 0.52% | 0.67%(-0.154)#75 | 1.2%(-0.666)#16,334 |
| 76. | 05647 | 0.52% | 0.67%(-0.156)#76 | 1.2%(-0.669)#16,363 |
| 77. | 05672 | 0.52% | 0.67%(-0.156)#77 | 1.2%(-0.669)#16,365 |
| 78. | 05001 | 0.51% | 0.67%(-0.159)#78 | 1.2%(-0.672)#16,387 |
| 79. | 05089 | 0.50% | 0.67%(-0.169)#79 | 1.2%(-0.681)#16,497 |
| 80. | 05661 | 0.50% | 0.67%(-0.171)#80 | 1.2%(-0.684)#16,528 |
| 81. | 05759 | 0.49% | 0.67%(-0.181)#81 | 1.2%(-0.694)#16,639 |
| 82. | 05477 | 0.49% | 0.67%(-0.183)#82 | 1.2%(-0.696)#16,665 |
| 83. | 05464 | 0.48% | 0.67%(-0.188)#83 | 1.2%(-0.701)#16,731 |
| 84. | 05060 | 0.48% | 0.67%(-0.193)#84 | 1.2%(-0.705)#16,773 |
| 85. | 05682 | 0.48% | 0.67%(-0.198)#85 | 1.2%(-0.710)#16,828 |
| 86. | 05656 | 0.47% | 0.67%(-0.201)#86 | 1.2%(-0.714)#16,858 |
| 87. | 05492 | 0.47% | 0.67%(-0.201)#87 | 1.2%(-0.714)#16,863 |
| 88. | 05857 | 0.46% | 0.67%(-0.211)#88 | 1.2%(-0.724)#16,977 |
| 89. | 05673 | 0.46% | 0.67%(-0.217)#89 | 1.2%(-0.730)#17,025 |
| 90. | 05853 | 0.45% | 0.67%(-0.226)#90 | 1.2%(-0.738)#17,126 |
| 91. | 05452 | 0.44% | 0.67%(-0.228)#91 | 1.2%(-0.741)#17,159 |
| 92. | 05345 | 0.41% | 0.67%(-0.260)#92 | 1.2%(-0.773)#17,490 |
| 93. | 05075 | 0.40% | 0.67%(-0.272)#93 | 1.2%(-0.784)#17,637 |
| 94. | 05734 | 0.38% | 0.67%(-0.290)#94 | 1.2%(-0.802)#17,838 |
| 95. | 05450 | 0.38% | 0.67%(-0.292)#95 | 1.2%(-0.805)#17,866 |
| 96. | 05732 | 0.37% | 0.67%(-0.301)#96 | 1.2%(-0.814)#17,979 |
| 97. | 05491 | 0.36% | 0.67%(-0.312)#97 | 1.2%(-0.824)#18,097 |
| 98. | 05033 | 0.35% | 0.67%(-0.318)#98 | 1.2%(-0.831)#18,168 |
| 99. | 05143 | 0.35% | 0.67%(-0.327)#99 | 1.2%(-0.839)#18,275 |
| 100. | 05487 | 0.31% | 0.67%(-0.363)#100 | 1.2%(-0.875)#18,650 |
Common Questions
What are the Top 10 Zip Codes with the Highest Percentage of Population Employed in Firefighting & Prevention in Vermont?
Top 10 Zip Codes with the Highest Percentage of Population Employed in Firefighting & Prevention in Vermont are:
What zip code has the Highest Percentage of Population Employed in Firefighting & Prevention in Vermont?
05850 has the Highest Percentage of Population Employed in Firefighting & Prevention in Vermont with 21.7%.
What is the Percentage of Population Employed in Firefighting & Prevention in the State of Vermont?
Percentage of Population Employed in Firefighting & Prevention in Vermont is 0.67%.
What is the Percentage of Population Employed in Firefighting & Prevention in the United States?
Percentage of Population Employed in Firefighting & Prevention in the United States is 1.2%.