Guyanese vs Immigrants from Russia 4 or more Vehicles in Household
COMPARE
Guyanese
Immigrants from Russia
4 or more Vehicles in Household
4 or more Vehicles in Household Comparison
Guyanese
Immigrants from Russia
3.5%
4 OR MORE VEHICLES IN HOUSEHOLD
0.0/ 100
METRIC RATING
342nd/ 347
METRIC RANK
5.3%
4 OR MORE VEHICLES IN HOUSEHOLD
0.2/ 100
METRIC RATING
290th/ 347
METRIC RANK
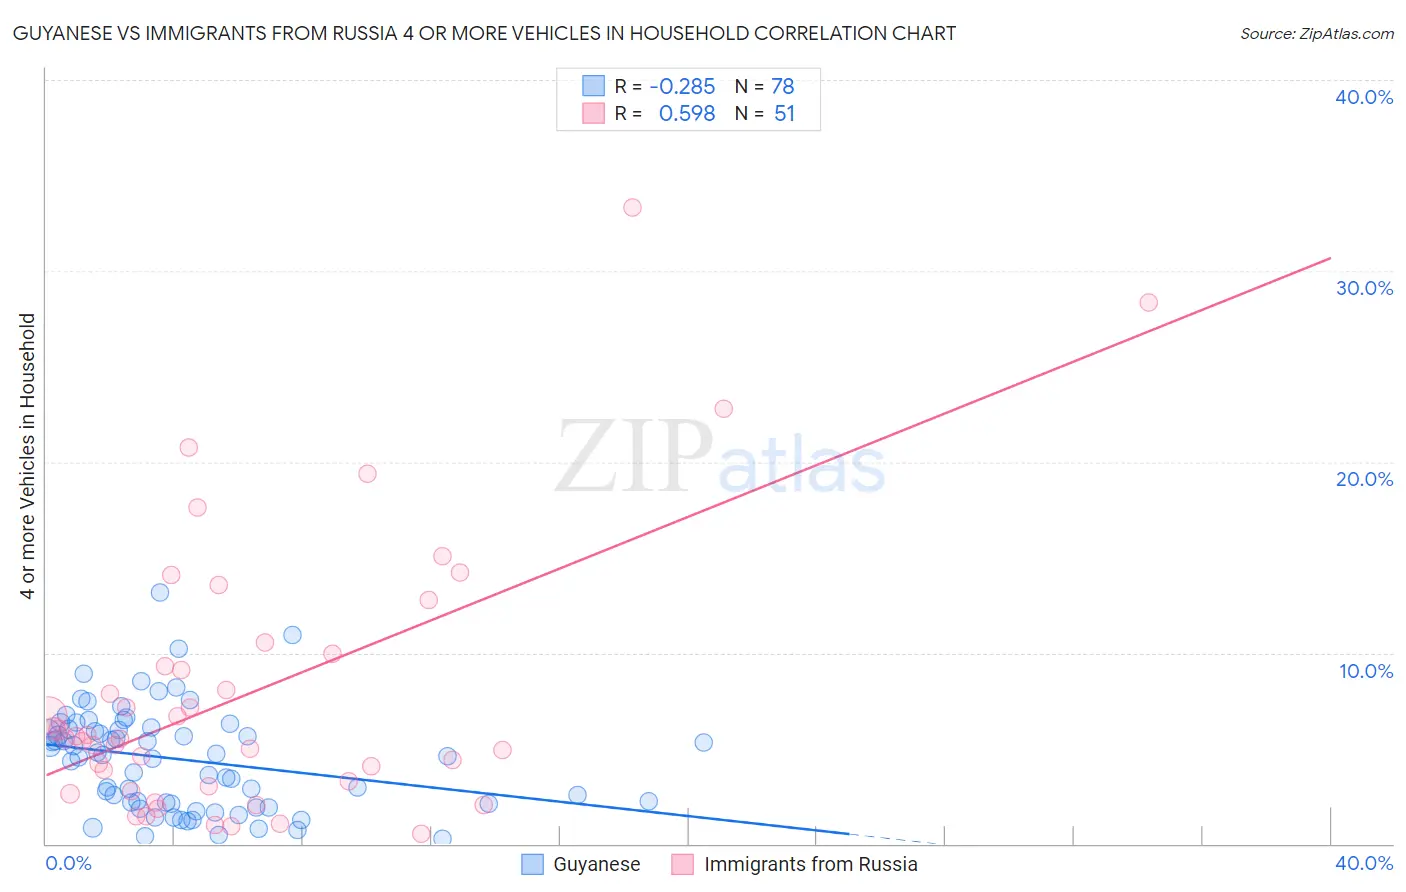
Guyanese vs Immigrants from Russia 4 or more Vehicles in Household Correlation Chart
The statistical analysis conducted on geographies consisting of 175,655,859 people shows a weak negative correlation between the proportion of Guyanese and percentage of households with 4 or more vehicles available in the United States with a correlation coefficient (R) of -0.285 and weighted average of 3.5%. Similarly, the statistical analysis conducted on geographies consisting of 346,141,133 people shows a substantial positive correlation between the proportion of Immigrants from Russia and percentage of households with 4 or more vehicles available in the United States with a correlation coefficient (R) of 0.598 and weighted average of 5.3%, a difference of 52.6%.
4 or more Vehicles in Household Correlation Summary
| Measurement | Guyanese | Immigrants from Russia |
| Minimum | 0.29% | 0.50% |
| Maximum | 13.2% | 33.3% |
| Range | 12.9% | 32.8% |
| Mean | 4.4% | 7.9% |
| Median | 4.6% | 5.5% |
| Interquartile 25% (IQ1) | 2.1% | 3.0% |
| Interquartile 75% (IQ3) | 6.0% | 9.9% |
| Interquartile Range (IQR) | 3.9% | 6.9% |
| Standard Deviation (Sample) | 2.7% | 7.1% |
| Standard Deviation (Population) | 2.7% | 7.1% |
Similar Demographics by 4 or more Vehicles in Household
Demographics Similar to Guyanese by 4 or more Vehicles in Household
In terms of 4 or more vehicles in household, the demographic groups most similar to Guyanese are Dominican (3.5%, a difference of 0.69%), British West Indian (3.5%, a difference of 0.94%), Immigrants from Guyana (3.4%, a difference of 2.6%), Immigrants from Barbados (3.6%, a difference of 3.5%), and Immigrants from Uzbekistan (3.6%, a difference of 4.1%).
| Demographics | Rating | Rank | 4 or more Vehicles in Household |
| Immigrants | Albania | 0.0 /100 | #333 | Tragic 4.1% |
| Immigrants | Trinidad and Tobago | 0.0 /100 | #334 | Tragic 4.1% |
| Barbadians | 0.0 /100 | #335 | Tragic 3.9% |
| Immigrants | Bangladesh | 0.0 /100 | #336 | Tragic 3.9% |
| Vietnamese | 0.0 /100 | #337 | Tragic 3.9% |
| Immigrants | Cabo Verde | 0.0 /100 | #338 | Tragic 3.8% |
| Immigrants | Uzbekistan | 0.0 /100 | #339 | Tragic 3.6% |
| Immigrants | Barbados | 0.0 /100 | #340 | Tragic 3.6% |
| Dominicans | 0.0 /100 | #341 | Tragic 3.5% |
| Guyanese | 0.0 /100 | #342 | Tragic 3.5% |
| British West Indians | 0.0 /100 | #343 | Tragic 3.5% |
| Immigrants | Guyana | 0.0 /100 | #344 | Tragic 3.4% |
| Immigrants | Dominican Republic | 0.0 /100 | #345 | Tragic 3.3% |
| Immigrants | St. Vincent and the Grenadines | 0.0 /100 | #346 | Tragic 3.0% |
| Immigrants | Grenada | 0.0 /100 | #347 | Tragic 2.7% |
Demographics Similar to Immigrants from Russia by 4 or more Vehicles in Household
In terms of 4 or more vehicles in household, the demographic groups most similar to Immigrants from Russia are Immigrants from Bosnia and Herzegovina (5.3%, a difference of 0.30%), Venezuelan (5.3%, a difference of 0.44%), Immigrants from Croatia (5.4%, a difference of 0.63%), Immigrants from Colombia (5.4%, a difference of 0.72%), and Immigrants from Liberia (5.4%, a difference of 0.76%).
| Demographics | Rating | Rank | 4 or more Vehicles in Household |
| Immigrants | Ireland | 0.3 /100 | #283 | Tragic 5.4% |
| Brazilians | 0.3 /100 | #284 | Tragic 5.4% |
| Immigrants | Liberia | 0.2 /100 | #285 | Tragic 5.4% |
| Immigrants | Colombia | 0.2 /100 | #286 | Tragic 5.4% |
| Immigrants | Croatia | 0.2 /100 | #287 | Tragic 5.4% |
| Venezuelans | 0.2 /100 | #288 | Tragic 5.3% |
| Immigrants | Bosnia and Herzegovina | 0.2 /100 | #289 | Tragic 5.3% |
| Immigrants | Russia | 0.2 /100 | #290 | Tragic 5.3% |
| Immigrants | Bahamas | 0.1 /100 | #291 | Tragic 5.3% |
| Liberians | 0.1 /100 | #292 | Tragic 5.3% |
| Immigrants | Congo | 0.1 /100 | #293 | Tragic 5.2% |
| Ghanaians | 0.1 /100 | #294 | Tragic 5.2% |
| Immigrants | Brazil | 0.1 /100 | #295 | Tragic 5.2% |
| Israelis | 0.1 /100 | #296 | Tragic 5.2% |
| Immigrants | Venezuela | 0.1 /100 | #297 | Tragic 5.2% |