Zip Codes with the Highest Percentage of Families with Income Below $10,000 in Missouri
RELATED REPORTS & OPTIONS
Family Income | $0-10k
Missouri
Compare Zip Codes
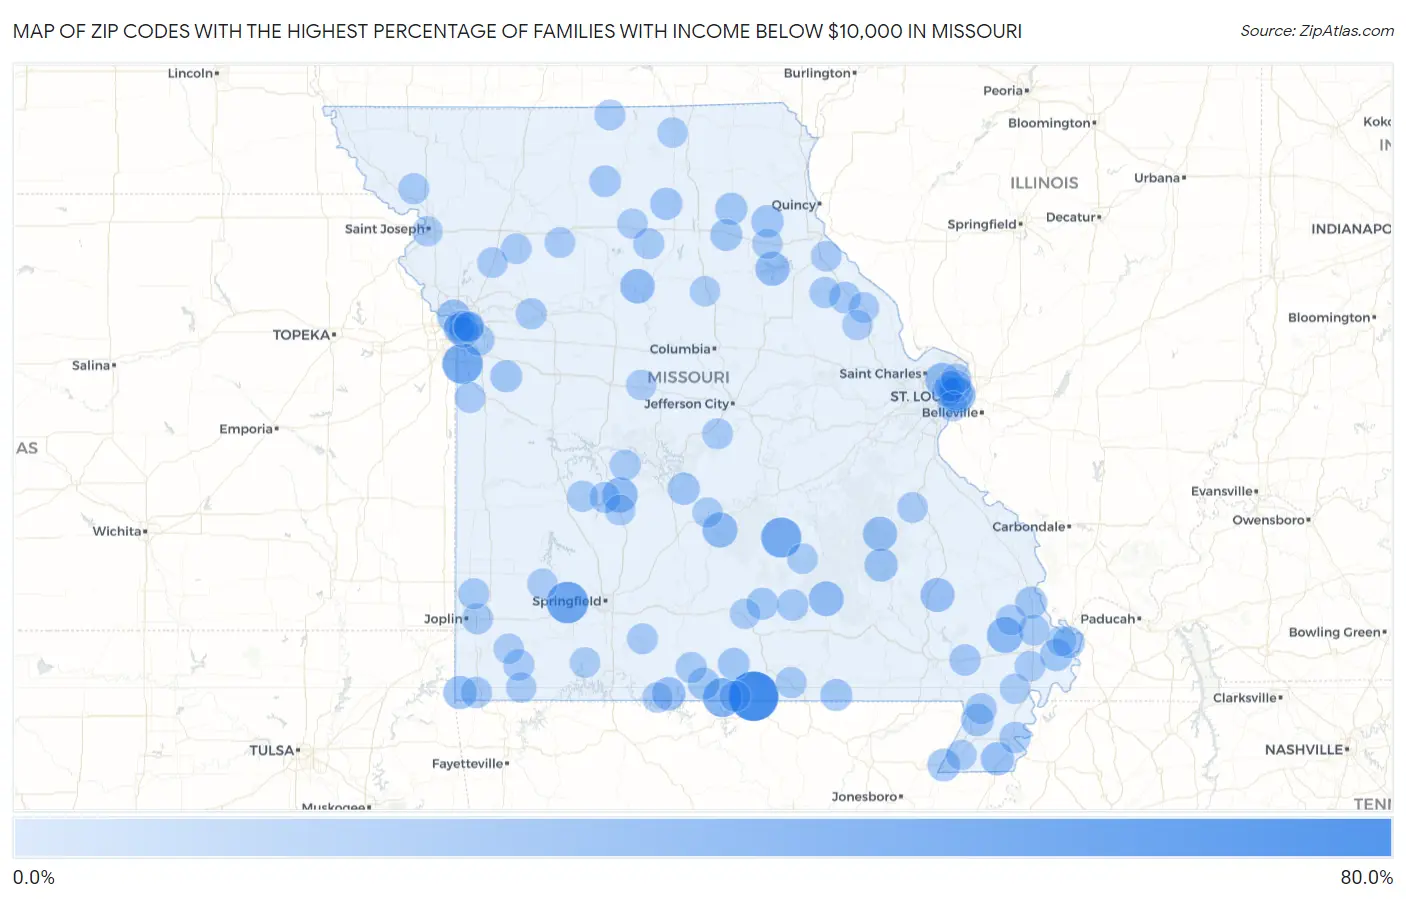
Map of Zip Codes with the Highest Percentage of Families with Income Below $10,000 in Missouri
0.0%
80.0%
Zip Codes with the Highest Percentage of Families with Income Below $10,000 in Missouri
| Zip Code | Families with Income < $10k | vs State | vs National | |
| 1. | 65777 | 71.2% | 2.8%(+68.4)#1 | 3.1%(+68.1)#25 |
| 2. | 65664 | 44.4% | 2.8%(+41.6)#2 | 3.1%(+41.3)#84 |
| 3. | 64147 | 40.3% | 2.8%(+37.5)#3 | 3.1%(+37.2)#107 |
| 4. | 65541 | 39.6% | 2.8%(+36.8)#4 | 3.1%(+36.5)#112 |
| 5. | 65766 | 35.7% | 2.8%(+32.9)#5 | 3.1%(+32.6)#140 |
| 6. | 63101 | 26.2% | 2.8%(+23.4)#6 | 3.1%(+23.1)#274 |
| 7. | 63735 | 26.0% | 2.8%(+23.2)#7 | 3.1%(+22.9)#279 |
| 8. | 65732 | 23.7% | 2.8%(+20.9)#8 | 3.1%(+20.6)#345 |
| 9. | 65534 | 23.0% | 2.8%(+20.2)#9 | 3.1%(+19.9)#372 |
| 10. | 65466 | 22.3% | 2.8%(+19.5)#10 | 3.1%(+19.2)#394 |
| 11. | 63140 | 21.4% | 2.8%(+18.6)#11 | 3.1%(+18.3)#423 |
| 12. | 65246 | 21.4% | 2.8%(+18.6)#12 | 3.1%(+18.3)#426 |
| 13. | 63623 | 20.4% | 2.8%(+17.6)#13 | 3.1%(+17.3)#460 |
| 14. | 65283 | 20.3% | 2.8%(+17.5)#14 | 3.1%(+17.2)#464 |
| 15. | 63964 | 19.6% | 2.8%(+16.8)#15 | 3.1%(+16.5)#501 |
| 16. | 64150 | 18.0% | 2.8%(+15.2)#16 | 3.1%(+14.9)#584 |
| 17. | 65761 | 17.6% | 2.8%(+14.8)#17 | 3.1%(+14.5)#613 |
| 18. | 63106 | 17.4% | 2.8%(+14.6)#18 | 3.1%(+14.3)#631 |
| 19. | 63877 | 17.4% | 2.8%(+14.6)#19 | 3.1%(+14.3)#632 |
| 20. | 64863 | 17.4% | 2.8%(+14.6)#20 | 3.1%(+14.3)#634 |
| 21. | 63654 | 17.2% | 2.8%(+14.4)#21 | 3.1%(+14.1)#649 |
| 22. | 63147 | 15.7% | 2.8%(+12.9)#22 | 3.1%(+12.6)#775 |
| 23. | 63829 | 15.2% | 2.8%(+12.4)#23 | 3.1%(+12.1)#844 |
| 24. | 63852 | 15.1% | 2.8%(+12.3)#24 | 3.1%(+12.0)#855 |
| 25. | 63820 | 14.5% | 2.8%(+11.7)#25 | 3.1%(+11.4)#919 |
| 26. | 63439 | 14.3% | 2.8%(+11.5)#26 | 3.1%(+11.2)#945 |
| 27. | 63539 | 14.0% | 2.8%(+11.2)#27 | 3.1%(+10.9)#980 |
| 28. | 65591 | 13.9% | 2.8%(+11.1)#28 | 3.1%(+10.8)#988 |
| 29. | 63451 | 13.5% | 2.8%(+10.7)#29 | 3.1%(+10.4)#1,055 |
| 30. | 65655 | 13.4% | 2.8%(+10.6)#30 | 3.1%(+10.3)#1,060 |
| 31. | 63758 | 13.3% | 2.8%(+10.5)#31 | 3.1%(+10.2)#1,075 |
| 32. | 64090 | 13.3% | 2.8%(+10.5)#32 | 3.1%(+10.2)#1,081 |
| 33. | 65778 | 13.1% | 2.8%(+10.3)#33 | 3.1%(+10.00)#1,110 |
| 34. | 63437 | 13.0% | 2.8%(+10.2)#34 | 3.1%(+9.90)#1,122 |
| 35. | 65464 | 12.8% | 2.8%(+10.00)#35 | 3.1%(+9.70)#1,175 |
| 36. | 63882 | 12.5% | 2.8%(+9.70)#36 | 3.1%(+9.40)#1,229 |
| 37. | 65637 | 12.4% | 2.8%(+9.60)#37 | 3.1%(+9.30)#1,248 |
| 38. | 65571 | 12.1% | 2.8%(+9.30)#38 | 3.1%(+9.00)#1,305 |
| 39. | 63334 | 12.0% | 2.8%(+9.20)#39 | 3.1%(+8.90)#1,325 |
| 40. | 64106 | 11.9% | 2.8%(+9.10)#40 | 3.1%(+8.80)#1,343 |
| 41. | 64646 | 11.8% | 2.8%(+9.00)#41 | 3.1%(+8.70)#1,383 |
| 42. | 63851 | 11.2% | 2.8%(+8.40)#42 | 3.1%(+8.10)#1,536 |
| 43. | 64136 | 11.2% | 2.8%(+8.40)#43 | 3.1%(+8.10)#1,538 |
| 44. | 64854 | 11.1% | 2.8%(+8.30)#44 | 3.1%(+8.00)#1,562 |
| 45. | 63936 | 11.1% | 2.8%(+8.30)#45 | 3.1%(+8.00)#1,573 |
| 46. | 64124 | 11.0% | 2.8%(+8.20)#46 | 3.1%(+7.90)#1,587 |
| 47. | 65609 | 10.8% | 2.8%(+8.00)#47 | 3.1%(+7.70)#1,669 |
| 48. | 65774 | 10.6% | 2.8%(+7.80)#48 | 3.1%(+7.50)#1,724 |
| 49. | 65773 | 10.6% | 2.8%(+7.80)#49 | 3.1%(+7.50)#1,731 |
| 50. | 63339 | 10.5% | 2.8%(+7.70)#50 | 3.1%(+7.40)#1,756 |
| 51. | 63837 | 10.4% | 2.8%(+7.60)#51 | 3.1%(+7.30)#1,788 |
| 52. | 63824 | 10.3% | 2.8%(+7.50)#52 | 3.1%(+7.20)#1,825 |
| 53. | 64658 | 10.2% | 2.8%(+7.40)#53 | 3.1%(+7.10)#1,846 |
| 54. | 64841 | 10.2% | 2.8%(+7.40)#54 | 3.1%(+7.10)#1,852 |
| 55. | 65692 | 10.1% | 2.8%(+7.30)#55 | 3.1%(+7.00)#1,887 |
| 56. | 64874 | 10.1% | 2.8%(+7.30)#56 | 3.1%(+7.00)#1,890 |
| 57. | 64036 | 10.1% | 2.8%(+7.30)#57 | 3.1%(+7.00)#1,898 |
| 58. | 63112 | 9.8% | 2.8%(+7.00)#58 | 3.1%(+6.70)#1,986 |
| 59. | 65668 | 9.8% | 2.8%(+7.00)#59 | 3.1%(+6.70)#2,010 |
| 60. | 64449 | 9.8% | 2.8%(+7.00)#60 | 3.1%(+6.70)#2,018 |
| 61. | 64849 | 9.8% | 2.8%(+7.00)#61 | 3.1%(+6.70)#2,023 |
| 62. | 65326 | 9.7% | 2.8%(+6.90)#62 | 3.1%(+6.60)#2,052 |
| 63. | 65040 | 9.5% | 2.8%(+6.70)#63 | 3.1%(+6.40)#2,131 |
| 64. | 64672 | 9.5% | 2.8%(+6.70)#64 | 3.1%(+6.40)#2,146 |
| 65. | 63344 | 9.4% | 2.8%(+6.60)#65 | 3.1%(+6.30)#2,176 |
| 66. | 64746 | 9.3% | 2.8%(+6.50)#66 | 3.1%(+6.20)#2,218 |
| 67. | 65720 | 9.3% | 2.8%(+6.50)#67 | 3.1%(+6.20)#2,228 |
| 68. | 65767 | 9.2% | 2.8%(+6.40)#68 | 3.1%(+6.10)#2,274 |
| 69. | 64128 | 9.1% | 2.8%(+6.30)#69 | 3.1%(+6.00)#2,301 |
| 70. | 63653 | 9.1% | 2.8%(+6.30)#70 | 3.1%(+6.00)#2,333 |
| 71. | 64108 | 9.0% | 2.8%(+6.20)#71 | 3.1%(+5.90)#2,369 |
| 72. | 64656 | 9.0% | 2.8%(+6.20)#72 | 3.1%(+5.90)#2,395 |
| 73. | 63867 | 8.9% | 2.8%(+6.10)#73 | 3.1%(+5.80)#2,436 |
| 74. | 64650 | 8.9% | 2.8%(+6.10)#74 | 3.1%(+5.80)#2,438 |
| 75. | 63120 | 8.8% | 2.8%(+6.00)#75 | 3.1%(+5.70)#2,469 |
| 76. | 63459 | 8.8% | 2.8%(+6.00)#76 | 3.1%(+5.70)#2,473 |
| 77. | 63771 | 8.8% | 2.8%(+6.00)#77 | 3.1%(+5.70)#2,475 |
| 78. | 65733 | 8.8% | 2.8%(+6.00)#78 | 3.1%(+5.70)#2,488 |
| 79. | 64465 | 8.6% | 2.8%(+5.80)#79 | 3.1%(+5.50)#2,581 |
| 80. | 64125 | 8.6% | 2.8%(+5.80)#80 | 3.1%(+5.50)#2,590 |
| 81. | 63876 | 8.6% | 2.8%(+5.80)#81 | 3.1%(+5.50)#2,592 |
| 82. | 65501 | 8.6% | 2.8%(+5.80)#82 | 3.1%(+5.50)#2,624 |
| 83. | 64126 | 8.5% | 2.8%(+5.70)#83 | 3.1%(+5.40)#2,649 |
| 84. | 63377 | 8.4% | 2.8%(+5.60)#84 | 3.1%(+5.30)#2,738 |
| 85. | 65689 | 8.3% | 2.8%(+5.50)#85 | 3.1%(+5.20)#2,792 |
| 86. | 65656 | 8.3% | 2.8%(+5.50)#86 | 3.1%(+5.20)#2,793 |
| 87. | 65348 | 8.3% | 2.8%(+5.50)#87 | 3.1%(+5.20)#2,804 |
| 88. | 65752 | 8.3% | 2.8%(+5.50)#88 | 3.1%(+5.20)#2,819 |
| 89. | 63137 | 8.2% | 2.8%(+5.40)#89 | 3.1%(+5.10)#2,845 |
| 90. | 64628 | 8.2% | 2.8%(+5.40)#90 | 3.1%(+5.10)#2,861 |
| 91. | 65772 | 8.2% | 2.8%(+5.40)#91 | 3.1%(+5.10)#2,870 |
| 92. | 63862 | 8.2% | 2.8%(+5.40)#92 | 3.1%(+5.10)#2,880 |
| 93. | 64866 | 8.1% | 2.8%(+5.30)#93 | 3.1%(+5.00)#2,933 |
| 94. | 63443 | 8.1% | 2.8%(+5.30)#94 | 3.1%(+5.00)#2,943 |
| 95. | 64503 | 8.0% | 2.8%(+5.20)#95 | 3.1%(+4.90)#2,961 |
| 96. | 63834 | 8.0% | 2.8%(+5.20)#96 | 3.1%(+4.90)#2,975 |
| 97. | 65556 | 8.0% | 2.8%(+5.20)#97 | 3.1%(+4.90)#2,976 |
| 98. | 63567 | 8.0% | 2.8%(+5.20)#98 | 3.1%(+4.90)#3,012 |
| 99. | 65278 | 8.0% | 2.8%(+5.20)#99 | 3.1%(+4.90)#3,014 |
| 100. | 63111 | 7.9% | 2.8%(+5.10)#100 | 3.1%(+4.80)#3,026 |
Common Questions
What are the Top 10 Zip Codes with the Highest Percentage of Families with Income Below $10,000 in Missouri?
Top 10 Zip Codes with the Highest Percentage of Families with Income Below $10,000 in Missouri are:
What zip code has the Highest Percentage of Families with Income Below $10,000 in Missouri?
65777 has the Highest Percentage of Families with Income Below $10,000 in Missouri with 71.2%.
What is the Percentage of Families with Income Below $10,000 in the State of Missouri?
Percentage of Families with Income Below $10,000 in Missouri is 2.8%.
What is the Percentage of Families with Income Below $10,000 in the United States?
Percentage of Families with Income Below $10,000 in the United States is 3.1%.