Zip Codes with the Highest Percentage of Families with Income Below $10,000 in Alaska
RELATED REPORTS & OPTIONS
Family Income | $0-10k
Alaska
Compare Zip Codes
Map of Zip Codes with the Highest Percentage of Families with Income Below $10,000 in Alaska
0.0%
80.0%
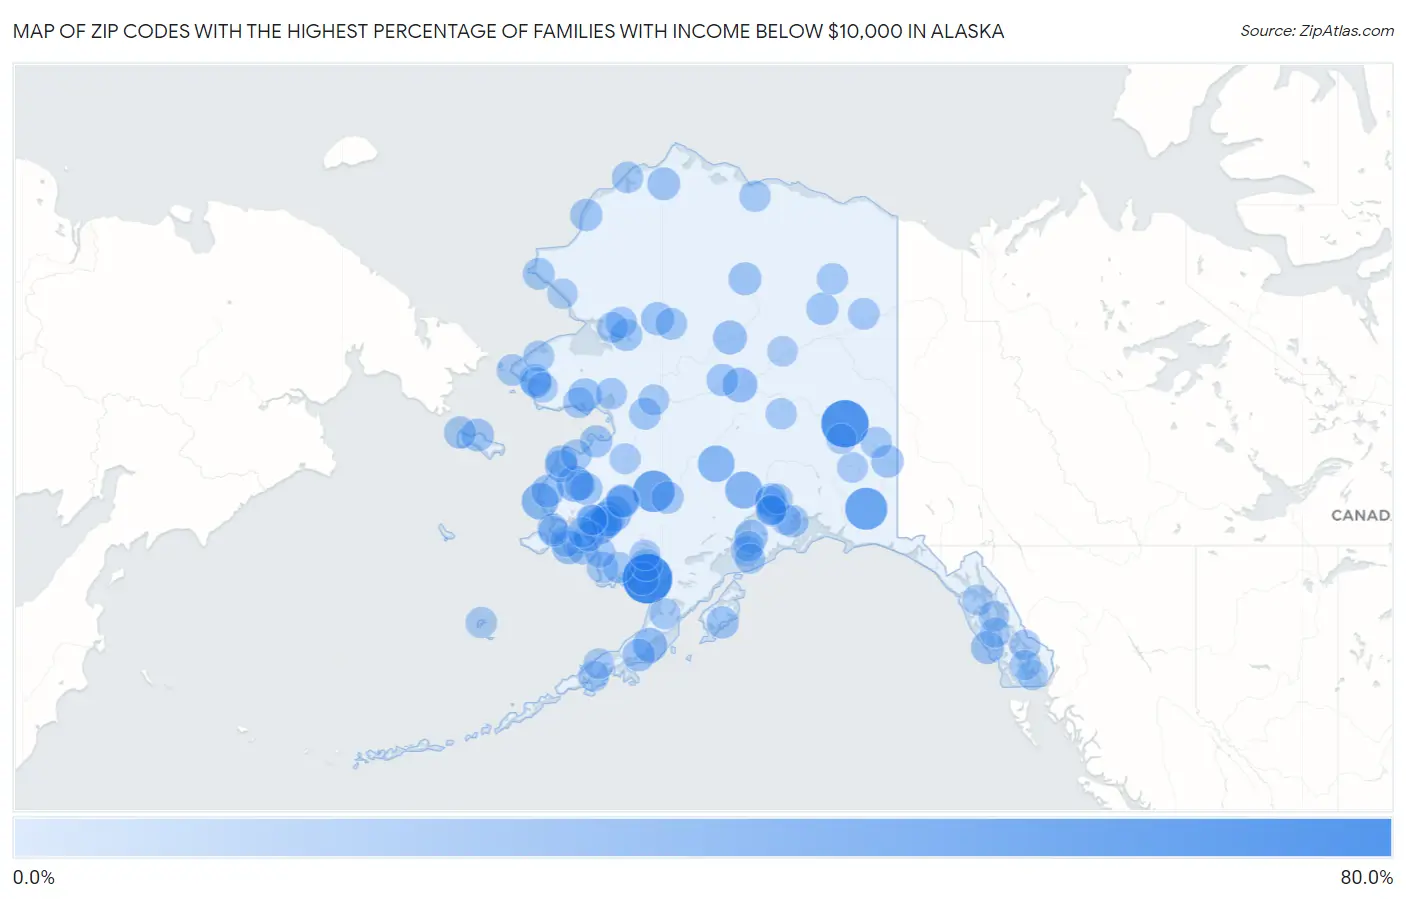
Zip Codes with the Highest Percentage of Families with Income Below $10,000 in Alaska
| Zip Code | Families with Income < $10k | vs State | vs National | |
| 1. | 99569 | 75.0% | 2.3% (+72.7)#1 | 3.1% (+71.9)#21 |
| 2. | 99706 | 66.7% | 2.3% (+64.4)#2 | 3.1% (+63.6)#29 |
| 3. | 99566 | 46.7% | 2.3% (+44.4)#3 | 3.1% (+43.6)#74 |
| 4. | 99575 | 44.4% | 2.3% (+42.1)#4 | 3.1% (+41.3)#85 |
| 5. | 99667 | 28.0% | 2.3% (+25.7)#5 | 3.1% (+24.9)#227 |
| 6. | 99691 | 26.1% | 2.3% (+23.8)#6 | 3.1% (+23.0)#277 |
| 7. | 99604 | 25.9% | 2.3% (+23.6)#7 | 3.1% (+22.8)#282 |
| 8. | 99634 | 25.0% | 2.3% (+22.7)#8 | 3.1% (+21.9)#302 |
| 9. | 99632 | 24.1% | 2.3% (+21.8)#9 | 3.1% (+21.0)#329 |
| 10. | 99679 | 22.2% | 2.3% (+19.9)#10 | 3.1% (+19.1)#397 |
| 11. | 99551 | 20.0% | 2.3% (+17.7)#11 | 3.1% (+16.9)#475 |
| 12. | 99777 | 18.8% | 2.3% (+16.5)#12 | 3.1% (+15.7)#543 |
| 13. | 99564 | 17.6% | 2.3% (+15.3)#13 | 3.1% (+14.5)#621 |
| 14. | 99626 | 16.7% | 2.3% (+14.4)#14 | 3.1% (+13.6)#692 |
| 15. | 99720 | 16.3% | 2.3% (+14.0)#15 | 3.1% (+13.2)#733 |
| 16. | 99614 | 14.9% | 2.3% (+12.6)#16 | 3.1% (+11.8)#874 |
| 17. | 99610 | 14.3% | 2.3% (+12.0)#17 | 3.1% (+11.2)#936 |
| 18. | 99739 | 13.7% | 2.3% (+11.4)#18 | 3.1% (+10.6)#1,024 |
| 19. | 99836 | 13.3% | 2.3% (+11.0)#19 | 3.1% (+10.2)#1,084 |
| 20. | 99786 | 13.1% | 2.3% (+10.8)#20 | 3.1% (+10.00)#1,111 |
| 21. | 99769 | 12.2% | 2.3% (+9.90)#21 | 3.1% (+9.10)#1,289 |
| 22. | 99721 | 12.1% | 2.3% (+9.80)#22 | 3.1% (+9.00)#1,312 |
| 23. | 99791 | 12.1% | 2.3% (+9.80)#23 | 3.1% (+9.00)#1,315 |
| 24. | 99628 | 11.9% | 2.3% (+9.60)#24 | 3.1% (+8.80)#1,362 |
| 25. | 99662 | 11.8% | 2.3% (+9.50)#25 | 3.1% (+8.70)#1,381 |
| 26. | 99621 | 11.5% | 2.3% (+9.20)#26 | 3.1% (+8.40)#1,462 |
| 27. | 99554 | 11.1% | 2.3% (+8.80)#27 | 3.1% (+8.00)#1,569 |
| 28. | 99764 | 11.1% | 2.3% (+8.80)#28 | 3.1% (+8.00)#1,574 |
| 29. | 99648 | 11.1% | 2.3% (+8.80)#29 | 3.1% (+8.00)#1,580 |
| 30. | 99650 | 10.8% | 2.3% (+8.50)#30 | 3.1% (+7.70)#1,671 |
| 31. | 99668 | 10.5% | 2.3% (+8.20)#31 | 3.1% (+7.40)#1,771 |
| 32. | 99781 | 10.3% | 2.3% (+8.00)#32 | 3.1% (+7.20)#1,827 |
| 33. | 99693 | 10.0% | 2.3% (+7.70)#33 | 3.1% (+6.90)#1,932 |
| 34. | 99659 | 10.0% | 2.3% (+7.70)#34 | 3.1% (+6.90)#1,933 |
| 35. | 99759 | 10.0% | 2.3% (+7.70)#35 | 3.1% (+6.90)#1,936 |
| 36. | 99555 | 10.0% | 2.3% (+7.70)#36 | 3.1% (+6.90)#1,940 |
| 37. | 99768 | 9.8% | 2.3% (+7.50)#37 | 3.1% (+6.70)#2,024 |
| 38. | 99643 | 9.8% | 2.3% (+7.50)#38 | 3.1% (+6.70)#2,025 |
| 39. | 99742 | 9.6% | 2.3% (+7.30)#39 | 3.1% (+6.50)#2,098 |
| 40. | 99770 | 9.3% | 2.3% (+7.00)#40 | 3.1% (+6.20)#2,230 |
| 41. | 99581 | 8.7% | 2.3% (+6.40)#41 | 3.1% (+5.60)#2,538 |
| 42. | 99785 | 8.7% | 2.3% (+6.40)#42 | 3.1% (+5.60)#2,544 |
| 43. | 99607 | 8.7% | 2.3% (+6.40)#43 | 3.1% (+5.60)#2,551 |
| 44. | 99751 | 8.7% | 2.3% (+6.40)#44 | 3.1% (+5.60)#2,553 |
| 45. | 99766 | 8.5% | 2.3% (+6.20)#45 | 3.1% (+5.40)#2,687 |
| 46. | 99748 | 8.5% | 2.3% (+6.20)#46 | 3.1% (+5.40)#2,697 |
| 47. | 99740 | 7.9% | 2.3% (+5.60)#47 | 3.1% (+4.80)#3,068 |
| 48. | 99622 | 7.8% | 2.3% (+5.50)#48 | 3.1% (+4.70)#3,116 |
| 49. | 99783 | 7.5% | 2.3% (+5.20)#49 | 3.1% (+4.40)#3,323 |
| 50. | 99589 | 7.4% | 2.3% (+5.10)#50 | 3.1% (+4.30)#3,388 |
| 51. | 99749 | 7.2% | 2.3% (+4.90)#51 | 3.1% (+4.10)#3,527 |
| 52. | 99782 | 7.1% | 2.3% (+4.80)#52 | 3.1% (+4.00)#3,605 |
| 53. | 99753 | 6.8% | 2.3% (+4.50)#53 | 3.1% (+3.70)#3,875 |
| 54. | 99722 | 6.8% | 2.3% (+4.50)#54 | 3.1% (+3.70)#3,881 |
| 55. | 99678 | 6.7% | 2.3% (+4.40)#55 | 3.1% (+3.60)#3,961 |
| 56. | 99789 | 6.6% | 2.3% (+4.30)#56 | 3.1% (+3.50)#4,075 |
| 57. | 99620 | 6.5% | 2.3% (+4.20)#57 | 3.1% (+3.40)#4,173 |
| 58. | 99780 | 6.3% | 2.3% (+4.00)#58 | 3.1% (+3.20)#4,367 |
| 59. | 99660 | 6.1% | 2.3% (+3.80)#59 | 3.1% (+3.00)#4,626 |
| 60. | 99744 | 6.1% | 2.3% (+3.80)#60 | 3.1% (+3.00)#4,630 |
| 61. | 99763 | 6.0% | 2.3% (+3.70)#61 | 3.1% (+2.90)#4,746 |
| 62. | 99694 | 5.9% | 2.3% (+3.60)#62 | 3.1% (+2.80)#4,859 |
| 63. | 99561 | 5.7% | 2.3% (+3.40)#63 | 3.1% (+2.60)#5,121 |
| 64. | 99784 | 5.7% | 2.3% (+3.40)#64 | 3.1% (+2.60)#5,134 |
| 65. | 99505 | 5.6% | 2.3% (+3.30)#65 | 3.1% (+2.50)#5,210 |
| 66. | 99772 | 5.6% | 2.3% (+3.30)#66 | 3.1% (+2.50)#5,271 |
| 67. | 99609 | 5.6% | 2.3% (+3.30)#67 | 3.1% (+2.50)#5,280 |
| 68. | 99778 | 5.5% | 2.3% (+3.20)#68 | 3.1% (+2.40)#5,420 |
| 69. | 99765 | 5.3% | 2.3% (+3.00)#69 | 3.1% (+2.20)#5,738 |
| 70. | 99649 | 5.3% | 2.3% (+3.00)#70 | 3.1% (+2.20)#5,744 |
| 71. | 99655 | 4.8% | 2.3% (+2.50)#71 | 3.1% (+1.70)#6,563 |
| 72. | 99829 | 4.8% | 2.3% (+2.50)#72 | 3.1% (+1.70)#6,571 |
| 73. | 99658 | 4.7% | 2.3% (+2.40)#73 | 3.1% (+1.60)#6,766 |
| 74. | 99820 | 4.6% | 2.3% (+2.30)#74 | 3.1% (+1.50)#6,971 |
| 75. | 99556 | 4.5% | 2.3% (+2.20)#75 | 3.1% (+1.40)#7,102 |
| 76. | 99612 | 4.5% | 2.3% (+2.20)#76 | 3.1% (+1.40)#7,146 |
| 77. | 99680 | 4.5% | 2.3% (+2.20)#77 | 3.1% (+1.40)#7,155 |
| 78. | 99571 | 4.5% | 2.3% (+2.20)#78 | 3.1% (+1.40)#7,177 |
| 79. | 99652 | 4.4% | 2.3% (+2.10)#79 | 3.1% (+1.30)#7,309 |
| 80. | 99929 | 4.4% | 2.3% (+2.10)#80 | 3.1% (+1.30)#7,335 |
| 81. | 99590 | 4.4% | 2.3% (+2.10)#81 | 3.1% (+1.30)#7,388 |
| 82. | 99576 | 4.0% | 2.3% (+1.70)#82 | 3.1% (+0.900)#8,285 |
| 83. | 99587 | 4.0% | 2.3% (+1.70)#83 | 3.1% (+0.900)#8,301 |
| 84. | 99926 | 3.9% | 2.3% (+1.60)#84 | 3.1% (+0.800)#8,589 |
| 85. | 99639 | 3.8% | 2.3% (+1.50)#85 | 3.1% (+0.700)#8,858 |
| 86. | 99681 | 3.8% | 2.3% (+1.50)#86 | 3.1% (+0.700)#8,897 |
| 87. | 99586 | 3.8% | 2.3% (+1.50)#87 | 3.1% (+0.700)#8,906 |
| 88. | 99508 | 3.7% | 2.3% (+1.40)#88 | 3.1% (+0.600)#8,956 |
| 89. | 99637 | 3.7% | 2.3% (+1.40)#89 | 3.1% (+0.600)#9,172 |
| 90. | 99701 | 3.5% | 2.3% (+1.20)#90 | 3.1% (+0.400)#9,550 |
| 91. | 99654 | 3.3% | 2.3% (+1.00)#91 | 3.1% (+0.200)#10,111 |
| 92. | 99750 | 3.3% | 2.3% (+1.00)#92 | 3.1% (+0.200)#10,376 |
| 93. | 99830 | 3.3% | 2.3% (+1.00)#93 | 3.1% (+0.200)#10,382 |
| 94. | 99762 | 3.2% | 2.3% (+0.900)#94 | 3.1% (+0.100)#10,614 |
| 95. | 99901 | 3.1% | 2.3% (+0.800)#95 | 3.1% (=0.000)#10,872 |
| 96. | 99603 | 3.1% | 2.3% (+0.800)#96 | 3.1% (=0.000)#10,892 |
| 97. | 99559 | 3.1% | 2.3% (+0.800)#97 | 3.1% (=0.000)#10,915 |
| 98. | 99737 | 3.1% | 2.3% (+0.800)#98 | 3.1% (=0.000)#10,946 |
| 99. | 99501 | 3.0% | 2.3% (+0.700)#99 | 3.1% (-0.100)#11,183 |
| 100. | 99641 | 3.0% | 2.3% (+0.700)#100 | 3.1% (-0.100)#11,376 |
Common Questions
What are the Top 10 Zip Codes with the Highest Percentage of Families with Income Below $10,000 in Alaska?
Top 10 Zip Codes with the Highest Percentage of Families with Income Below $10,000 in Alaska are:
What zip code has the Highest Percentage of Families with Income Below $10,000 in Alaska?
99569 has the Highest Percentage of Families with Income Below $10,000 in Alaska with 75.0%.
What is the Percentage of Families with Income Below $10,000 in the State of Alaska?
Percentage of Families with Income Below $10,000 in Alaska is 2.3%.
What is the Percentage of Families with Income Below $10,000 in the United States?
Percentage of Families with Income Below $10,000 in the United States is 3.1%.