Zip Codes with the Highest Percentage of Population Employed in Agriculture, Fishing & Hunting in Lufkin, TX
RELATED REPORTS & OPTIONS
Agriculture, Fishing & Hunting
Lufkin
Compare Zip Codes
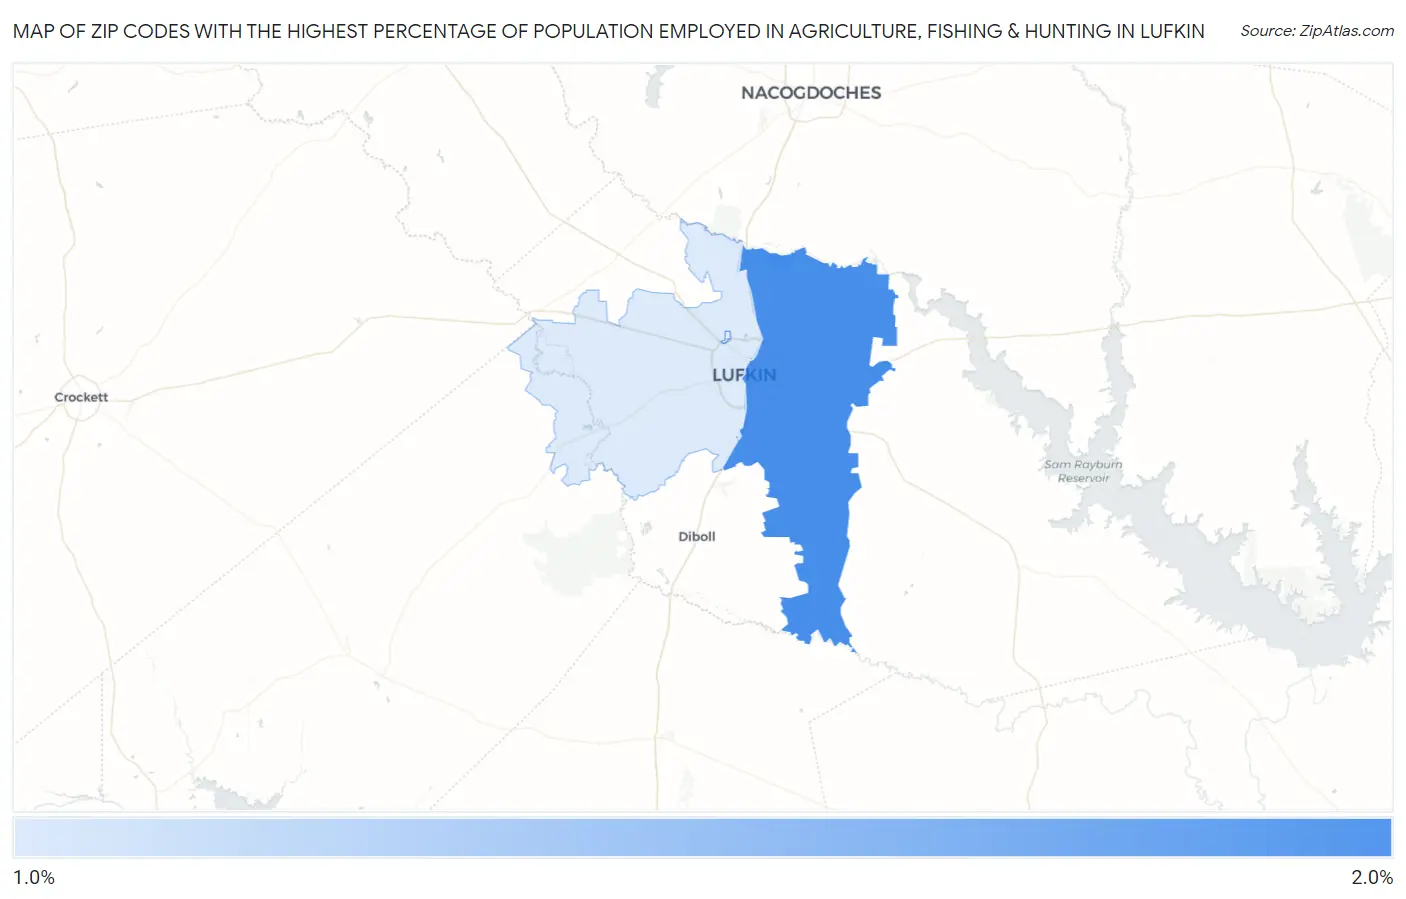
Map of Zip Codes with the Highest Percentage of Population Employed in Agriculture, Fishing & Hunting in Lufkin
1.5%
2.0%
Zip Codes with the Highest Percentage of Population Employed in Agriculture, Fishing & Hunting in Lufkin, TX
| Zip Code | % Employed | vs State | vs National | |
| 1. | 75901 | 2.0% | 0.75%(+1.20)#671 | 1.2%(+0.754)#12,890 |
| 2. | 75904 | 1.5% | 0.75%(+0.709)#766 | 1.2%(+0.261)#14,437 |
1
Common Questions
What are the Top Zip Codes with the Highest Percentage of Population Employed in Agriculture, Fishing & Hunting in Lufkin, TX?
Top Zip Codes with the Highest Percentage of Population Employed in Agriculture, Fishing & Hunting in Lufkin, TX are:
What zip code has the Highest Percentage of Population Employed in Agriculture, Fishing & Hunting in Lufkin, TX?
75901 has the Highest Percentage of Population Employed in Agriculture, Fishing & Hunting in Lufkin, TX with 2.0%.
What is the Percentage of Population Employed in Agriculture, Fishing & Hunting in Lufkin, TX?
Percentage of Population Employed in Agriculture, Fishing & Hunting in Lufkin is 2.4%.
What is the Percentage of Population Employed in Agriculture, Fishing & Hunting in Texas?
Percentage of Population Employed in Agriculture, Fishing & Hunting in Texas is 0.75%.
What is the Percentage of Population Employed in Agriculture, Fishing & Hunting in the United States?
Percentage of Population Employed in Agriculture, Fishing & Hunting in the United States is 1.2%.