Zip Codes with the Highest Percentage of Households Without a Vehicle in Lubbock, TX
RELATED REPORTS & OPTIONS
Households without a Cars
Lubbock
Compare Zip Codes
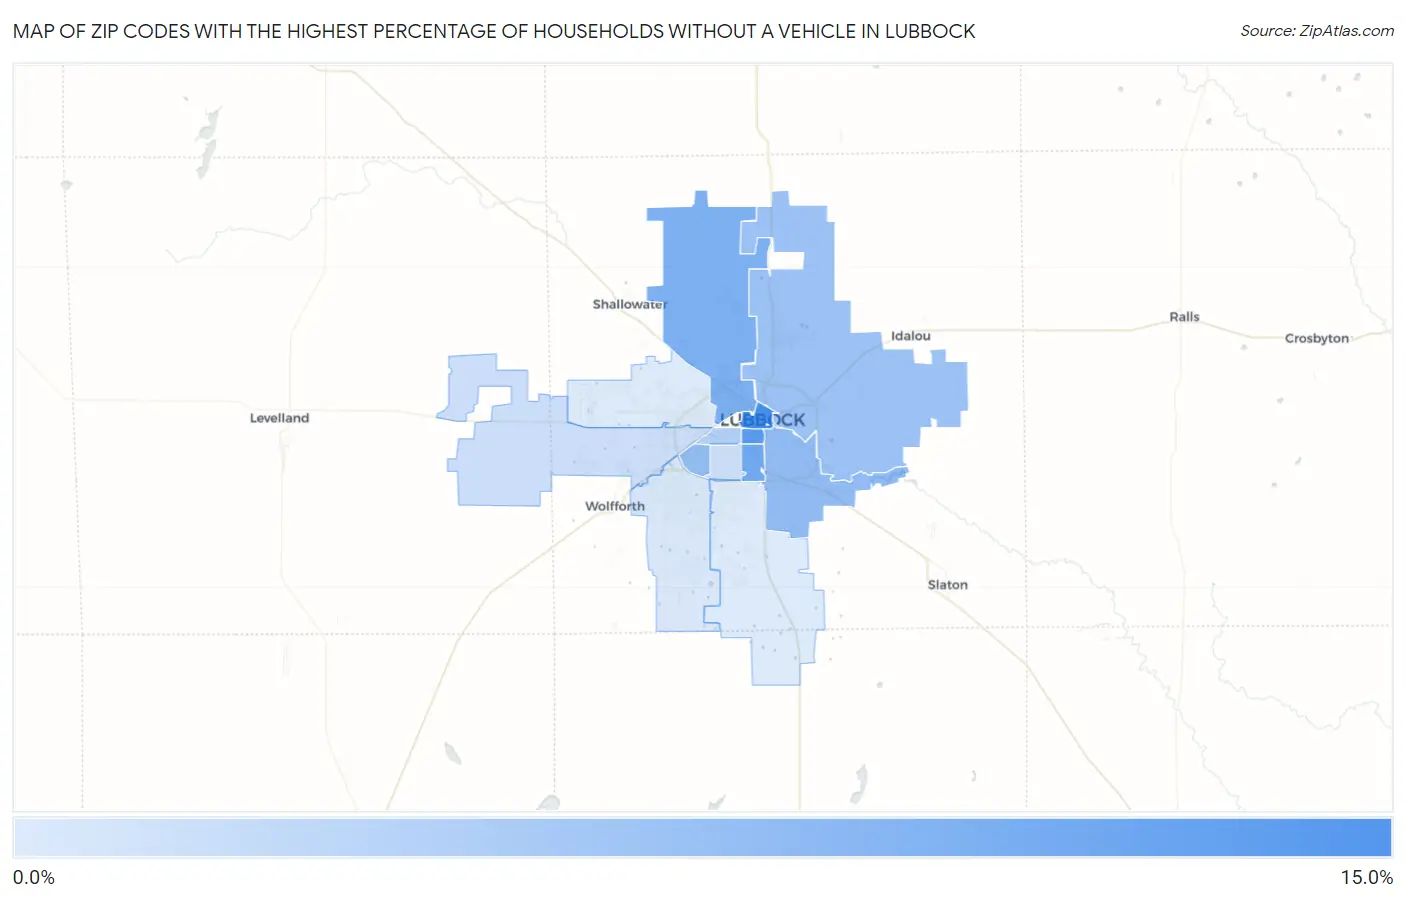
Map of Zip Codes with the Highest Percentage of Households Without a Vehicle in Lubbock
3.1%
14.9%
Zip Codes with the Highest Percentage of Households Without a Vehicle in Lubbock, TX
| Zip Code | Housholds Without a Car | vs State | vs National | |
| 1. | 79401 | 14.9% | 5.3%(+9.60)#84 | 8.3%(+6.60)#2,415 |
| 2. | 79411 | 13.4% | 5.3%(+8.10)#112 | 8.3%(+5.10)#2,928 |
| 3. | 79412 | 11.3% | 5.3%(+6.00)#178 | 8.3%(+3.00)#3,951 |
| 4. | 79415 | 10.5% | 5.3%(+5.20)#209 | 8.3%(+2.20)#4,462 |
| 5. | 79404 | 9.0% | 5.3%(+3.70)#280 | 8.3%(+0.700)#5,765 |
| 6. | 79414 | 8.8% | 5.3%(+3.50)#286 | 8.3%(+0.500)#5,967 |
| 7. | 79403 | 8.2% | 5.3%(+2.90)#323 | 8.3%(-0.100)#6,671 |
| 8. | 79410 | 6.3% | 5.3%(+1.00)#495 | 8.3%(-2.00)#9,845 |
| 9. | 79407 | 4.4% | 5.3%(-0.900)#779 | 8.3%(-3.90)#14,514 |
| 10. | 79413 | 4.3% | 5.3%(-1.00)#802 | 8.3%(-4.00)#14,815 |
| 11. | 79424 | 3.4% | 5.3%(-1.90)#962 | 8.3%(-4.90)#17,607 |
| 12. | 79423 | 3.1% | 5.3%(-2.20)#1,042 | 8.3%(-5.20)#18,693 |
| 13. | 79416 | 3.1% | 5.3%(-2.20)#1,043 | 8.3%(-5.20)#18,709 |
1
Common Questions
What are the Top 10 Zip Codes with the Highest Percentage of Households Without a Vehicle in Lubbock, TX?
Top 10 Zip Codes with the Highest Percentage of Households Without a Vehicle in Lubbock, TX are:
What zip code has the Highest Percentage of Households Without a Vehicle in Lubbock, TX?
79401 has the Highest Percentage of Households Without a Vehicle in Lubbock, TX with 14.9%.
What is the Percentage of Households Without a Vehicle in Lubbock, TX?
Percentage of Households Without a Vehicle in Lubbock is 6.2%.
What is the Percentage of Households Without a Vehicle in Texas?
Percentage of Households Without a Vehicle in Texas is 5.3%.
What is the Percentage of Households Without a Vehicle in the United States?
Percentage of Households Without a Vehicle in the United States is 8.3%.