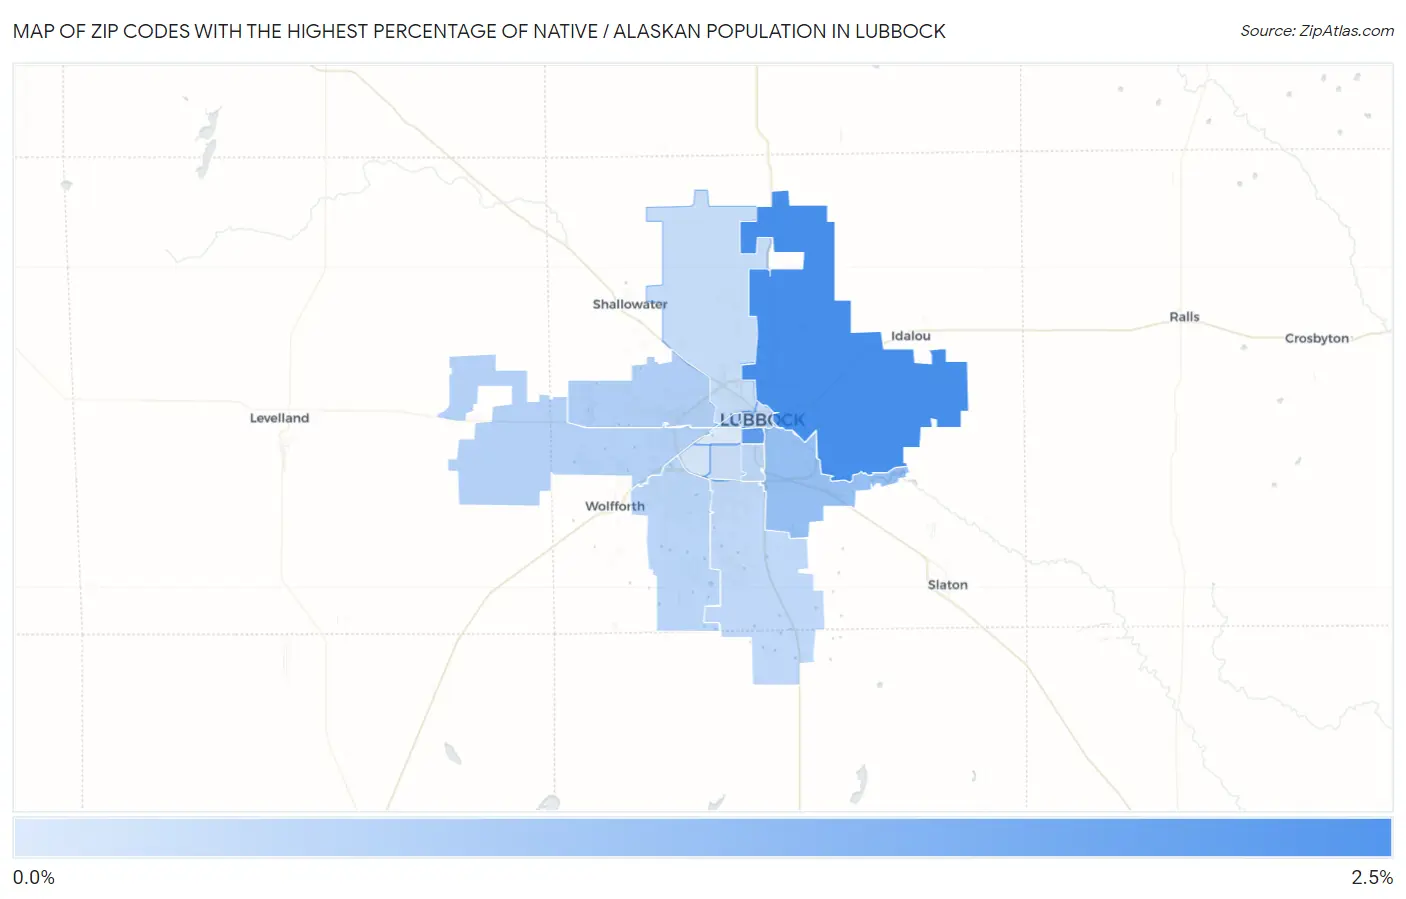
Zip Codes with the Highest Percentage of Native / Alaskan Population in Lubbock, TX
RELATED REPORTS & OPTIONS
Native / Alaskan
Lubbock
Compare Zip Codes
Map of Zip Codes with the Highest Percentage of Native / Alaskan Population in Lubbock
0.086%
2.3%
Zip Codes with the Highest Percentage of Native / Alaskan Population in Lubbock, TX
| Zip Code | Native / Alaskan | vs State | vs National | |
| 1. | 79403 | 2.3% | 0.58%(+1.74)#63 | 0.84%(+1.47)#2,635 |
| 2. | 79411 | 1.9% | 0.58%(+1.36)#89 | 0.84%(+1.10)#3,051 |
| 3. | 79404 | 1.2% | 0.58%(+0.573)#237 | 0.84%(+0.311)#4,655 |
| 4. | 79416 | 0.78% | 0.58%(+0.197)#400 | 0.84%(-0.065)#6,276 |
| 5. | 79406 | 0.76% | 0.58%(+0.180)#416 | 0.84%(-0.082)#6,387 |
| 6. | 79407 | 0.69% | 0.58%(+0.106)#473 | 0.84%(-0.156)#6,869 |
| 7. | 79424 | 0.60% | 0.58%(+0.025)#527 | 0.84%(-0.237)#7,474 |
| 8. | 79412 | 0.57% | 0.58%(-0.006)#550 | 0.84%(-0.268)#7,695 |
| 9. | 79423 | 0.53% | 0.58%(-0.055)#583 | 0.84%(-0.317)#8,083 |
| 10. | 79401 | 0.43% | 0.58%(-0.145)#687 | 0.84%(-0.407)#9,017 |
| 11. | 79415 | 0.42% | 0.58%(-0.164)#707 | 0.84%(-0.426)#9,236 |
| 12. | 79413 | 0.37% | 0.58%(-0.210)#772 | 0.84%(-0.472)#9,808 |
| 13. | 79414 | 0.18% | 0.58%(-0.397)#1,040 | 0.84%(-0.659)#13,143 |
| 14. | 79410 | 0.086% | 0.58%(-0.494)#1,187 | 0.84%(-0.756)#15,669 |
1
Common Questions
What are the Top 10 Zip Codes with the Highest Percentage of Native / Alaskan Population in Lubbock, TX?
Top 10 Zip Codes with the Highest Percentage of Native / Alaskan Population in Lubbock, TX are:
What zip code has the Highest Percentage of Native / Alaskan Population in Lubbock, TX?
79403 has the Highest Percentage of Native / Alaskan Population in Lubbock, TX with 2.3%.
What is the Percentage of Native / Alaskan Population in Lubbock, TX?
Percentage of Native / Alaskan Population in Lubbock is 0.63%.
What is the Percentage of Native / Alaskan Population in Texas?
Percentage of Native / Alaskan Population in Texas is 0.58%.
What is the Percentage of Native / Alaskan Population in the United States?
Percentage of Native / Alaskan Population in the United States is 0.84%.