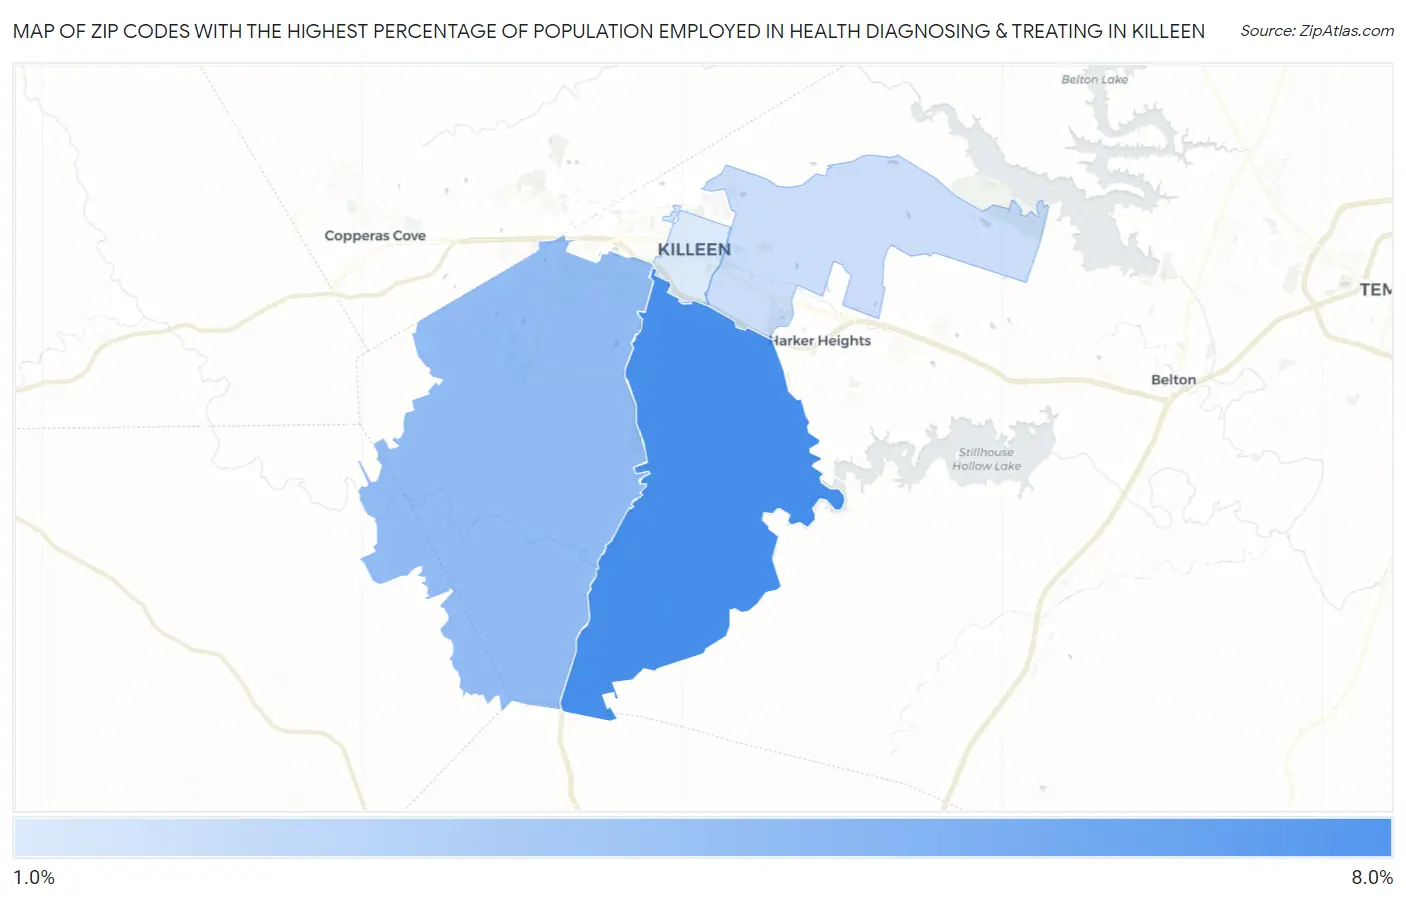
Zip Codes with the Highest Percentage of Population Employed in Health Diagnosing & Treating in Killeen, TX
RELATED REPORTS & OPTIONS
Health Diagnosing & Treating
Killeen
Compare Zip Codes
Map of Zip Codes with the Highest Percentage of Population Employed in Health Diagnosing & Treating in Killeen
1.8%
7.6%
Zip Codes with the Highest Percentage of Population Employed in Health Diagnosing & Treating in Killeen, TX
| Zip Code | % Employed | vs State | vs National | |
| 1. | 76542 | 7.6% | 5.5%(+2.12)#365 | 6.2%(+1.40)#8,400 |
| 2. | 76549 | 4.8% | 5.5%(-0.760)#883 | 6.2%(-1.49)#18,658 |
| 3. | 76543 | 2.5% | 5.5%(-2.98)#1,379 | 6.2%(-3.71)#25,441 |
| 4. | 76541 | 1.8% | 5.5%(-3.68)#1,503 | 6.2%(-4.41)#26,740 |
1
Common Questions
What are the Top 3 Zip Codes with the Highest Percentage of Population Employed in Health Diagnosing & Treating in Killeen, TX?
Top 3 Zip Codes with the Highest Percentage of Population Employed in Health Diagnosing & Treating in Killeen, TX are:
What zip code has the Highest Percentage of Population Employed in Health Diagnosing & Treating in Killeen, TX?
76542 has the Highest Percentage of Population Employed in Health Diagnosing & Treating in Killeen, TX with 7.6%.
What is the Percentage of Population Employed in Health Diagnosing & Treating in Killeen, TX?
Percentage of Population Employed in Health Diagnosing & Treating in Killeen is 4.8%.
What is the Percentage of Population Employed in Health Diagnosing & Treating in Texas?
Percentage of Population Employed in Health Diagnosing & Treating in Texas is 5.5%.
What is the Percentage of Population Employed in Health Diagnosing & Treating in the United States?
Percentage of Population Employed in Health Diagnosing & Treating in the United States is 6.2%.