Zip Codes with the Highest Percentage of Population Employed in Legal Services & Support in Killeen, TX
RELATED REPORTS & OPTIONS
Legal Services & Support
Killeen
Compare Zip Codes
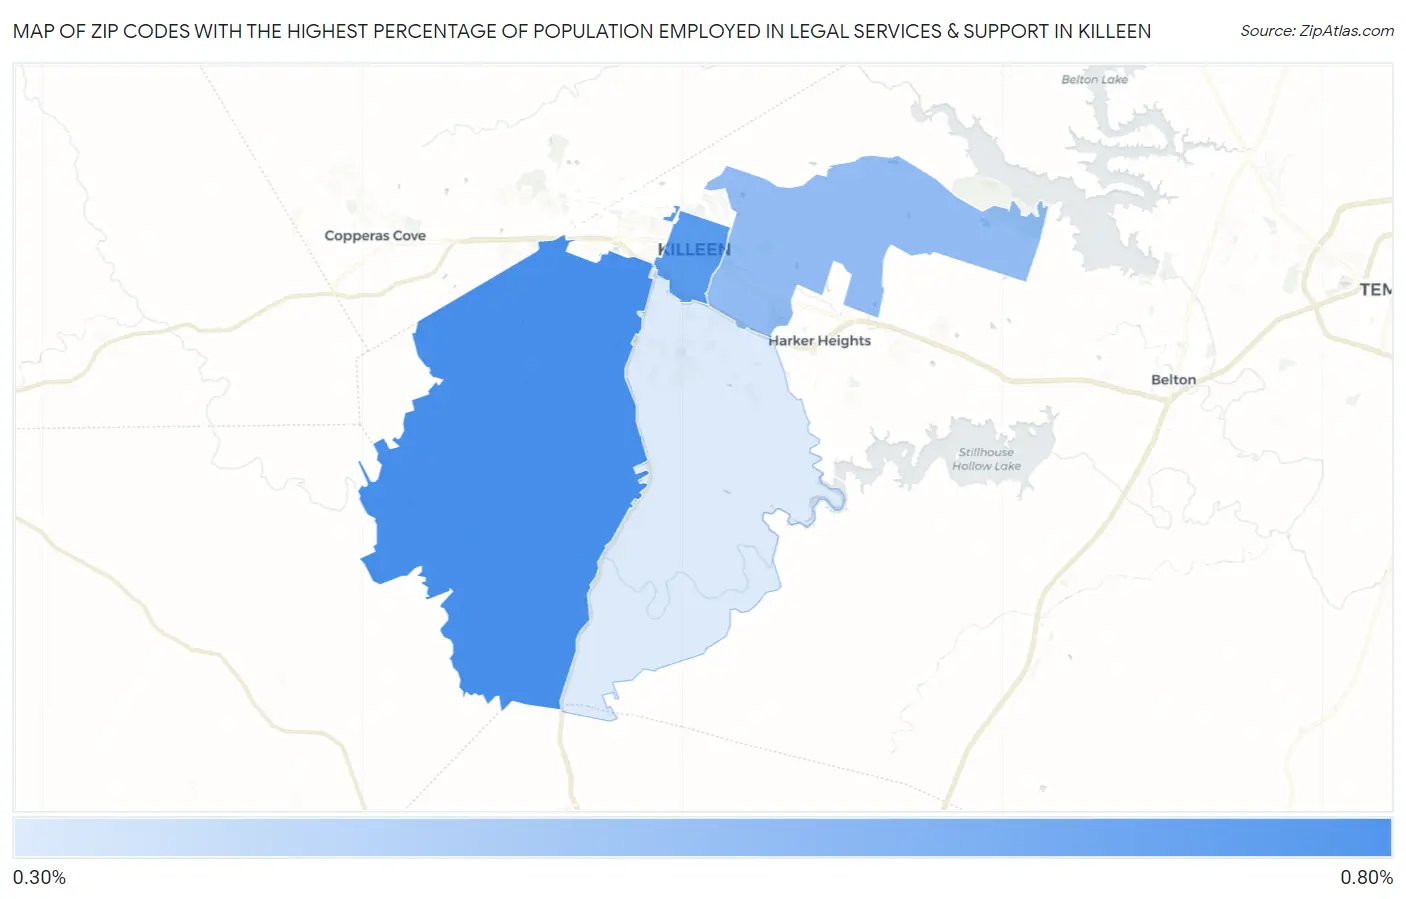
Map of Zip Codes with the Highest Percentage of Population Employed in Legal Services & Support in Killeen
0.34%
0.62%
Zip Codes with the Highest Percentage of Population Employed in Legal Services & Support in Killeen, TX
| Zip Code | % Employed | vs State | vs National | |
| 1. | 76549 | 0.62% | 1.0%(-0.386)#666 | 1.2%(-0.562)#11,219 |
| 2. | 76541 | 0.59% | 1.0%(-0.418)#688 | 1.2%(-0.594)#11,566 |
| 3. | 76543 | 0.48% | 1.0%(-0.529)#772 | 1.2%(-0.704)#12,887 |
| 4. | 76542 | 0.34% | 1.0%(-0.671)#896 | 1.2%(-0.847)#14,617 |
1
Common Questions
What are the Top 3 Zip Codes with the Highest Percentage of Population Employed in Legal Services & Support in Killeen, TX?
Top 3 Zip Codes with the Highest Percentage of Population Employed in Legal Services & Support in Killeen, TX are:
What zip code has the Highest Percentage of Population Employed in Legal Services & Support in Killeen, TX?
76549 has the Highest Percentage of Population Employed in Legal Services & Support in Killeen, TX with 0.62%.
What is the Percentage of Population Employed in Legal Services & Support in Killeen, TX?
Percentage of Population Employed in Legal Services & Support in Killeen is 0.44%.
What is the Percentage of Population Employed in Legal Services & Support in Texas?
Percentage of Population Employed in Legal Services & Support in Texas is 1.0%.
What is the Percentage of Population Employed in Legal Services & Support in the United States?
Percentage of Population Employed in Legal Services & Support in the United States is 1.2%.