Zip Codes with the Highest Percentage of Population Employed in Health Diagnosing & Treating in Abilene, TX
RELATED REPORTS & OPTIONS
Health Diagnosing & Treating
Abilene
Compare Zip Codes
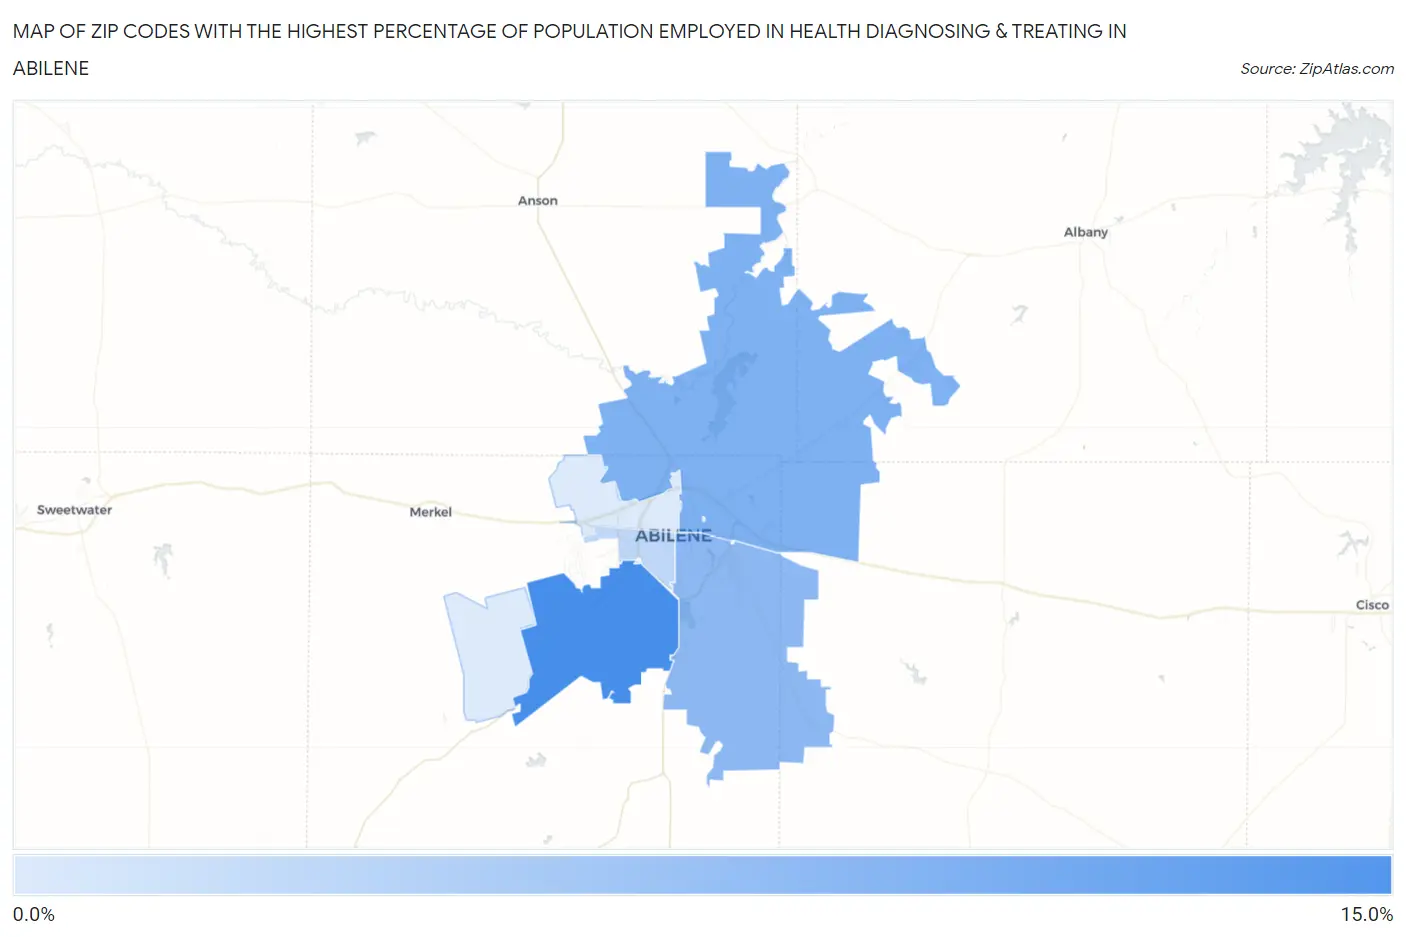
Map of Zip Codes with the Highest Percentage of Population Employed in Health Diagnosing & Treating in Abilene
4.5%
11.2%
Zip Codes with the Highest Percentage of Population Employed in Health Diagnosing & Treating in Abilene, TX
| Zip Code | % Employed | vs State | vs National | |
| 1. | 79606 | 11.2% | 5.5%(+5.70)#116 | 6.2%(+4.97)#2,721 |
| 2. | 79601 | 8.6% | 5.5%(+3.12)#248 | 6.2%(+2.39)#6,057 |
| 3. | 79602 | 8.1% | 5.5%(+2.56)#307 | 6.2%(+1.83)#7,314 |
| 4. | 79605 | 5.8% | 5.5%(+0.245)#642 | 6.2%(-0.481)#14,741 |
| 5. | 79603 | 4.5% | 5.5%(-1.07)#956 | 6.2%(-1.79)#19,821 |
1
Common Questions
What are the Top 5 Zip Codes with the Highest Percentage of Population Employed in Health Diagnosing & Treating in Abilene, TX?
Top 5 Zip Codes with the Highest Percentage of Population Employed in Health Diagnosing & Treating in Abilene, TX are:
What zip code has the Highest Percentage of Population Employed in Health Diagnosing & Treating in Abilene, TX?
79606 has the Highest Percentage of Population Employed in Health Diagnosing & Treating in Abilene, TX with 11.2%.
What is the Percentage of Population Employed in Health Diagnosing & Treating in Abilene, TX?
Percentage of Population Employed in Health Diagnosing & Treating in Abilene is 7.3%.
What is the Percentage of Population Employed in Health Diagnosing & Treating in Texas?
Percentage of Population Employed in Health Diagnosing & Treating in Texas is 5.5%.
What is the Percentage of Population Employed in Health Diagnosing & Treating in the United States?
Percentage of Population Employed in Health Diagnosing & Treating in the United States is 6.2%.